Who are the losers of the economic crisis? Explaining the vote for right-wing populist parties in Europe after the Great Recession
¿Quiénes son los perdedores de la crisis económica? Hacia una explicación del voto a partidos populistas de derecha en Europa tras la Gran Recesión
ABSTRACT
Right-wing populist parties (RWPP) have obtained outstanding electoral results during the Great Recession in Europe. While some authors have adopted a macro level approach to explain this success highlighting the relevance of the context of crisis, others have focused on micro explanations to analyse how the “losers of globalization” (the elderly, less educated and lower class) comprise the main electoral base of these parties. However, RWPP have performed much better in countries less affected by the crisis and, in certain contexts, the so-called “losers” of globalization have not been their main electoral base. Using individual data for 12 Western European countries provided by the European Election Studies (2014) database, in this paper we demonstrate that the combination of these two sets of explanations (at the macro and micro levels) is necessary not only for empirical reasons, but also for conceptual ones to understand the phenomenon. While the general profile of this family of voters tend to be older, less educated and belonging to the lower class, in countries most affected by the crisis RWPP voters tend to be younger and better educated.
Keywords: Great Recession, immigration, populist parties, right-wing populism, electoral behavior.
RESUMEN
Los partidos populistas de derecha han obtenido unos resultados electorales sin precedentes durante la Gran Recesión en Europa. Mientras que algunos autores han adoptado una aproximación a nivel agregado para explicar su éxito, subrayando la importancia del contexto de crisis, otros se han centrado en explicaciones a nivel micro para analizar cómo los «perdedores de la globalización» (los mayores, con menor nivel educativo, y de clase social baja) comprenden la principal base electoral de estos partidos. Sin embargo, el éxito de estas formaciones ha sido mayor en los países menos afectados por la crisis y, en ciertos contextos, los llamados “perdedores” de la globalización no han sido la base electoral de estas formaciones. Utilizando datos individuales de doce países de Europa Occidental, provenientes de la base de datos European Election Studies (2014), en este trabajo demostramos que la combinación de estos dos conjuntos de explicaciones (a nivel macro y micro) es necesaria no solo por razones empíricas, sino también conceptuales, para poder entender el fenómeno. Mientras que el perfil general de esta familia de votantes tiende a ser de mayor edad, con menor nivel educativo y perteneciente a clases sociales bajas, en los países más afectados por la crisis los electores de los partidos populistas de derechas tienden a ser más jóvenes y con un nivel educativo más alto.
Palabras clave: Gran Recesión, inmigración, populismo, partidos populistas de derecha, comportamiento electoral.
INTRODUCTION[up]
Social scientists have been interested in right-wing populist parties (RWPP) for a
long time ( Betz, Hans-George. 1994. Radical Right-Wing Populism in Western Europe. London: McMillan. Available at:
The recent electoral advance of this set of parties in Europe during the Great Recession
has revived interest in the discipline. Parties such as the National Front (FN) in
France, the Independence Party (UKIP) in the United Kingdom, the Danish People’s Party
(DF), the Austrian Freedom Party (FPÖ), Alternative for Germany (AfD), or the Golden
Dawn (XA) in Greece, have been some of the most recent successful recent examples.
One of the main interests of this last boost in the literature on populism has been
in the macro explanations behind the success of these parties ( Brückner, Markus and Hans Peter Grüner. 2010. Economic growth and the rise of political extremism: theory and evidence. Available at:
According to some of these works, the economic crisis Europe experienced since 2008
following a period of economic expansion, generated an increase in economic voting
that firstly led to punishment of national governments ( Bartels, Larry. 2012. “Elections in hard times”, Public Policy Research, 19 (1): 44-50. Available at:
While some of these contributions have focused on macro explanations, some other authors
have highlighted the role played by sociodemographic and attitudinal profiles of certain
voters in these parties’ success ( Arzheimer, Kay and Elisabeth Carter. 2006. “Political opportunity structures and right-wing
extremist party success”, European Journal of Political Research, 45: 419-443. Available at:
How can these counterintuitive and/or contradictory findings at the contextual and
individual levels be explained? Our main argument relies on the unequal distribution
of the economic consequences of the Great Recession across countries and voter profiles.
Previous works have demonstrated that globalization has especially affected the middle-aged,
less educated and low skilled workers, given their position of vulnerability in a
complex and global labor market ( Häusermann, Silja and Hanspeter Kriesi. 2015. “What do Voters Want? Dimensions and
Configurations in Individual Preferences and Party Choice”, in Pablo Beramendi, Pablo,
Silja Häusermann, Herbert Kitschelt and Hanspeter Kriesi (eds.), Politics of Advanced Capitalism. Cambridge: Cambridge University Press. Available at:
However, macro data shows that among the countries hardest hit by the 2008 economic
crisis, the traditional “losers of globalization” have not suffered the worst effects
of the economic recession and, as a consequence, could conform a different profile
of RWPP voters.[2] The labor market flexibility and the relevant increase in the temporary contracts
and unemployment for the younger in poorer countries (such as Greece or Italy) contrasted
with Austria, and Germany, with moderate temporary contracts, lower levels of unemployment
and legislations favoring school-to-work transition ( O’Reilly, Jacqueline, Werner Eichhorst, András Gábos, Kari Hadjivassiliou, David Lain,
Janine Leschke, Seamus McGuinness, Lucia Mýtna Kureková, Tiziana Nazio, Renate Ortlieb,
Helen Russell and Paola Villa. 2015. “Five Characteristics of Youth Unemployment in
Europe: Flexibility, Education, Migration, Family Legacies, and EU Policy”, Sage Open, 5 (1). Available at:
The goal of this paper is to analyse the demand side of the of RWPP’s success[3], using a combination of two sets of explanations: those related to the context (how the 2008 economic crisis affected to different countries) and those related to the voters’ sociodemographic profile (to what extent the “losers of globalization” are the main supporters in each of those contexts). By doing so, we shed some light on the individual traits of citizens who, among the broader ‘party supply’ of right-wing parties in a particular context, decide to vote for a RWPP. Thus, after the Great Recession, in places where the economy is improving, the losers of globalization are RWPP’s main supporters (the oldest, belong to the working class, and have lower levels of education). However, where the economy is in decline (with a notable increase in unemployment rates), the main electoral support for RWPP does not come from the losers of globalization, but from the young people, those who belong to the middle classes and are more educated.
This article is structured as follows: the next section reviews the literature and outlines the hypotheses; secondly, we present the data and methods; then, we comment and discuss the results of the empirical analyses; and finally, we end up with some conclusions.
THEORETICAL FRAMEWORK AND HYPOTHESIS [up]
A broad range of definitions of populism have been provided by different authors,
although the one proposed by Cas Mudde ( Mudde, Cas. 2004. “The Populist Zeitgeist”, Government and Opposition, 39 (4): 541-63. Available at:
The specialized literature has not been consistent on the use of these concepts, placing
the same parties under different labels —parties that Funke et al. ( Funke, Manuel, Schularick Maurice and Christophe Trebesch. 2015. Going to Extremes: Politics after Financial Crisis, 1870-2014. CESIFO Working Papers, 5553 (Category 7: Monetary policy and international finance).2015) label as radical parties, are considered populists by Hernández and Kriesi ( Hernández, Enrique and Hanspeter Kriesi. 2016. “The Electoral Consequences of the
Financial and Economic Crisis in Europe”, European Journal of Political Research, 55 (2): 203-224. Available at:
However, what is the “window of opportunity” for the electoral success of these populist
parties? Following Mudde ( Mudde, Cas. 2004. “The Populist Zeitgeist”, Government and Opposition, 39 (4): 541-63. Available at:
According to this argument, support for RWPP should be higher in contexts most affected
by the economic and political consequences of the Great Recession, such as Greece,
Iceland, Ireland, Italy and Spain, where ‘political resentment’ is higher if we consider
indices such as support for democracy and confidence in political institutions ( Cordero, Guillermo and Pablo Simón. 2016. “Economic Crisis and Support for Democracy
in Europe”, West European Politics, 39 (29): 305-325. Available at:
Mols and Jetten ( Mols, Frank and Jolanda Jetten. 2016. “Explaining the Appeal of Populist Right-Wing
Parties in Times of Economic Prosperity”, Political Psychology, 37 (2): 275-292. Available at:
As we have discussed, analyses of the contexts that facilitate the success of the
populist parties remain inconclusive. Is this lack of satisfactory explanation at
macro level also present at individual level? Or, on the contrary, is there a general
pattern by which people with a specific sociodemographic profile tend to vote for
RWPP? Until the “third wave” of populism in Europe in the eighties, the profile of
the RWPP voter used to be defined as older, belonging to the petit bourgeois, and well educated. However, since the eighties these parties have become successful
thanks to a change in their voter’s profile, as it is younger people, blue collar
and self-employed who have changed their vote ( Mudde, Cas. 2007. Populist Radical Right Parties in Europe. Cambridge: Cambridge University Press.Mudde, 2007). Some other authors have pointed to a change not only in sociodemographic profiles,
but also in values generating a new cleavage due to different processes such as globalization,
denationalization and the opening of national borders ( Kriesi, Hanspter. 2010. “Restructuration of Partisan Politics and the Emergence of
a New Cleavage Based on Values”, West European Politics, 33 (3): 673-685. Available at:
Thus, the RWPP voter’s profile before the eighties was very different from the one
since the nineties. It was at this point that the third wave of populism took place
in Europe, when this family of parties obtained unprecedented electoral results. As
Kriesi et al. ( Kriesi, Hanspeter, Edgar Grande, Roman Lachat, Martin Dolezal, Simon Bornschier, and
Timotheus Frey. 2006. “Globalization and the transformation of the national political
space: Six European countries compared”, European Journal of Political Research, 45: 921-956. Available at:
However, we cannot take for granted that these voters are homogeneous across Europe. The Great Recession affected different European countries in very diverse ways, and the severity of the crisis was not homogeneous in these countries. While among the wealthier countries the consequences of the economic crisis especially negatively affected those who were worst positioned in the global labor market (the “losers of globalization”), in those countries hardest hit by the crisis the profile most affected by the recession has been the young and more educated population[5]. This is why we argue that the “losers of globalization” are not the main electoral support of RWPP in every context during the Great Recession. According to Eurostat,[6] unemployment trends were more pessimistic for those with tertiary education in the poorest countries. In Greece and Italy, the probability of being unemployed for those with tertiary education was, respectively tripled and doubled between 2008 and 2014, while in Germany this probability decreased and remained stable in Sweden and the UK. A similar story can be told if we analyse the relationship between age and employment. While between 2008 and 2014 the employment prospects of the population under 25 improved (Germany) or remained stable (Austria and Sweden) in the richest countries, the rate of unemployment among the youth population increased dramatically in Greece (35.4; while unemployment of the older population increased by 18.0) Italy (24.8, vs. 5,4 among the older) and Belgium (9.8 vs. 1.0). In this context of deep recession, the population who suffered or felt most threaten by the poor work and economic conditions (the younger and better educated) could feel attracted by populist discourses, generating a different profile of RWPP.
According to Mudde ( Mudde, Cas. 2007. Populist Radical Right Parties in Europe. Cambridge: Cambridge University Press.2007: 201), the combination of macro and micro explanations is necessary to understand the object and avoid problems of ecological fallacy. This seems compelling if the unequal effects of the economic crisis among countries and profiles are considered, since such a diversity could generate different losers depending on their economic environment. That is why we also argue that explanations at micro and macro level should be combined in order to analyse the success of RWPP.
This article tries to assess the extent to which RWPP voters during the 2008 Great
Recession are what the existing literature has defined as “losers of globalization”
in different countries ( Kriesi, Hanspeter, Edgar Grande, Roman Lachat, Martin Dolezal, Simon Bornschier, and
Timotheus Frey. 2008. West European Politics in the Age of Globalization. New York: Cambridge University Press. Available at:
In this sense, and following Roberts’ recent contribution ( Roberts, Kenneth. M. 2017. “Party politics in hard times: Comparative perspectives
on the European and Latin American economic crises”, European Journal of Political Research, 56: 218-233. Available at:
H1. In contexts with a better economic situation the elderly, people with a lower level of education and belonging to the working class will be more prone to support RWPP rather than other right-wing parties.
Following our previous argumentation, we expect that the RWPP voters will not be the
“losers of globalization” under contexts of poor economic conditions. As macro-data
demonstrates, people who suffered the worst economic conditions in countries most
affected by the Great Recession were younger and better educated. Thus, the younger
and better educated people (not the traditionally considered ‘losers of globalization’)
could also feel attracted by populist discourses, which in turn generated a different
RWPP voter profile in certain countries. As some case studies have demonstrated, in
Greece and France —both countries experienced a deep downturn on their economies during
the Great Recession— the main RWPP supporters were the youngest and best educated
( Teperoglou, Eftichia, Emmanouil Tsatsanis and Elias Nicolacopoulos. 2015. “Habituating
to the New Normal in a Post-earthquake Party System: The 2014 European Election in
Greece”, South European Society and Politics, 20 (3): 333-355. Available at:
H2. In contexts where the economy is performing poorly, young people and those with high education or belonging to the middle and higher classes will be more prone to support RWPP rather than other right-wing parties.
DATA AND METHODS[up]
As dependent variable, we use vote recall in the last National Elections from the European Election Studies database (EES-2014)[7] for all the 12 Western European democracies with RWPP[8]. In this sample are included countries where the 2008 economic crisis was deeper (Finland, Belgium, The Netherlands, France, Greece and Italy) as well as countries where recession was less pronounced (Austria, Denmark, Germany, Luxembourg, Sweden and the United Kingdom). Although populist parties can also be found on the left and centre of the ideological spectrum, the goal of this article is to analyseparties located on the right side of this scale. More specifically, our strategy of analysis is to study the vote for RWPP compared with other centre-right and right-wing parties[9].
Recent works have analysed how the shifts to the economic left of radical right parties
had serious consequences for the composition of their electorate, because former center-left
and left voters comprised the electoral support of these parties (see Harteveld, Eelco. 2016. “Winning the ‘losers’ but losing the ‘winners’? The electoral
consequences of the radical right moving to the economic left”, Electoral Studies, 44: 225-234. Available at:
Nevertheless, we replicate the analyses implemented in this article by using the alternative dependent variable with values 1 for RWPP voters and 0 for other parties’ voters (also including centre-left and left parties) and abstainers. When using this broader and less conservative categorization, we obtain consistent results (see table A2 in the Appendix).
Table A1 shows the list of references that we have used to design our category of RWPPs. Vote recall[10] in the last National Elections has been selected as a dependent variable in the EES 2014 wave. The set of independent and control variables is presented in table 1. All the variables at individual level included in the models have been normalized (range from 0 to 1) to facilitate the interpretation of the coefficients. In our models we have included four sets of variables. Among the usual sociodemographic factors (age, gender, work status, social class, educational level and habitat) we have also introduced individual economic and political variables. The economic evaluations (prospective and retrospective), and the main problems in a country (political, economic, unemployment, and immigration) are important factors that determine the support for a RWPP; thus, we include these in our models. As political factors we introduce political interest, ideology (from 0, left, to 1, right), confidence in the national parliament and party identification. Finally, we test the impact of economic contextual factors, GDP growth and unemployment growth[11], in support for RWPP. In addition, we introduce the growth in the rate of immigration[12] in the country and the type of electoral system (proportional or majority) as control variables at the contextual level.
Table 1.
Description of variables included in the models
| Variable | N | Mean | S.D | Min | Max |
|---|---|---|---|---|---|
| RWPP vs RP | 4520 | 0.17 | 0.37 | 0 | 1 |
| Age | 13463 | 0.42 | 0.22 | 0 | 0.98 |
| Female | 13481 | 0.52 | 0.50 | 0 | 1 |
| University | 12408 | 0.37 | 0.48 | 0 | 1 |
| Unemployed | 13481 | 0.07 | 0.26 | 0 | 1 |
| City | 13471 | 0.28 | 0.45 | 0 | 1 |
| Working class | 12900 | 0.32 | 0.47 | 0 | 1 |
| Economy Retrospective | 13219 | 0.46 | 0.26 | 0 | 1 |
| Economy Prospective | 12934 | 0.51 | 0.24 | 0 | 1 |
| Problem Unemployment | 11573 | 0.25 | 0.43 | 0 | 1 |
| Problem Economy | 11573 | 0.18 | 0.38 | 0 | 1 |
| Problem Immigration | 11573 | 0.08 | 0.27 | 0 | 1 |
| Problem Political | 11573 | 0.01 | 0.10 | 0 | 1 |
| Political Interest | 11573 | 0.53 | 0.32 | 0 | 1 |
| Ideology | 11700 | 0.50 | 0.24 | 0 | 1 |
| Confidence Parliament | 13148 | 0.60 | 0.49 | 0 | 1 |
| Party Identification | 13481 | 0.38 | 0.49 | 0 | 1 |
| Δ GDP | 13481 | 0.17 | 1.55 | -3.20 | 4.20 |
| Δ Unemployment | 13481 | 3.13 | 5.08 | -2.40 | 18.70 |
| Δ Immigration | 13481 | 0.10 | 1.09 | -0.8 | 3.8 |
| Proportional Electoral System | 13481 | 0.81 | 0.40 | 0 | 1 |
Source: own elaboration based on EES 2014.
The main goal of our paper is to combine macro and micro explanations to determine
the extent to which different contexts generate different profiles of RWPP voters,
as proposed in hypotheses 1 and 2. For this reason, we make interact the variables
at macro level (change in GDP and unemployment,) and the main socio-demographic variables
at individual level (age, social class, and educational level). To do so, we run a
multilevel logistic regression. The results of this model are shown in table 2 in the results section. Being aware that 12 countries may be few cases at the upper
level for this kind of regression —despite we cover all the Western European countries
with right-wing populist parties and although other studies using less than 12 cases
in the upper level ( Stegmueller, Daniel. 2013. “How Many Countries for Multilevel Modeling? A Comparison
of Frequentist and Bayesian Approaches”, American Journal of Political Science, 57 (3): 748-761. Available at:
RESULTS AND DISCUSSION[up]
Is there a common RWPP voter profile among countries most and less hit by the Great Recession? The Additive Model (Model 0) in table 2[13] shows that men, the youngest, those with higher education levels, the unemployed, those from urban areas and those who belong to the working class show a high probability of supporting RWPP rather than right-wing parties in National Elections. RWPP voters were especially critical of the political situation, showing lower levels of confidence in the National Parliament than right-wing party voters. In addition, the retrospective and prospective sociotropic economic variables are significant to vote for a RWPP against a right-wing party. This group of voters express more negative evaluations of their past economic situation than right-wing voters. “Considering immigration a problem for the country” is another significant factor explaining the vote for RWPP versus right-wing parties. All these results are consistent with the findings shown in table A2, where we use an alternative dependent variable that includes voters for centre and left-wing parties as well as abstainers.
Table 2.
Explaining the vote for Right Wing populist parties versus right parties in 12 Western European countries: a multilevel analysis with interactions between sociodemographic and contextual factorsa
| Adittive | Δ GDP | Δ Unemployment | |||||
|---|---|---|---|---|---|---|---|
| Model 0 | Model 1 | Model 2 | Model 3 | Model 4 | Model 5 | Model 6 | |
| Age | -0.58[*] | -0.56[+] | -0.56[+] | -0.57[+] | -0.13 | -0.55[+] | -0.57[+] |
| (0.29) | (0.29) | (0.29) | (0.29) | (0.35) | (0.29) | (0.29) | |
| University | 0.25[*] | 0.23[+] | 0.23[+] | 0.24[*] | 0.23[+] | 0.10 | 0.23[+] |
| (0.12) | (0.12) | (0.12) | (0.12) | (0.12) | (0.14) | (0.12) | |
| Female | -0.60[***] | -0.60[***] | -0.60[***] | -0.60[***] | -0.60[***] | -0.60[***] | -0.60[***] |
| (0.11) | (0.11) | (0.11) | (0.11) | (0.11) | (0.11) | (0.11) | |
| Unemployed | 0.55[*] | 0.52[*] | 0.54[*] | 0.55[*] | 0.53[*] | 0.53[*] | 0.54[*] |
| (0.24) | (0.24) | (0.24) | (0.24) | (0.24) | (0.24) | (0.24) | |
| City | 0.21[+] | 0.23[+] | 0.22[+] | 0.21 | 0.23[+] | 0.22[+] | 0.20 |
| (0.13) | (0.13) | (0.13) | (0.13) | (0.13) | (0.13) | (0.13) | |
| Working class | 1.03[***] | 1.06[***] | 1.05[***] | 1.05[***] | 1.05[***] | 1.05[***] | 1.19[***] |
| (0.13) | (0.13) | (0.13) | (0.13) | (0.13) | (0.13) | (0.15) | |
| Eco. Retrospective | -0.86[**] | -0.88[**] | -0.85[**] | -0.85[**] | -0.86[**] | -0.84[**] | -0.85[**] |
| (0.31) | (0.31) | (0.31) | (0.31) | (0.31) | (0.31) | (0.31) | |
| Eco. Prospective | -0.88[**] | -0.90[**] | -0.86[**] | -0.88[**] | -0.89[**] | -0.86[**] | -0.90[**] |
| (0.31) | (0.31) | (0.31) | (0.31) | (0.31) | (0.31) | (0.31) | |
| Pr. Unemployment | -0.23 | -0.23 | -0.22 | -0.22 | -0.24 | -0.22 | -0.22 |
| (0.15) | (0.15) | (0.15) | (0.15) | (0.15) | (0.15) | (0.15) | |
| Pr. Economy | -0.28[+] | -0.30[+] | -0.28[+] | -0.27[+] | -0.29[+] | -0.28[+] | -0.27[+] |
| (0.16) | (0.16) | (0.16) | (0.16) | (0.16) | (0.16) | (0.16) | |
| Pr. Immigration | 0.56[**] | 0.55[**] | 0.57[**] | 0.57[**] | 0.56[**] | 0.57[**] | 0.56[**] |
| (0.19) | (0.19) | (0.19) | (0.19) | (0.19) | (0.19) | (0.19) | |
| Pr. Politics | -0.91 | -0.98 | -0.94 | -0.90 | -0.94 | -0.92 | -0.89 |
| (0.78) | (0.78) | (0.78) | (0.78) | (0.78) | (0.78) | (0.78) | |
| Political Interest | -0.09 | -0.07 | -0.09 | -0.09 | -0.08 | -0.10 | -0.09 |
| (0.19) | (0.20) | (0.19) | (0.19) | (0.19) | (0.19) | (0.19) | |
| Ideology | 0.22 | 0.20 | 0.19 | 0.22 | 0.21 | 0.19 | 0.24 |
| (0.29) | (0.29) | (0.29) | (0.29) | (0.29) | (0.29) | (0.29) | |
| Confidence Parl. | -1.29[***] | -1.27[***] | -1.30[***] | -1.28[***] | -1.28[***] | -1.29[***] | -1.27[***] |
| (0.13) | (0.13) | (0.13) | (0.13) | (0.13) | (0.13) | (0.13) | |
| Party Id. | 0.18 | 0.18 | 0.19[+] | 0.18 | 0.18 | 0.19[+] | 0.18 |
| (0.11) | (0.11) | (0.11) | (0.11) | (0.11) | (0.11) | (0.11) | |
| Δ GDP | -0.92[+] | -1.24[*] | -0.88[+] | -0.95[+] | -0.94[+] | -0.93[+] | -0.92[+] |
| (0.52) | (0.54) | (0.52) | (0.52) | (0.53) | (0.52) | (0.52) | |
| Δ UNEMPL | -0.20[+] | -0.21[+] | -0.20[+] | -0.19[+] | -0.15 | -0.21 | -0.18 |
| (0.11) | (0.11) | (0.11) | (0.11) | (0.12) | (0.11) | (0.11) | |
| Δ IMMIG | -0.34 | -0.33 | -0.34 | -0.35 | -0.33 | -0.34 | -0.34 |
| (0.50) | (0.51) | (0.50) | (0.50) | (0.51) | (0.50) | (0.50) | |
| Pr. SYSTEM | -0.19 | -0.19 | -0.26 | -0.15 | -0.21 | -0.21 | -0.17 |
| (1.11) | (1.12) | (1.11) | (1.11) | (1.12) | (1.11) | (1.11) | |
| Age[*]Macro | 0.68[**] | -0.12[*] | |||||
| (0.22) | (0.05) | ||||||
| Univ[*]Macro | -0.16[+] | 0.04[+] | |||||
| (0.09) | (0.02) | ||||||
| W. Class[*]Macro | 0.10 | -0.04[+] | |||||
| (0.09) | (0.02) | ||||||
| Cwwonstant | 1.03 | 1.03 | 1.10 | 0.97 | 0.84 | 1.10 | 0.93 |
| (1.17) | (1.17) | (1.17) | (1.16) | (1.18) | (1.17) | (1.17) | |
| Constant | 0.18 | 0.19 | 0.18 | 0.18 | 0.19 | 0.18 | 0.18 |
| (0.23) | (0.23) | (0.23) | (0.23) | (0.23) | (0.23) | (0.23) | |
| Observations | 3536 | 3536 | 3536 | 3536 | 3536 | 3536 | 3536 |
| N | 12 | 12 | 12 | 12 | 12 | 12 | 12 |
| Log lik. | -1134.44 | -1129.45 | -1132.65 | -1133.79 | -1131.69 | -1132.87 | -1132.79 |
| BIC | 2448.63 | 2446.83 | 2453.23 | 2455.51 | 2451.31 | 2453.67 | 2453.52 |
| AIC | 2312.87 | 2304.90 | 2311.31 | 2313.58 | 2309.38 | 2311.74 | 2311.59 |
As discussed above, the best electoral results for RWPP are not found among people most hit by the economic crisis. However, the coefficient of the increase in GDP when predicting the vote for RWPP is negative (see Additive Model) —these parties have received substantial electoral support in countries which experienced relative (but not severe) economic contraction, such as Belgium, Finland, France and the Netherlands— as Kriesi and Pappas ( Kriesi, Hanspeter and Takis Pappas (eds.). 2015. European Populism in the Shadow of the Great Recession. Colchester: ECPR.2015: 323) pointed out: “During the Great Recession populism in Europe increased notably”. In the same vein, countries that experienced an improvement in their labor market (with a reduction in the unemployment rate) are the countries where the RWPP obtained their highest probability of vote.
Thus, in line with previous works, our findings found no clear correlation between
macroeconomic indicators and RWPP’s success ( Mudde, Cas. 2007. Populist Radical Right Parties in Europe. Cambridge: Cambridge University Press.Mudde, 2007). As discussed above, our results also coincide with those revealed by Mols and Jetten
( Mols, Frank and Jolanda Jetten. 2016. “Explaining the Appeal of Populist Right-Wing
Parties in Times of Economic Prosperity”, Political Psychology, 37 (2): 275-292. Available at:
However, the goal of our paper was to analyse the extent to which the Great Recession generated different RWPP voter profiles in countries most and least hit by the economic crisis. Following our argument, it seems necessary to examine the interaction between variables at macroeconomic and individual levels.
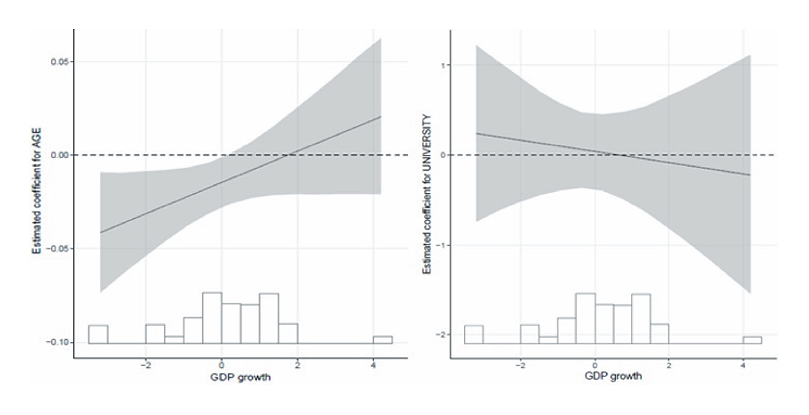
In table A2, models ranged from 1 to 3 show the interaction between our selected sociodemographic variables and GDP growth. Those ranged between 4 and 6 show the interaction between unemployment growth and age, educational level and social class[14]. For the sake of simplicity, we show here the graphical representation of the statistically significant interactions of the model. Firstly, Figure 1 shows the predicted probabilities for an elector to vote for a RWPP (vs. a right-wing party) by interacting age and educational level with GDP growth.
Figure 1 (left side) shows that the effect of age is moderately positive (see the interaction in Model 1, table 2). During the Great Recession, when the GDP grows the probability to vote for a RWPP in National Elections is higher among older voters. On the contrary, in a context of a fall in GDP, the youngest tend to support RWPP to a greater extent than they support right-wing parties. In the right side of figure 1, the interaction between educational level and GDP growth is negative and significant at the 0.10 level: with negative values in the GDP growth, voters with university education tend to support RWPP to a greater extent than those with lower levels of education. On the contrary, the least educated people tend to support RWPP in countries with a better economic situation.
Figure 1.
Interaction between age and education and GDP growth
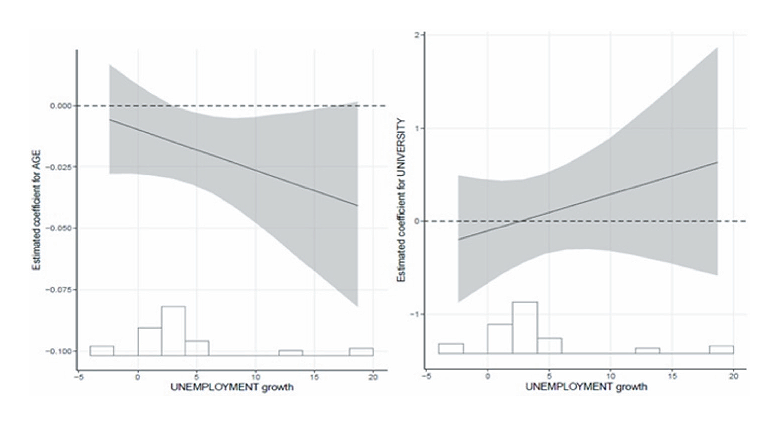
The interactions between the same socio-demographic variables (age and education) with the rate of unemployment at country level complements this profile, as shown in figure 2. The left side of the figure illustrates the interaction term between age and unemployment growth (model 4 in table 2): the effect of unemployment on age is negative, where unemployment has grown during the crisis, younger voters are more likely to vote for a RWPP. In this sense, in those countries where the economic crisis had a direct effect on unemployment rates, the “losers of globalization” and those more prone to support a party with a populist discourse are the young and not the old, as the literature has conventionally argued. The right side of the figure shows that the interaction between unemployment growth and educational level is positive: voters with a higher educational level in a context of unemployment growth show a greater propensity to give their support to a RWPP than to a right-wing party (see the interaction in model 5, table 2). Under these economic circumstances, voters with a high educational level are attracted by RWPP and tend to cast their vote for them.
Figure 2.
Interaction between age and education and unemployment growth
Thus, figures 1 and 2 confirm our first and second hypotheses, complementing the previous literature on the profiles of RWPP parties. Where economic conditions have worsened during the Great Recession, the young and those with a higher educational level are more prone to support RWPP versus right-wing parties. Nevertheless, when economic conditions improve, the older and those with a lower level of education tend to support RWPP. Following the previous literature, globalization divided the electorate into two groups: the younger and high skilled voters (or “winners of globalization”), on the one hand and the older and low skilled voters (or “losers of globalization”), on the other. However, the Great Recession affected in a different way to these two profiles in different contexts. While in some countries (such as Denmark and Austria) the latter have been the main supporters of RWPP, in other countries (such as Italy, Greece, or the Netherlands), the former have comprise the electoral base for these parties.
These findings complement recent literature by pointing to the relevance of the contextual economic variables that necessarily interact with the voter’s characteristics to determine their electoral behavior. In general terms we show that during the Great Recession, in contexts of economic growth the older, those belonging to the working class and those with lower levels of education were more prone to cast a vote for a populist right-wing party than for a right-wing party, while where the economy was in decline, it was the young voter with university education who supported this kind of party, rather than other right-wing parties (interaction results shown in table 2 remain significant and with the same sign in table A3 using a logistic regression). Thus, unlike other previous studies, we demonstrate that during the Great Recession the traditionally considered “losers of globalization” have been the main electoral supporters of RWPP only in certain countries, while in those contexts most affected by the Great Recession this assumption is not valid.
CONCLUSIONS [up]
Works studying RWPP have been numerous in recent years and have had new impetus since the success of this party family during the Great Recession. This literature has focused on explaining the demand side of the phenomenon from explanations at micro (such as the characteristics and attitudes of their voters) and macro level (exploring various economic factors of success or failure of these parties). However, the combination of both types of explanatory factors as elements conditioning the vote for populist parties has been neglected so far.
Faced with this context, this article shows that focusing on either one of these sides provides only partial explanations and can lead to misleading conclusions. In this sense, we argue that studies stating that RWPP’s success during the Great Recession was possible thanks to the electoral support of the “losers of globalization” forget the fact that different economic contexts may generate different voter profiles. Specifically, in countries where GDP declined and unemployment increased, the younger and more educated (namely, people who suffered the deepest consequences of the crisis) showed a greater propensity to support RWPP. In such contexts of relative economic deprivation, loosening the labor conditions for young and well-educated people may generate a new RWPP voter profile, who may feel attracted by these parties’ populist discourses, moving thus away from traditional right-wing parties. On the other hand, support for RWPP is higher among the elderly and less educated people in countries less affected by economic recession, where these profiles correspond to the traditional “losers of globalization”.
Thus, we have emphasized that RWPP voters have different sociodemographic profiles in different contexts, depending on the effects of the Great Recession. While in some countries the effects of the crisis were more dramatic for the more educated and youth population, in other places the elderly and less educated became the main victims of recession. As a consequence, during the Great Recession, the traditional “losers of globalization” have remained the key RWPP electoral base only in countries less harmed by the crisis, while the RWPP voter profile was the opposite in countries more hit by the economic situation. These findings shed new light on the explanation of voting for RWPP parties in contexts of economic crisis. And they underscore the need to combine individual and contextual explanations and the need to apply different explanations to different contexts to understand RWPP’s success.
Notes[up]
| [1] |
The term “losers of globalization” refer to those voters (the elderly, less educated, and lower class) that resulted most affected by the modernization and denationalization process that most of the Western European countries experienced in the recent decades. |
| [2] |
See, for instance, the Council Recommendation on April 2013, for a “Youth Guarantee”. Online Access: http://eur-lex.europa.eu/LexUriServ/LexUriServ.do?uri=OJ:C:2013:120:0001: 0006:EN:PDF. |
| [3] |
It is relevant to clarify that by “RWPP” (Right-Wing Populist Parties) we are not referring to “radical right parties”, “radical right populist parties”, “far-right parties” or “extreme right parties”. We refer to a set of parties that share both a rightist and an anti-elite leaning, emphasizing issues related to the defence of their culture with a discourse against immigration. The main characteristics of these parties are their populist message and their position in the right wing of the ideological spectrum, being more or less extreme in different countries and cases. Although every classification is questionable, we consider the one of Mudde ( Mudde, Cas. 2007. Populist Radical Right Parties in Europe. Cambridge: Cambridge University Press.2007:44) well established in the literature and follow his criteria. We also justify the inclusion of each one of these parties with previous literature at the bottom of table A1. |
| [4] |
Mudde also mentions the presence of “an attractive populist leader”, although the analysis of the supply side (such as the study of RWPP leaders); discourses; or the presence of other populist parties in the party system, is not the goal of this article. |
| [5] |
See the ECB report: “The Impact of the Economic Crisis in Euro Area Labour Markets”. Online Access: https://bit.ly/2ytWjuH. |
| [6] |
See the Eurostat reports for 2008 https://bit.ly/2Pncvaw and 2010
https://bit.ly/2PMvPLf. See Bell and Blanchflower ( Bell, David N. F. and David G. Blanchflower. 2011. “Young people and the Great Recession”,
Oxford Review of Economic Policy, 27 (2): 241-267. Available at:
|
| [7] |
Online access to EES: http://europeanelectionstudies.net/european-election-studies. |
| [8] |
We are conscious that the framing time of analysis could affect our results. Nevertheless, all of the general elections included in our analysis took place after the explosion of the Great Recession (2008), being the best scenario to answer to what extent the economic crisis conditioned voters’ electoral behavior. Further analyses could develop to what extent the profile of RWPP remain constant. |
| [9] |
For the sake of simplicity, we will henceforth refer to these parties as “right-wing parties”. |
| [10] |
Year of National Election by country: Austria 2013, Belgium 2014, Denmark 2011, Finland 2011, France 2012, Germany 2013, Greece 2012, Italy 2013, Luxembourg 2013, Sweden 2010, The Netherlands 2012 and UK 2010 (EES data was collected in June 2014). |
| [11] |
Information about GDP and unemployment growth provided by Eurostat (see: http://ec.europa.eu/eurostat/web/main/home). We calculate the differences between the levels of economic and social indicators between 2008 (the beginning of the Great Recession) and 2014 (when the EES interviews were conducted). |
| [12] |
Information about immigration growth provided by Eurostat (see: http://ec.europa.eu/eurostat/web/main/home). We calculate the differences between the percentage of immigration by country between 2008 (the beginning of the Great Recession) and 2014 (when the EES interviews were conducted). |
| [13] |
In order to prevent collinearity among our independent variables, both at the aggregate and at individual level (one of the assumptions of regression models), we have computed their correlations (see table A5 in the Appendix). While the threshold is usually considered to be 0.70, the highest correlation among our independent variables is 0.58 (“economic prospective” and “economic retrospective”). |
| [14] |
We have estimated the same models shown in this article by excluding the “extreme
cases” (see table A6 in the Appendix). Using the “extreme” command, developed for Stata by Nicholas J.
Cox ( Cox, Nicholas J. 2003. EXTREMES: Stata module to list extreme values of a variable. Statistical Software Components, S430801, Boston College Department of Economics.2003), we can identify and drop from our sample the extreme (highest and lowest) cases
(in this case, those belonging to Luxembourg and Greece). Results partially confirm
H1 and H2. The additional multilevel models’ results highlight that in a context of
GDP growth the older are more prone to support RWPP whereas younger voters are attracted
by RWPP in a context of unemployment increase (both interactions show a high coefficient
and gains statistical significance). This underlines Ronald Ingleharts` ( Inglehart, Ronald. 1971. “The Silent Revolution in Europe: Intergenerational Change
in Post-Industrial Societies”, American Political Science Review, 65 (4): 991-1017. Available at:
|
References[up]
|
Anduiza, Eva and Guillermo Rico. 2016. “Economic correlates of populist attitudes: An analysis of nine European countries”. Paper Presented in a Conference in the Central European University. Available from: https://bit.ly/2hVrcBP. |
|
|
Arzheimer, Kay and Elisabeth Carter. 2006. “Political opportunity structures and right-wing extremist party success”, European Journal of Political Research, 45: 419-443. Available at: https://doi.org/10.1111/j.1475-6765.2006.00304.x |
|
|
Aslanidis, Paris. 2016. “Is Populism an Ideology? A Refutation and a New Perspective”, Political Studies, 64 (1): 88-104. Available at: https://doi.org/10.1111/ 1467-9248.12224. |
|
|
Bakker, Bert N., Matthijs Rooduijn and Gijs Schumacher. 2016. “The psychological roots of populist voting: Evidence from the United States, the Netherlands and Germany”, European Journal of Political Research, 55: 302-320. Available at: https://doi.org/10.1111/1475-6765.12121. |
|
|
Bartels, Larry. 2012. “Elections in hard times”, Public Policy Research, 19 (1): 44-50. Available at: https://doi.org/10.1111/j.1744-540X.2012.00681.x |
|
|
Bell, David N. F. and David G. Blanchflower. 2011. “Young people and the Great Recession”, Oxford Review of Economic Policy, 27 (2): 241-267. Available at: https://doi.org/10.1093/oxrep/grr011. |
|
|
Betz, Hans-George. 1993. “The New Politics of Resentment: Radical Right-Wing Populist Parties in Western Europe”, Comparative Politics, 25 (4): 413-427. Available at: https://doi.org/10.2307/422034. |
|
|
Betz, Hans-George. 1994. Radical Right-Wing Populism in Western Europe. London: McMillan. Available at: https://doi.org/10.1007/978-1-349-23547-6. |
|
|
Bermeo, Nancy and Larry Bartels. 2014. Mass Politics in Tough Times: Opinions, Votes and Protest in the Great Recession. Oxford: Oxford University Press. Available at: https://doi.org/10.1093/acprof:oso/9780199357505.003.0001. |
|
|
Beyme, Klaus von. 1985. Political parties in Western democracies. New York: St. Martin’s Press. |
|
|
Boomgaarden, Hajo G. and Rens Vliegenthart. 2007. “Explaining the Rise of Anti-Immigrant Parties: The Role of News Media Content in the Netherlands”, Electoral Studies, 26 (2): 404-417. Available at: https://doi.org/10.1016/j.electstud.2006.10.018. |
|
|
Bornschier, Simon. 2010. Cleavage Politics and the Populist Right. The New Cultural Conflict in Western Europe. Philadelphia: Temple University Press. |
|
|
Bornschier, Simon and Hanspeter Kriesi. 2012. “The populist right, the working class, and the changing face of class politics”, in J. Rydgren (ed.), Class Politics and the Radical Right. Abingdon and New York: Routledge. |
|
|
Brückner, Markus and Hans Peter Grüner. 2010. Economic growth and the rise of political extremism: theory and evidence. Available at: https://bit.ly/2qPo3Y8. |
|
|
Canovan, Magaret. 1999. “Taking Politics to the People: Populism as the Ideology of Democracy”, in Y. Mény et al., Democracies and the Populist Challenge. New York: Palgrave Macmillan. |
|
|
Carter, Elisabeth. 2005. The Extreme Right in Western Europe. Manchester: Manchester University Press. |
|
|
Cordero, Guillermo and Pablo Simón. 2016. “Economic Crisis and Support for Democracy in Europe”, West European Politics, 39 (29): 305-325. Available at: https://doi.org/10.1080/01402382.2015.1075767. |
|
|
Cox, Nicholas J. 2003. EXTREMES: Stata module to list extreme values of a variable. Statistical Software Components, S430801, Boston College Department of Economics. |
|
|
Dalio, Ray, Kryger Steven, Rogers Jason and Gardener Davis. 2017. “Populism: The Phenomenon”, Bridgewater: Daily Observations, 203: 226-303, Available at: http://www.obela.org/system/files/Populism.pdf. |
|
|
Evans, Jocelyn A. 2005. “The Dynamics of Social Change in Radical Right-wing Populist Party Support”, Comparative European Politics, 3: 76-101. Available at: https://doi.org/10.1057/palgrave.cep.6110050. |
|
|
Ford, Robert and Matthew J. Goodwin. 2014. Revolt on the Right: Explaining Support for the Radical Right in Britain. London: Routledge. |
|
|
Funke, Manuel, Schularick Maurice and Christophe Trebesch. 2015. Going to Extremes: Politics after Financial Crisis, 1870-2014. CESIFO Working Papers, 5553 (Category 7: Monetary policy and international finance). |
|
|
Gidron, Noam and Bard Bonikowski. 2013. Varieties of populism: Literature review and research agenda. Harvard University: Weatherhead Center for International affairs, 13-0004. |
|
|
Harteveld, Eelco. 2016. “Winning the ‘losers’ but losing the ‘winners’? The electoral consequences of the radical right moving to the economic left”, Electoral Studies, 44: 225-234. Available at: https://doi.org/10.1016/j.electstud.2016.08.015. |
|
|
Häusermann, Silja and Hanspeter Kriesi. 2015. “What do Voters Want? Dimensions and Configurations in Individual Preferences and Party Choice”, in Pablo Beramendi, Pablo, Silja Häusermann, Herbert Kitschelt and Hanspeter Kriesi (eds.), Politics of Advanced Capitalism. Cambridge: Cambridge University Press. Available at: https://doi.org/10.1017/CBO9781316163245.009. |
|
|
Hawkins, Kirk A. 2009. “Is Chavez Populist? Measuring Populist Discourse in Comparative Perspective”, Comparative Political Studies, 42 (8): 1040-1067. Available at: https://doi.org/10.1177/0010414009331721. |
|
|
Hernández, Enrique and Hanspeter Kriesi. 2016. “The Electoral Consequences of the Financial and Economic Crisis in Europe”, European Journal of Political Research, 55 (2): 203-224. Available at: https://doi.org/10.1111/1475-6765.12122. |
|
|
Inglehart, Ronald. 1971. “The Silent Revolution in Europe: Intergenerational Change in Post-Industrial Societies”, American Political Science Review, 65 (4): 991-1017. Available at: https://doi.org/10.2307/1953494. |
|
|
Inglehart, Ronald and Pippa Norris. 2016. Trump, Brexit and the rise of populism: Economic Have-nots and cultural backlash. Faculty Research Working Paper Series. |
|
|
Ivarsflaten, Elisabeth. 2005. “Threatened by diversity: Why Restrictive Asylum and Immigration Policies Appeal to Voters in Western Europe”, Journal of Elections, Public Opinion and Parties 15 (1): 21-45. Available at: https://doi.org/10.1080/ 13689880500064577. |
|
|
Ivarsflaten, Elisabeth. 2008. “What Unites the Populist Right in Western Europe? Reexamining grievance mobilization models in seven successful cases”, Comparative Political Studies, 41 (1): 3-23. Available at: https://doi.org/10.1177/001041 4006294168. |
|
|
Jesuit, David and Vincent Mahler. 2004. “Immigration, economic well-being and support for extreme right parties in western European regions”. Paper presented at the LIS Conference, Luxembourg. Available at: http://www.lisdatacenter.org/wps/liswps/391.pdf. |
|
|
Kaufmann, Eric. 2017. “Levels or changes? Ethnic context, immigration and the UK Independence Party Vote”, Electoral Studies, 48, 57-69. Available at: https://doi.org/10.1016/j.electstud.2017.05.002. |
|
|
Kriesi, Hanspter. 2010. “Restructuration of Partisan Politics and the Emergence of a New Cleavage Based on Values”, West European Politics, 33 (3): 673-685. Available at: https://doi.org/10.1080/01402381003654726. |
|
|
Kriesi, Hanspeter, Edgar Grande, Roman Lachat, Martin Dolezal, Simon Bornschier, and Timotheus Frey. 2008. West European Politics in the Age of Globalization. New York: Cambridge University Press. Available at: https://doi.org/10.1017/CBO9780511790720. |
|
|
Kriesi, Hanspeter, Edgar Grande, Roman Lachat, Martin Dolezal, Simon Bornschier, and Timotheus Frey. 2006. “Globalization and the transformation of the national political space: Six European countries compared”, European Journal of Political Research, 45: 921-956. Available at: https://doi.org/10.1111/j.1475-6765.2006.00644.x. |
|
|
Kriesi, Hanspeter, Edgar Grande, Martin Dolezal, Marc Helbling, Dominic Höglinger, Swen Hutter and Bruno Wüst. 2012. Political Conflict in Western Europe. Cambridge; New York: Cambridge University Press. Available at: https://doi.org/10.1017/CBO9781139169219. |
|
|
Kriesi, Hanspeter and Takis Pappas (eds.). 2015. European Populism in the Shadow of the Great Recession. Colchester: ECPR. |
|
|
Laclau, Ernesto. 1977. Politics and Ideology in Marxist Theory. London: New Left Books. |
|
|
Magalhaes, Pedro. 2014. “Financial Crisis, Austerity, and Electoral Politics”, Journal of Elections, Public Opinion and Parties, 24 (2): 125-133. Available at: https://doi.org/10.1080/17457289.2014.887090. |
|
|
Mols, Frank and Jolanda Jetten. 2016. “Explaining the Appeal of Populist Right-Wing Parties in Times of Economic Prosperity”, Political Psychology, 37 (2): 275-292. Available at: https://doi.org/10.1111/pops.12258. |
|
|
Mols, Frank and Jolanda Jetten. 2017. The Wealth Paradox. Economic Prosperity and the Hardening of attitudes. Cambridge: Cambridge University Press. Available at: https://doi.org/10.1017/9781139942171. |
|
|
Mudde, Cas. 2004. “The Populist Zeitgeist”, Government and Opposition, 39 (4): 541-63. Available at: https://doi.org/10.1111/j.1477-7053.2004.00135.x. |
|
|
Mudde, Cas. 2007. Populist Radical Right Parties in Europe. Cambridge: Cambridge University Press. |
|
|
Mudde, Cas. 2010. “The Populist Radical Right: A Pathological Normalcy”, West European Politics, 33 (6): 1167-1186. Available at: https://doi.org/10.1080/01402382.2010.508901. |
|
|
Mudde, Cas. 2014. “Fighting the system? Populist radical right parties and party system change”, Party Politics, 20 (2): 217-226. Available at: https://doi.org/10.1177/1354068813519968. |
|
|
Oesch, Daniel and Line Rennwald. 2010. “The Class Basis of Switzerland’s Cleavage between the New Left and the Populist Right”, Swiss Political Science Review, 16 (3): 343-371. Available at: https://doi.org/10.1002/j.1662-6370.2010.tb00433.x. |
|
|
O’Higgins, Niall. 2012. “This Time It’s Different? Youth Labour Markets during ‘The Great Recession”, Comparative Economic Studies, 54: 395-412. Available at: https://doi.org/10.1057/ces.2012.15. |
|
|
O’Reilly, Jacqueline, Werner Eichhorst, András Gábos, Kari Hadjivassiliou, David Lain, Janine Leschke, Seamus McGuinness, Lucia Mýtna Kureková, Tiziana Nazio, Renate Ortlieb, Helen Russell and Paola Villa. 2015. “Five Characteristics of Youth Unemployment in Europe: Flexibility, Education, Migration, Family Legacies, and EU Policy”, Sage Open, 5 (1). Available at: https://doi.org/10.1177/2158244015574962. |
|
|
Rydgren, Jens. 2007. “The sociology of the Radical Right”, Annual Review of Sociology, 33: 241-262. Available at: https://doi.org/10.1146/annurev.soc.33.040406.131752. |
|
|
Roberts, Kenneth. M. 2017. “Party politics in hard times: Comparative perspectives on the European and Latin American economic crises”, European Journal of Political Research, 56: 218-233. Available at: https://doi.org/10.1111/1475-6765.12191. |
|
|
Rooduijn, Matthijs. 2016. “Closing the gap? A comparison of voters for radical right-wing populist parties and mainstream parties over time”, in T. Akkerman, S. L. de Lange and M. Rooduijn (eds.), Radical Right-Wing Populist Parties in Western Europe. London; New York: Routledge. |
|
|
Rooduijn, Matthijs. 2017. “What unites the voter bases of populist parties? Comparing the electorates of 15 populist parties”, European Political Science Review, 10 (3): 351-368. Available at: https://doi.org/10.1017/S1755773917000145. |
|
|
Stegmueller, Daniel. 2013. “How Many Countries for Multilevel Modeling? A Comparison of Frequentist and Bayesian Approaches”, American Journal of Political Science, 57 (3): 748-761. Available at: https://doi.org/10.1111/ajps.12001. |
|
|
Stockemer, Daniel. 2017. The Front National in France. Continuity and Change Under Jean-Marie Le Pen and Marine Le Pen. Ontario: Springer. |
|
|
Teney, Céline, Onawa Promise Lacewell and Pieter De Wilde. 2014. “Winners and losers of globalization in Europe: attitudes and ideologies”. European Political Science Review, 6: 575-595. Available at: https://doi.org/10.1017/S1755773913000246. |
|
|
Teperoglou, Eftichia, Emmanouil Tsatsanis and Elias Nicolacopoulos. 2015. “Habituating to the New Normal in a Post-earthquake Party System: The 2014 European Election in Greece”, South European Society and Politics, 20 (3): 333-355. Available at: https://doi.org/10.1080/13608746.2015.1068377. |
|
|
Treib, Oliver. 2014. “The Voter Says no, but Nobody Listens: Causes and Consequences of the Eurosceptic Vote in the 2014 European Elections”, Journal of European Public Policy, 21 (10): 1541-1554. Available at: https://doi.org/10.1080/13501763.2014.941534. |
|
|
Van Hauwaert, Steven M. and Stijn van Kessel. 2018. “Beyond protest and discontent: A cross-national analysis of the effect of populist attitudes and issue positions on populist party support”, European Journal of Political Research, 57 (1): 68-92. Available at: https://doi.org/10.1111/1475-6765.12216. |
|
|
Van Kessel, Stijn. 2015. “Dutch populism during the crisis”, in Hanspeter Kriesi and Takis S. Pappas (eds.), Populism in the Shadow of the Great Recession. Colchester: ECPR Press. |
APPENDIX[up]
Table A1
List of parties by family
| Right-wing parties | RWPP | |
|---|---|---|
| Austria | The New Austria (NEOS) | Austrian Freedom Party (FPÖ) |
| Austrian People`s Party (ÖVP) | Alliance for the Future of Austria (BZO) | |
| Belgium | Open Flemish Liberals and Democrats (Open Vld) | Flemish Interest (Vlaams Belang-VB) |
| Reformist Movement (MR) | ||
| Christian Democratic and Flemish (CD&V) | ||
| Humanist Democratic Centre (cdH) | ||
| People`s Party (PP) | ||
| New Flemish Alliance (N-VA) | ||
| Denmark | Radical Party | Danish People´s Party (DF) |
| Venstre-Liberals (V) | ||
| Liberal Alliance (l) | ||
| Conservative People´s Party (C) | ||
| Finland | Christian Democrats in Finland (KD) | True Finns (FS) |
| National Coalition Party (KOK) | ||
| Centre Party of Finland (KESK) | ||
| Swedish People´s Party (RKP) | ||
| France | Union for a Popular Movement (UDF) | National Front (FN) |
| Germany | Free Democratic Party (FDP) | Alternative for Germany (AfD) |
| Christian Democratic Union (CDU) | ||
| Greece | New Democracy (ND) | Independent Greeks (ANEL) |
| Popular Orthodox Rally (LAOS) | ||
| Golden Dawn (GD) | ||
| Italy | Union for Christian and Centre (Udc) | The People of Freedom (PdL) |
| Brothers of Italy (Fdl) | ||
| Luxembourg | Democratic Party (DP) | Alternative Democratic Refor (ADR) |
| Christian Social People’s Party (CSV) | ||
| Netherlands | Democrats `66 (D`66) | Party of Freedom (PVV) |
| People’s Party for Freedom and (VVD) | ||
| Christian Democratic Appeal (CDA) | ||
| Sweden | Liberal People’s Party (L) | Sweden Democrats (SD) |
| Christian Democrats (KD) | ||
| Moderate Coalition Party (M) | ||
| Centre Party (C) | ||
| United Kingdom | Liberal Democrats | British National Party (BNP) |
| Conservative Party | United Kingdom Independence Party (UKIP) | |
| Party of Wales | Democratic Unionist Party (DUP) |
Source: own elaboration based on Mudde ( Mudde, Cas. 2007. Populist Radical Right Parties in Europe. Cambridge: Cambridge University Press.2007: 44) for the cases of FPÖ, VB, DF and FN; Mair (2013) for the case of BZO; Rensmann, de Lange and Couperus (2017: 155,156) for the cases of FS, AfD, ANEL, LAOS, PVV, SD, UKIP; Bobba and Roncarola (2018) for the cases of PdL (also Pappas, 2016:34) and Edl; van Kessel ( Van Kessel, Stijn. 2015. “Dutch populism during the crisis”, in Hanspeter Kriesi and Takis S. Pappas (eds.), Populism in the Shadow of the Great Recession. Colchester: ECPR Press.2015) for the cases of ADR and the BNP and Toloudis (2014) for the case of Greek GD.
Table A2.
Alternative analysis with a different dependent variable. Explaining the vote for Right Wing populist parties versus other parties and abstainers in 12 Western European countries: a multilevel analysis with interactions between sociodemographic and contextual factors[a]
| Additive | Δ GDP | Δ Unemployment | |||||
|---|---|---|---|---|---|---|---|
| Model (0) | Model (1) | Model (2) | Model (3) | Model (4) | Model (5) | Model (6) | |
| Age | -0.05 | 0.04 | -0.04 | -0.03 | 0.33 | -0.03 | -0.04 |
| (0.25) | (0.25) | (0.25) | (0.25) | (0.31) | (0.25) | (0.25) | |
| University | 0.10 | 0.08 | 0.07 | 0.09 | 0.08 | -0.04 | 0.09 |
| (0.10) | (0.10) | (0.10) | (0.10) | (0.10) | (0.13) | (0.10) | |
| Female | -0.47[***] | -0.46[***] | -0.47[***] | -0.47[***] | -0.47[***] | -0.47[***] | -0.47[***] |
| (0.10) | (0.10) | (0.10) | (0.10) | (0.10) | (0.10) | (0.10) | |
| Unemployed | 0.04 | 0.01 | 0.04 | 0.05 | 0.03 | 0.04 | 0.05 |
| (0.19) | (0.19) | (0.19) | (0.19) | (0.19) | (0.19) | (0.19) | |
| City | 0.01 | 0.02 | 0.02 | 0.01 | 0.02 | 0.02 | 0.01 |
| (0.11) | (0.11) | (0.11) | (0.11) | (0.11) | (0.11) | (0.11) | |
| Working class | 0.47[***] | 0.48[***] | 0.47[***] | 0.51[***] | 0.48[***] | 0.48[***] | 0.60[***] |
| (0.10) | (0.10) | (0.10) | (0.11) | (0.10) | (0.10) | (0.13) | |
| Eco. Retrosp. | -0.87[***] | -0.88[***] | -0.86[**] | -0.86[**] | -0.88[***] | -0.86[**] | -0.87[**] |
| (0.26) | (0.26) | (0.26) | (0.26) | (0.26) | (0.26) | (0.26) | |
| Eco. Prosp. | -0.46[+] | -0.45[+] | -0.45[+] | -0.47[+] | -0.46[+] | -0.45[+] | -0.46[+] |
| (0.26) | (0.26) | (0.26) | (0.26) | (0.26) | (0.26) | (0.26) | |
| Pr. Unemmpl. | -0.07 | -0.08 | -0.07 | -0.06 | -0.07 | -0.07 | -0.06 |
| (0.13) | (0.13) | (0.13) | (0.13) | (0.13) | (0.13) | (0.13) | |
| Pr. Economy | -0.09 | -0.09 | -0.09 | -0.08 | -0.09 | -0.09 | -0.08 |
| (0.13) | (0.14) | (0.13) | (0.13) | (0.14) | (0.13) | (0.13) | |
| Pr. Immigration | 0.71[***] | 0.70[***] | 0.71[***] | 0.71[***] | 0.71[***] | 0.71[***] | 0.71[***] |
| (0.16) | (0.16) | (0.16) | (0.17) | (0.16) | (0.17) | (0.17) | |
| Pr. Politics | -1.07 | -1.10 | -1.07 | -1.07 | -1.08 | -1.07 | -1.06 |
| (0.74) | (0.74) | (0.74) | (0.74) | (0.74) | (0.74) | (0.74) | |
| Political interest | 0.12 | 0.12 | 0.12 | 0.12 | 0.12 | 0.12 | 0.13 |
| (0.16) | (0.16) | (0.16) | (0.16) | (0.16) | (0.16) | (0.16) | |
| Ideology | 3.25[***] | 3.26[***] | 3.25[***] | 3.25[***] | 3.26[***] | 3.25[***] | 3.25[***] |
| (0.21) | (0.21) | (0.21) | (0.21) | (0.21) | (0.21) | (0.21) | |
| Confidence Parl. | -0.99[***] | -0.99[***] | -0.99[***] | -0.98[***] | -0.99[***] | -1.00[***] | -0.98[***] |
| (0.11) | (0.11) | (0.11) | (0.11) | (0.11) | (0.11) | (0.11) | |
| Party Id. | 0.38[***] | 0.38[***] | 0.38[***] | 0.38[***] | 0.38[***] | 0.38[***] | 0.38[***] |
| (0.10) | (0.10) | (0.10) | (0.10) | (0.10) | (0.10) | (0.10) | |
| Δ GDP | -0.58[+] | -0.80[*] | -0.56[+] | -0.62[*] | -0.58[+] | -0.58[+] | -0.58[+] |
| (0.30) | (0.31) | (0.30) | (0.30) | (0.30) | (0.30) | (0.30) | |
| Δ UNEMPL | -0.12[+] | -0.13[+] | -0.13[+] | -0.12[+] | -0.09 | -0.14[*] | -0.11 |
| (0.07) | (0.07) | (0.07) | (0.07) | (0.07) | (0.07) | (0.07) | |
| Δ IMMIG | -0.03 | -0.02 | -0.03 | -0.04 | -0.03 | -0.03 | -0.03 |
| (0.30) | (0.30) | (0.30) | (0.30) | (0.31) | (0.30) | (0.30) | |
| Pr. SYSTEM | 0.11 | 0.11 | 0.09 | 0.16 | 0.11 | 0.11 | 0.13 |
| (0.66) | (0.66) | (0.66) | (0.67) | (0.67) | (0.66) | (0.67) | |
| Age[*]Macro | 0.47[**] | -0.10[*] | |||||
| (0.18) | (0.04) | ||||||
| Univ[*] Macro | -0.08 | 0.03[+] | |||||
| (0.07) | (0.02) | ||||||
| W.Class[*] Macro | 0.12[+] | -0.03[+] | |||||
| (0.07) | (0.02) | ||||||
| Constant | -3.53[***] | -3.56[***] | -3.50[***] | -3.61[***] | -3.69[***] | -3.48[***] | -3.61[***] |
| (0.71) | (0.71) | (0.70) | (0.71) | (0.72) | (0.70) | (0.71) | |
| Constant | -0.34 | -0.34 | -0.35 | -0.34 | -0.33 | -0.35 | -0.34 |
| (0.24) | (0.24) | (0.24) | (0.24) | (0.24) | (0.24) | (0.24) | |
| Observations | 8939 | 8939 | 8939 | 8939 | 8939 | 8939 | 8939 |
| N groups | 12 | 12 | 12 | 12 | 12 | 12 | 12 |
| Log lik. | -1716.52 | -1712.78 | -1715.83 | -1715.08 | -1714.11 | -1714.88 | -1715.10 |
| Bic | 3633.19 | 3634.82 | 3640.93 | 3639.42 | 3637.48 | 3639.02 | 3639.46 |
| Aic | 3477.03 | 3471.56 | 3477.67 | 3476.16 | 3474.22 | 3475.77 | 3476.20 |
Table A3
Explaining the vote for Right Wing populist parties versus right parties in 12 Western European countries: a logistic regression analyses with interactions between sociodemographic and contextual factors[a]
| Additive | Δ GDP | Δ Unemployment | |||||
|---|---|---|---|---|---|---|---|
| Model (0) | Model (1) | Model (2) | Model (3) | Model (4) | Model (5) | Model (6) | |
| Age | -0.88[**] | -0.83[**] | -0.87[**] | -0.87[**] | -0.68[**] | -0.86[**] | -0.88[**] |
| (0.27) | (0.28) | (0.27) | (0.27) | (0.32) | (0.27) | (0.27) | |
| University | 0.09 | 0.08 | 0.05 | 0.08 | 0.08 | 0.08 | 0.08 |
| (0.11) | (0.11) | (0.11) | (0.11) | (0.11) | (0.13) | (0.11) | |
| Female | -0.54[***] | -0.54[***] | -0.55[***] | -0.54[***] | -0.54[***] | -0.54[***] | -0.54[***] |
| (0.11) | (0.11) | (0.11) | (0.11) | (0.11) | (0.11) | (0.11) | |
| Unemployed | 0.37 | 0.34 | 0.35 | 0.36 | 0.36 | 0.34 | 0.35 |
| (0.23) | (0.23) | (0.23) | (0.23) | (0.23) | (0.23) | (0.23) | |
| City | 0.20[+] | 0.21[+] | 0.21[+] | 0.18 | 0.20[+] | 0.20[+] | 0.18 |
| (0.12) | (0.12) | (0.12) | (0.12) | (0.12) | (0.12) | (0.12) | |
| Working class | 0.74[***] | 0.75[***] | 0.76[***] | 0.76[***] | 0.74[***] | 0.76[***] | 0.89[***] |
| (0.11) | (0.11) | (0.12) | (0.12) | (0.11) | (0.12) | (0.13) | |
| Eco. Retrospective | -1.54[***] | -1.57[***] | -1.53[***] | -1.54[***] | -1.54[***] | -1.52[***] | -1.53[***] |
| (0.27) | (0.27) | (0.27) | (0.27) | (0.27) | (0.27) | (0.27) | |
| Eco. Prospective | -0.44 | -0.44 | -0.41 | -0.46 | -0.43 | -0.42 | -0.46[+] |
| (0.28) | (0.28) | (0.28) | (0.28) | (0.28) | (0.28) | (0.28) | |
| Pr. Unemployment | -0.08 | -0.08 | -0.08 | -0.07 | -0.08 | -0.08 | -0.08 |
| (0.14) | (0.14) | (0.14) | (0.14) | (0.14) | (0.14) | (0.14) | |
| Pr. Economy | -0.22 | -0.23 | -0.23 | -0.22 | -0.23 | -0.23 | -0.22 |
| (0.15) | (0.15) | (0.15) | (0.15) | (0.15) | (0.15) | (0.15) | |
| Pr. Immigration | 0.43[*] | 0.42[*] | 0.44[*] | 0.42[*] | 0.43[*] | 0.43[*] | 0.42[*] |
| (0.17) | (0.17) | (0.17) | (0.17) | (0.17) | (0.17) | (0.17) | |
| Pr. Politics | -0.85 | -0.90 | -0.88 | -0.83 | -0.86 | -0.85 | -0.82 |
| (0.78) | (0.78) | (0.78) | (0.78) | (0.78) | (0.78) | (0.77) | |
| Political Interest | -0.22 | -0.21 | -0.22 | -0.24 | -0.22 | -0.23 | -0.23 |
| (0.18) | (0.18) | (0.18) | (0.18) | (0.18) | (0.18) | (0.18) | |
| Ideology | 0.67[*] | 0.67[*] | 0.63[*] | 0.70[*] | 0.68[*] | 0.63[*] | 0.70[*] |
| (0.27) | (0.27) | (0.27) | (0.27) | (0.27) | (0.27) | (0.27) | |
| Confidence Parl. | -1.36[***] | -1.35[***] | -1.37[***] | -1.35[***] | -1.36[***] | -1.37[***] | -1.34[***] |
| (0.11) | (0.11) | (0.11) | (0.11) | (0.11) | (0.11) | (0.11) | |
| Party Id. | 0.30[**] | 0.30[**] | 0.31[**] | 0.30[**] | 0.30[**] | 0.31[**] | 0.30[**] |
| (0.11) | (0.11) | (0.11) | (0.11) | (0.11) | (0.11) | (0.11) | |
| Δ GDP | -0.28[**] | -0.51[***] | -0.24[**] | -0.32[***] | -0.28[**] | -0.29[***] | -0.28[**] |
| (0.09) | (0.12) | (0.09) | (0.09) | (0.09) | (0.09) | (0.09) | |
| Δ UNEMPL | -0.10[***] | -0.10[***] | -0.11[***] | -0.10[***] | -0.08[***] | -0.12[***] | -0.08 |
| (0.02) | (0.02) | (0.02) | (0.02) | (0.03) | (0.02) | (0.02) | |
| Δ IMMIG | -0.21[**] | -0.20[**] | -0.20[**] | -0.22[**] | -0.21[**] | -0.21[**] | -0.22[**] |
| (0.07) | (0.07) | (0.07) | (0.07) | (0.07) | (0.07) | (0.07) | |
| Pr. SYSTEM | 0.48[*] | 0.50[*] | 0.39[*] | 0.54[**] | 0.48[*] | 0.46[*] | 0.50[*] |
| (0.20) | (0.20) | (0.20) | (0.20) | (0.20) | (0.20) | (0.20) | |
| Age[*]Macro | 0.52[**] | -0.06 | |||||
| (0.19) | (0.05) | ||||||
| Univ[*] Macro | -0.20[**] | 0.05[*] | |||||
| (0.08) | (0.02) | ||||||
| W. Class[*] Macro | 0.15[+] | -0.04[*] | |||||
| (0.07) | (0.02) | ||||||
| Constant | 0.09 | 0.05 | 0.19 | 0.02 | -0.01 | 0.19 | 0.01 |
| (0.34) | (0.34) | (0.35) | (0.35) | (0.35) | (0.34) | (0.35) | |
| Observations | 3536 | 3536 | 3536 | 3536 | 3536 | 3536 | 3536 |
| Pseudo R2 | 0.183 | 0.186 | 0.186 | 0.185 | 0.184 | 0.186 | 0.185 |
Table 4.
Alternative analysis with a different dependent variable. Explaining the vote for Right Wing populist parties versus other parties and abstainers in 12 Western European countries: a logistic regression analysis with interactions between sociodemographic and contextual factors[a]
| Additive | Δ GDP | Δ Unemployment | |||||
|---|---|---|---|---|---|---|---|
| Model (0) | Model (1) | Model (2) | Model (3) | Model (4) | Model (5) | Model (6) | |
| Age | -0.18 | -0.10 | -0.16 | -0.16 | 0.01 | -0.16 | -0.16 |
| (0.25) | (0.25) | (0.25) | (0.25) | (0.30) | (0.25) | (0.25) | |
| University | 0.01 | 0.00 | -0.03 | 0.01 | 0.01 | -0.16 | 0.01 |
| (0.10) | (0.10) | (0.10) | (0.10) | (0.10) | (0.12) | (0.10) | |
| Female | -0.44[***] | -0.44[***] | -0.44[***] | -0.44[***] | -0.44[***] | -0.44[***] | -0.44[***] |
| (0.09) | (0.10) | (0.09) | (0.09) | (0.09) | (0.10) | (0.09) | |
| Unemployed | -0.01 | -0.04 | -0.02 | -0.01 | -0.03 | -0.02 | -0.01 |
| (0.18) | (0.18) | (0.18) | (0.18) | (0.18) | (0.18) | (0.18) | |
| City | 0.05 | 0.06 | 0.06 | 0.05 | 0.06 | 0.06 | 0.05 |
| (0.11) | (0.11) | (0.11) | (0.11) | (0.11) | (0.11) | (0.11) | |
| Working class | 0.37[***] | 0.39[***] | 0.39[***] | 0.40[**] | 0.38[***] | 0.39[***] | 0.47[***] |
| (0.10) | (0.10) | (0.10) | (0.10) | (0.10) | (0.10) | (0.12) | |
| Eco. Retrosp. | -1.07[***] | -1.08[***] | -1.05[***] | -1.06[***] | -1.08[***] | -1.05[***] | -1.06[***] |
| (0.24) | (0.24) | (0.24) | (0.24) | (0.24) | (0.24) | (0.24) | |
| Eco. Prosp. | -0.14 | -0.14 | -0.14 | -0.16 | -0.14 | -0.14 | -0.16 |
| (0.24) | (0.24) | (0.24) | (0.24) | (0.24) | (0.24) | (0.24) | |
| Pr. Unemmpl. | -0.07 | -0.07 | -0.07 | -0.06 | -0.07 | -0.07 | -0.07 |
| (0.12) | (0.12) | (0.12) | (0.12) | (0.12) | (0.12) | (0.12) | |
| Pr. Economy | -0.08 | -0.08 | -0.08 | -0.07 | -0.08 | -0.08 | -0.07 |
| (0.13) | (0.13) | (0.13) | (0.13) | (0.13) | (0.13) | (0.13) | |
| Pr. Immigration | 0.59[***] | 0.58[***] | 0.59[***] | 0.58[***] | 0.59[***] | 0.59[***] | 0.58[***] |
| (0.16) | (0.16) | (0.16) | (0.16) | (0.16) | (0.16) | (0.16) | |
| Pr. Politics | -0.98 | -1.00 | -0.98 | -0.98 | -0.98 | -0.98 | -0.98 |
| (0.74) | (0.74) | (0.74) | (0.74) | (0.74) | (0.74) | (0.74) | |
| Political interest | 0.16 | 0.15 | 0.16 | 0.16 | 0.15 | 0.16 | 0.16 |
| (0.16) | (0.16) | (0.16) | (0.16) | (0.16) | (0.16) | (0.16) | |
| Ideology | 3.38[***] | 3.39[***] | 3.38[***] | 3.39[***] | 3.40[***] | 3.38[***] | 3.39[***] |
| (0.21) | (0.21) | (0.21) | (0.21) | (0.21) | (0.21) | (0.21) | |
| Confidence Parl. | -1.01[***] | -1.01[***] | -1.02[***] | -1.00[***] | -1.01[***] | -1.03[***] | -1.00[***] |
| (0.11) | (0.11) | (0.11) | (0.11) | (0.11) | (0.11) | (0.11) | |
| Party Id. | 0.44[***] | 0.44[***] | 0.44[***] | 0.44[***] | 0.44[***] | 0.44[***] | 0.44[***] |
| (0.10) | (0.10) | (0.10) | (0.10) | (0.10) | (0.10) | (0.10) | |
| Δ GDP | -0.26[***] | -0.46[**] | -0.23[**] | -0.29[***] | -0.26[***] | -0.27[***] | -0.26[***] |
| (0.07) | (0.11) | (0.08) | (0.08) | (0.07) | (0.07) | (0.07) | |
| Δ UNEMPL | -0.07[***] | -0.08[***] | -0.08[***] | -0.07[***] | -0.05[**] | -0.09[***] | -0.06[***] |
| (0.01) | (0.01) | (0.01) | (0.01) | (0.02) | (0.02) | (0.02) | |
| Δ IMMIG | 0.00 | 0.01 | 0.01 | -0.00 | 0.01 | 0.00 | 0.00 |
| (0.06) | (0.06) | (0.06) | (0.06) | (0.06) | (0.06) | (0.06) | |
| Pr. SYSTEM | 0.57[***] | 0.57[***] | 0.52[**] | 0.61[***] | 0.57[***] | 0.56[**] | 0.58[***] |
| (0.17) | (0.17) | (0.17) | (0.17) | (0.17) | (0.17) | (0.17) | |
| Age[*]Macro | 0.42[**] | -0.07[+] | |||||
| (0.16) | (0.04) | ||||||
| Univ[*] Macro | -0.13[+] | 0.04[**] | |||||
| (0.07) | (0.02) | ||||||
| W.Class[*] Macro | 0.10 | -0.02 | |||||
| (0.06) | (0.02) | ||||||
| Constant | -4.03[***] | -4.06[***] | -3.99[***] | -4.08[***] | -4.15[***] | -3.96[***] | -4.09[***] |
| (0.29) | (0.29) | (0.29) | (0.29) | (0.30) | (0.29) | (0.29) | |
| Observations | 8939 | 8939 | 8939 | 8939 | 8939 | 8939 | 8939 |
| Pseudo R2 | 0.150 | 0.152 | 0.151 | 0.151 | 0.151 | 0.152 | 0.151 |
Table A5.
Correlation between independent variables
| Age | University | Female | Unemployed | City | Working Class | Eco. Retrospective | Eco. Prospective | Prob. Unemployment | Prob. Economy | Prob. Immigration | Prob. Politics | Political Interest | Ideology | Confi. Parliament | Party ID | Δ GDP | Δ Unemployment | Δ Immigration | Pr. System | |
|---|---|---|---|---|---|---|---|---|---|---|---|---|---|---|---|---|---|---|---|---|
| Agae | 1.0000 | |||||||||||||||||||
| University | -0.0854[*] | 1.0000 | ||||||||||||||||||
| Female | 0.0175[*] | -0.0118[*] | 1.0000 | |||||||||||||||||
| Unemployed | -0.1168[*] | 0.0172[*] | 0.0001 | 1.0000 | ||||||||||||||||
| City | -0.0625[*] | 0.0132[*] | -0.0019 | -0.0121[*] | 1.0000 | |||||||||||||||
| Working Class | 0.0693[*] | -0.0651[*] | -0.0040 | 0.1207[*] | -0.0764[*] | 1.0000 | ||||||||||||||
| Economic Retrospective | -0.0108[*] | 0.0229[*] | -0.0594[*] | -0.0706[*] | 0.0354[*] | -0.1255[*] | 1.0000 | |||||||||||||
| Economic Prospective | 0.0008 | 0.0217[*] | -0.0497[*] | -0.0670[*] | 0.0180[*] | -0.1212[*] | 0.5858[*] | 1.0000 | ||||||||||||
| Prob. Unemployment | -0.0161[*] | 0.0065 | 0.0345[*] | 0.0978[*] | -0.0666[*] | 0.0458[*] | -0.0733[*] | -0.0319[*] | 1.0000 | |||||||||||
| Prob. Economy | -0.0139[*] | 0.0359[*] | -0.0120[*] | -0.0027 | 0.0055 | -0.0171[*] | -0.0214[*] | -0.0200[*] | -0.2137[*] | 1.0000 | ||||||||||
| Prob. Immigration | 0.0285[*] | 0.0230[*] | 0.0053 | -0.0210[*] | -0.0095[*] | -0.0069 | 0.0618[*] | 0.0452[*] | -0.1133[*] | -0.0675[*] | 1.0000 | |||||||||
| Prob. Politics | -0.0222[*] | 0.0158[*] | -0.0065 | 0.0069 | 0.0439[*] | -0.0141[*] | 0.0214[*] | -0.0131[*] | -0.0881[*] | -0.0501[*] | -0.0156[*] | 1.0000 | ||||||||
| Political Interest | 0.1360[*] | 0.0101[*] | -0.1474[*] | -0.0813[*] | 0.0493[*] | -0.1781[*] | 0.1430[*] | 0.1363[*] | -0.0651[*] | 0.0127[*] | -0.0009 | 0.0363[*] | 1.0000 | |||||||
| Ideology | 0.0128[*] | -0.0041 | -0.0135[*] | -0.0207[*] | -0.0094[*] | -0.0870[*] | 0.0566[*] | 0.0668[*] | -0.0362[*] | -0.0064 | 0.0287[*] | -0.0032 | -0.0050 | 1.0000 | ||||||
| Confidence Parliament | 0.0566[*] | -0.0334[*] | -0.0264[*] | -0.0878[*] | -0.0022 | -0.1677[*] | 0.2390[*] | 0.2558[*] | -0.0452[*] | -0.0478[*] | 0.0220[*] | 0.0357[*] | 0.2161[*] | 0.0444[*] | 1.0000 | |||||
| Party ID | 0.1188[*] | -0.0339[*] | -0.0490[*] | -0.0287[*] | 0.0054 | -0.0645[*] | 0.0616[*] | 0.0668[*] | -0.0171[*] | -0.0015 | 0.0359[*] | 0.0165[*] | 0.2731[*] | 0.0052 | 0.1206[*] | 1.0000 | ||||
| Δ GDP | -0.0560[*] | -0.0656[*] | -0.0048 | 0.0109[*] | 0.0673[*] | 0.0528[*] | 0.1539[*] | 0.0717[*] | -0.1560[*] | -0.2214[*] | 0.0335[*] | 0.0264[*] | 0.0367[*] | 0.0594[*] | 0.1121[*] | 0.0249[*] | 1.0000 | |||
| Δ Unemployment | -0.0005 | 0.0221[*] | 0.0125[*] | 0.0695[*] | 0.0434[*] | 0.0736[*] | -0.1136[*] | -0.0637[*] | 0.1459[*] | 0.1950[*] | -0.0500[*] | -0.0235[*] | -0.0576[*] | -0.0458[*] | -0.2303[*] | 0.0038 | -0.5263[*] | 1.0000 | ||
| Δ Immigration | -0.0069 | -0.0921[*] | 0.0003 | -0.0678[*] | -0.0170[*] | -0.0545[*] | 0.0360[*] | 0.0216[*] | -0.0971[*] | -0.0850[*] | 0.0851[*] | -0.0384[*] | -0.0381[*] | -0.0145[*] | 0.1613[*] | -0.0123[*] | 0.4299[*] | -0.4755[*] | 1.000 | |
| Pr. System | -0.0016 | -0.0085 | -0.0187[*] | -0.0961[*] | 0.0380[*] | -0.0604[*] | 0.0536[*] | 0.0525[*] | -0.0658[*] | -0.0136[*] | -0.1004[*] | -0.0327[*] | 0.0400[*] | 0.0216[*] | 0.0716[*] | 0.0441[*] | -0.2096[*] | 0.1898[*] | 0.0152[*] | 1.0000 |
Table A6.
Explaining the vote for Right Wing populist parties versus right parties in 10 Western European countries: a multilevel analysis with interactions between sociodemographic and contextual factors without extreme cases[a]
| Additive | Δ GDP | Δ Unemployment | |||||
|---|---|---|---|---|---|---|---|
| Model (0) | Model (1) | Model (2) | Model (3) | Model (4) | Model (5) | Model (6) | |
| Age | -0.38 | -0.78[*] | -0.39 | -0.40 | 0.31 | -0.37 | -0.37 |
| (0.31) | (0.34) | (0.31) | (0.31) | (0.48) | (0.31) | (0.31) | |
| University | 0.14 | 0.16 | 0.15 | 0.14 | 0.16 | 0.22 | 0.14 |
| (0.13) | (0.13) | (0.14) | (0.13) | (0.13) | (0.19) | (0.13) | |
| Female | -0.54[***] | -0.54[***] | -0.54[***] | -0.54[***] | -0.53[***] | -0.54[***] | -0.53[***] |
| (0.12) | (0.12) | (0.12) | (0.12) | (0.12) | (0.12) | (0.12) | |
| Unemployed | 0.46[+] | 0.46[+] | 0.46[+] | 0.46[+] | 0.48[+] | 0.46[+] | 0.49[+] |
| (0.26) | (0.26) | (0.26) | (0.26) | (0.26) | (0.26) | (0.26) | |
| City | 0.21 | 0.21 | 0.21 | 0.21 | 0.21 | 0.21 | 0.23 |
| (0.14) | (0.14) | (0.14) | (0.14) | (0.14) | (0.14) | (0.14) | |
| Working class | 1.18[***] | 1.18[***] | 1.18[***] | 1.29[***] | 1.17[***] | 1.18[***] | 0.89[***] |
| (0.14) | (0.14) | (0.14) | (0.15) | (0.14) | (0.14) | (0.20) | |
| Eco. Retrospective | -0.84[**] | -0.89[**] | -0.84[**] | -0.84[**] | -0.85[**] | -0.84[**] | -0.85[**] |
| (0.32) | (0.32) | (0.32) | (0.32) | (0.32) | (0.32) | (0.32) | |
| Eco. Prospective | -0.67[*] | -0.69[*] | -0.67[*] | -0.69[*] | -0.67[*] | -0.67[*] | -0.66[*] |
| (0.33) | (0.34) | (0.33) | (0.33) | (0.33) | (0.33) | (0.33) | |
| Pr. Unemployment | -0.25 | -0.23 | -0.25 | -0.25 | -0.23 | -0.25 | -0.25 |
| (0.17) | (0.17) | (0.17) | (0.17) | (0.17) | (0.17) | (0.17) | |
| Pr. Economy | -0.31[+] | -0.32[+] | -0.31[+] | -0.31[+] | -0.31[+] | -0.31[+] | -0.30[+] |
| (0.17) | (0.17) | (0.17) | (0.17) | (0.17) | (0.17) | (0.17) | |
| Pr. Immigration | 0.55[**] | 0.54[**] | 0.55[**] | 0.55[**] | 0.56[**] | 0.55[**] | 0.56[**] |
| (0.19) | (0.19) | (0.19) | (0.19) | (0.19) | (0.19) | (0.19) | |
| Pr. Politics | -0.88 | -0.92 | -0.88 | -0.91 | -0.85 | -0.88 | -0.95 |
| (0.78) | (0.78) | (0.78) | (0.78) | (0.78) | (0.78) | (0.78) | |
| Political Interest | -0.15 | -0.13 | -0.15 | -0.15 | -0.14 | -0.15 | -0.16 |
| (0.20) | (0.21) | (0.20) | (0.20) | (0.20) | (0.20) | (0.21) | |
| Ideology | 0.15 | 0.13 | 0.15 | 0.18 | 0.15 | 0.15 | 0.16 |
| (0.31) | (0.31) | (0.31) | (0.31) | (0.31) | (0.31) | (0.31) | |
| Confidence Parl. | -1.25[***] | -1.24[***] | -1.25[***] | -1.25[***] | -1.25[***] | -1.25[***] | -1.24[***] |
| (0.13) | (0.13) | (0.13) | (0.13) | (0.13) | (0.13) | (0.13) | |
| Party Id. | 0.20[+] | 0.21[+] | 0.20[+] | 0.21[+] | 0.21[+] | 0.21[+] | 0.20[+] |
| (0.12) | (0.12) | (0.12) | (0.12) | (0.12) | (0.12) | (0.12) | |
| Δ GDP | -0.36 | -0.86[+] | -0.35 | -0.27 | -0.35 | -0.36 | -0.38 |
| (0.44) | (0.47) | (0.44) | (0.45) | (0.44) | (0.44) | (0.44) | |
| Δ UNEMPL | 0.32[*] | 0.32[*] | 0.32[*] | 0.33[*] | 0.50[*] | 0.34[*] | 0.27[+] |
| (0.16) | (0.16) | (0.16) | (0.16) | (0.18) | (0.16) | (0.16) | |
| Δ IMMIG | -0.70[+] | -0.70[+] | -0.70[+] | -0.72[+] | -0.67[+] | -0.70[+] | -0.73[*] |
| (0.37) | (0.36) | (0.37) | (0.37) | (0.37) | (0.37) | (0.37) | |
| Pr. SYSTEM | 0.44 | 0.48 | 0.43 | 0.37 | 0.45 | 0.44 | 0.40 |
| (0.83) | (0.83) | (0.83) | (0.85) | (0.83) | (0.84) | (0.84) | |
| Age[*]Macro | 1.11[**] | -0.38[+] | |||||
| (0.40) | (0.20) | ||||||
| Univ[*]Macro | -0.05 | -0.05 | |||||
| (0.16) | (0.08) | ||||||
| W. Class[*] Macro | -0.31[+] | 0.17[*] | |||||
| (0.17) | (0.08) | ||||||
| Constant | -0.31 | -0.16 | -0.30 | -0.24 | -0.70 | -0.35 | -0.13 |
| (0.95) | (0.95) | (0.95) | (0.97) | (0.98) | (0.96) | (0.96) | |
| Constant | -0.21 | -0.22 | -0.21 | -0.19 | -0.21 | -0.21 | -0.20 |
| (0.24) | (0.24) | (0.24) | (0.24) | (0.24) | (0.24) | (0.24) | |
| Observations | 3157 | 3157 | 3157 | 3157 | 3157 | 3157 | 3157 |
| N | 10 | 10 | 10 | 10 | 10 | 10 | 10 |
| Log lik. | -1015.84 | -1011.86 | -1015.79 | -1014.20 | -1013.95 | -1015.66 | -1013.67 |
| Bic | 2208.94 | 2209.04 | 2216.90 | 2213.71 | 2213.23 | 2216.64 | 2212.67 |
| Aic | 2075.68 | 2069.72 | 2077.58 | 2074.39 | 2073.91 | 2077.32 | 2073.35 |
Biography[up]
| [a] |
Investigador doctoral en el Departamento de Ciencia Política de la Universidad Autónoma
de Madrid, donde trabaja en su tesis doctoral con un contrato de formación del profesorado
universitario. Recientemente ha sido investigador visitante en el Nottingham Interdisciplinary Centre
for Economic and Political Research de la Universidad de Nottingham. Es máster en
Democracia y Gobierno por la UAM y graduado en Ciencia Política y Administración Pública
por la Universidad de Santiago de Compostela, donde obtuvo el Premio Extraordinario
Fin de Grado y el Premio de Fin de Carrera de la Comunidad Autónoma de Galicia en
el año 2015. Sus principales líneas de investigación están relacionadas con los partidos
y sistemas de partidos de los países de Europa Occidental. |
| [b] |
Profesor ayudante doctor en el Departamento de Ciencia Política y Relaciones Internacionales
de la Universidad Autónoma de Madrid. Anteriormente fue profesor e investigador postdoctoral
en la Universitat Pompeu Fabra (Barcelona), así como investigador predoctoral en el
antiguo Centro de Estudios Avanzados en Ciencias Sociales de la Fundación Juan March
(Madrid). Es máster en Democracia y Gobierno y doctor en Ciencia Política. Ha realizado
estancias de investigación en la Universidad de Michigan, la Universidad de Essex,
la Universidad de Montreal y la Universidad de Berkeley. Sus últimos artículos han
sido publicados en American Behavioral Scientist, Parliamentary Affairs, South European Society and Politics
y West European Politics, entre otras. Sus dos obras editadas más recientes son Democratizing Candidate Selection in Times of Crisis: New Methods, Old Receipts? (2018) y The Selection of Politicians in Times of Crisis (2018). |