The POLAT Panel: Spanish Political Attitudes Survey
El panel POLAT: Encuesta sobre actitudes políticas en España
ABSTRACT
The Spanish Political Attitudes Panel Dataset (POLAT) is an ongoing panel study carried out in Spain. The present research note introduces the dataset, and presents some results of the first six waves, fielded in political context defined by a prolonged economic recession, major corruption scandals and widespread mass protests (2010-2014). The longitudinal aspect of the dataset allows researchers to trace changes and exploit within-individual variation in a wide array of political, social and economic attitudes and behaviors. The note offers validity checks for some of the key empirical indicators against the benchmark of concurrent surveys, including the European Social Survey. Finally, the note illustrates the potential of POLAT for the analysis of change in political attitudes and behaviors.
Keywords: Panel data, Spain, political participation, Great Recession, Indignados, 8M, political attitudes.
RESUMEN
La encuesta POLAT es un estudio panel actualmente en curso sobre actitudes políticas en España. La presente nota de investigación presenta los datos correspondientes a las primeras seis olas y los contextualiza. Una muestra inicial de 2.100 personas fue seguida a lo largo de cinco años (2010-2014 en un contexto político definido por una prolongada recesión económica, grandes escándalos de corrupción y protestas masivas generalizadas (2010-2014). La estructura longitudinal del conjunto de datos permite a los investigadores rastrear cambios individuales a lo largo del tiempo en una amplia gama de actitudes y comportamientos. Esta nota ofrece verificaciones de validez para algunos de los indicadores empíricos clave en comparación con encuestas concurrentes, incluyendo la Encuesta Social Europea. La nota ilustra también el potencial de la base de datos POLAT para el análisis del cambio en actitudes y comportamientos políticos.
Palabras clave: Datos de panel, España, participación política, Gran Recesión, Indignados, 8M, actitudes políticas.
INTRODUCTION[Up]
In this note we present the first public release of the Spanish Political Attitudes Panel Dataset (Hernández et al., 2020). The panel, henceforth POLAT or POLAT Panel, started in 2010 at a time of intense economic turmoil when online surveys were still scarce. Traditionally panel surveys have focused on socio-economic and demographic variables (such as the American Panel Study of Income Dynamics (PSID), the British Household Panel Survey (BHPS), the German Socio-Economic Panel (SOEP) and the Swiss Household Panel (SHP)) with limited content on political variables (with the exception of the British NatCen), seldom venturing beyond items that gauge party affiliation, placement on the left-right political spectrum, interest in politics or political efficacy. Even when such questions on public opinion and political preferences are included, they tend to appear in scattered rounds and thus lack consistency over time. POLAT contributes to filling this gap on the availability of detailed longitudinal measures of citizens political attitudes and behaviors, along the lines of other panel surveys such as the Dutch Longitudinal Internet studies for the Social Sciences (LISS) (Scherpenzeel, 2011), the Norwegian Citizen Panel (NCP), the Spanish E-Dem panel survey (Torcal et al., 2020), or the Israel Polarization panel survey (Gidron et al., 2022).
We begin the research note with a brief sketch of the economic, political and social context in which the first six waves of the panel data were collected (2010-2014). We then offer an overview of the content of the POLAT Panel: With more than 370 questions, POLAT captures political attitudes, behaviors and public opinion on the main issues of the day. We then present technical issues related to the survey design. We pay special attention to the sampling strategy in an online panel and to attrition rates across waves. We cross-validate a pair of key indicators in POLAT with equivalent measures in a concurrent module of the European Social Survey and multiple waves of the cross-sectional CIS Barometer in Spain. Finally, we illustrate the use of POLAT and its potential to address novel theoretical questions by disentangling intra-individual change between waves from inter-individual variation within a given wave to demonstrate how economic voting might be conditioned by the political party in power.
THE CONTEXT: ECONOMIC RECESSION, AUSTERITY AND POLITICAL MOBILIZATION[Up]
The first six waves of the POLAT Panel Survey span a particularly tumultuous period in Spanish contemporary history, one marked by a prolonged economic recession, austerity measures, major political corruption scandals and widespread civil unrest, together leading to the country’s transition to a multi-party system. However, this was far from evident at the time. Before the financial crisis of 2007-2008, Spain represented one of Europe’s most dramatic economic success stories. In 2007, the country entered its fifteenth consecutive year of growth—the most prolonged period of continuous economic expansion in its modern history (Royo, 2009). In 2007, the economy had grown a remarkable 3.7%, the government budget was balanced, and public debt was at a two-decade low. That same year, unemployment had dropped to 8% (a three-decade low), as Spain was producing more new jobs each year, on average, than any other EU country after Germany (Royo, 2009).
On April 12th, 2008, José Luis Rodríguez Zapatero of the Socialist Party (PSOE) was re-elected for a second term. Following the elections, however, the economy rapidly deteriorated. Housing prices collapsed, the construction industry was stopped dead in its tracks and thousands of people lost their jobs overnight (Galais & Lorenzini, 2017). To stimulate the economy, Zapatero implemented the Plan for the Stimulus of the Economy and Employment (i.e., Plan E)—to little avail (Martín & Urquizu-Sancho, 2012). Soon after, the Value-Added Tax (VAT) was increased, the replacement rate of retired public employees was cut by 90%, pensions were frozen, public-sector salaries were cut by 5%, the cheque-bébé (i.e., financial aid to parents of newborns) was eliminated and significant cuts were made to regional and local government budgets (Martín & Urquizu-Sancho, 2012). Zapatero had effectively rolled back on most of the accomplishments of his first term—which had been characterized by such sweeping social reforms that some hailed it Spain’s ‘second transition’ to democracy (Field, 2009).
While the Global Financial Crisis—and later the European sovereign debt crisis—led to widespread protests across many countries, the outcries of injustice made by the Spanish citizenry would echo across the globe. A week before the municipal and regional elections (May 22, 2011), 130 000 people across 50 Spanish cities poured out onto the streets under the motto ‘Democracia Real Ya!’ (Real Democracy Now!). This protest was not organized by traditional political organizations such as political parties or trade unions but through online platforms that united 400 disparate organizations (Anduiza et al., 2014). Furthermore, the protest that day never quite ended. Instead, many protesters camped out in city squares and attended daily assemblies for over a month to come. This protest, which would later become known as the 15M Movement (for its starting date on May 15th), transformed into the Indignados movement—thereby sowing the seeds of the global Occupy movement (Anduiza et al., 2014).
At the time, between two-thirds and three-quarters of the Spanish population reported that they sympathized with or supported the 15M protest (Anduiza et al., 2014). A fair portion of this support was borne out of economic grievances and several high-profile political corruption cases (which had emerged in the years leading up to the 15M protest) that had seriously undermined public trust in Spanish politicians (Ares & Hernández, 2017). The rise of Indignados thus signaled general public distrust of politicians and political parties, not only for their perceived ineptitude in dealing with the economic crisis but also for not holding Spaniards’ best interests at heart due to mutually beneficial affiliations with banks and high-profile businesses.
On November 20th, 2011, the PSOE suffered its worst defeat since Spain’s transition to democracy. Indeed, the PSOE was able to retain only fifty percent of its voters—having lost over 4 million. While most of these votes went to the Popular Party (PP), the main opposition party, a considerable amount was lost to abstention or redirected to smaller parties (Medina & Muñoz, 2014).
With an absolute majority, the PP focused on tackling the economic crisis. The Spanish government’s strategy focused more on spending cuts than tax increases, which is more detrimental to the less affluent as they depend more on public spending (Martínez, 2014). More specifically, the PP government increased the income tax and the Value-Added Tax (VAT); reduced the fiscal budget dedicated to pensions, education and health; increased prescription drug co-payments and university fees; and cut civil-servant salaries and unemployment benefits. Many of these policies contradicted the party’s campaign pledges (Medina, 2016). These measures coincided with the bailout of major banks, which led to a general sense that the PP was more concerned about protecting the wealthy than helping the most vulnerable. Such sentiment was exacerbated by the PP’s ongoing corruption scandals, making many feel disenchanted with established political parties.
The Indignados movement inspired discourse on a new type of politics based on transparency and anti-austerity policies. Under the leadership of political scientist Pablo Iglesias Turrión, Podemos suddenly emerged as a left-wing populist challenger that urged the disenchanted to convert indignation into political change. The European Parliament elections held on May 2014 have been referred to as the official breakdown of bipartisanship in Spain (Medina, 2016). While the PP won the election, it was the first time that the two major parties collectively received less than 50% of the popular vote. Podemos, which had only appeared on the political scene four months earlier, won 8% of the votes and five seats in the EP. This remarkable performance made Podemos the fourth largest party after the PP, the PSOE and a left-wing coalition of several regional and national parties. Indeed, the 2014 European parliament elections ushered in a new era of electoral dynamics in the Spanish political system. The years that followed would be characterized by several unprecedented happenings in Spanish politics that can be traced back to the 2010-2014 period covered by the POLAT Panel Survey.
VARIABLES[Up]
The POLAT Panel portrays Spanish public opinion on the most relevant economic, social and political events of this tumultuous time period. A total of 376 survey questions may be grouped thematically into the following four distinct blocks: (i) political attitudes and issue placement; (ii) political behavior, including voting, protest, political news consumption and social media use; (iii) economic perceptions indicators, including a relevant crisis battery; (iv) expanded socio-demographics.
The first thematic block covers many standard indicators of political attitudes, including social trust, political efficacy, political interest, trust in institutions and political leaders, partisanship and left-right placement of Spain’s main political parties, as well as evaluations of political and economic performance. It also features attitudinal variables that are less frequently found in panel datasets, including indicators of the support for redistribution (inheritance taxes), the civic duty to vote, nationalism, evaluations of political parties’ competence to address the economic and political problems of the day, the importance of values that parents teach their children (authoritarian values) and risk aversion, among others. The dataset also offers a rich set of questions on citizens’ issue positions on immigration, abortion, taxes vs. public services, preferences for Spain’s territorial organization, same-sex adoption and support for austerity policies. All waves include batteries measuring levels of political knowledge.
The highlight of the second thematic block on political behavior is a battery of survey items related to social movements, including but not limited to support for the 15M movement, that aim to capture public opinion on key episodes of contention during this time period. POLAT not only records participation in austerity protests but also the perceived risk of taking part in various types of protests and support for those taking part therein. This last item features the most contentious protest repertoires, including resistance to house evictions and setting up camping tents in public squares.
In addition to protests, POLAT features a complete array of standard survey indicators of political behavior: vote choice across municipal, regional, national and European elections, including both recall and probability of voting items. In addition, a substantial number of questions dealing with political participation, both online and offline, were asked across waves (e.g., signing a petition, boycotting a product, etc.). Finally, POLAT collects an ample set of items on news consumption and social media usage, including the frequency of consumption and the main news outlets.
The third thematic block features items that are tailored at various aspects of working and living conditions. These are especially relevant as data collection coincided with the height of the Great Recession in Spain. Researchers using POLAT have access not only to standard items of individual and household economic conditions (e.g., income, contract type, self-employment) but also to a detailed battery on working conditions, employment stability and reduction in household expenses, as well as economic hardships associated with the crisis. POLAT also captures subjective economic well-being with items on satisfaction with working conditions, job and economic prospects and emotions generated by the economic crisis. Finally, POLAT also includes a few items on various economic policy proposals related to the Great Recession that were put forth by social movements.
The final thematic block features an expanded set of socio-demographic characteristics, households and family background. The indicators in this block record the size of respondents’ social networks, the presence of children in the household, house ownership or mortgage payments and receipt of government benefits. One wave of POLAT also records attendance at public or charter schools and other variables related to the respondents’ childhood, including the frequency of political discussions at home and the educational backgrounds and levels of political engagement of the respondents’ parents.
SURVEY DESIGN[Up]
The population under investigation consists of internet users of Spanish nationality and residence, between ages 16 and 44 at the time of the first panel round (2010). Since at that time internet use among older cohorts was limited, the panel included only ages where users where considered sufficiently representative of their cohort. The sample was produced by the firm in charge of the fieldwork, based on a panel of—at the time—over 100,000 Spanish citizens, built by selective invitations (self-registration is not permitted and no internet user can register for the database without having been previously invited). A total of 3,150 panelists were invited to answer the survey, of which the target of 2100 was achieved in less than two weeks. Respondents received incentives in the form of points that could be redeemed for gifts as a function of the survey’s duration.
The sample was obtained using quotas for sex and age (yielding six categories: 16-24, 25-34 and 35-44 for men and women), municipality size (yielding three categories: 50,000 inhabitants or less, between 50,001 and 500,000 inhabitants and more than 500,000 inhabitants) and region (autonomous community). Due to an over-representation of individuals with higher education in the first wave, 620 additional respondents with lower education levels (high school or less) were added to the second wave, which makes a total of 2,720 respondents. While in the first four waves only respondents who had participated in the previous wave (i.e., at t-1) were re-contacted, all respondents who had participated in any one earlier wave were recontacted as of wave 5.
The fourth wave of the panel included a question to understand participants’ motivation to take part in the panel. Only a very small portion of respondents (6%) indicated interest in politics as their main motive. Generally, participants indicated they were motivated by the possibility of giving their opinion (43%), by habit or duty (25 % responded “I always answer surveys”) and by the incentives provided by the survey company (21%).
Table 1.
Overview of POLAT Panel waves
| Wave | N | Field work | Respondent inclusion criteria |
|---|---|---|---|
| Wave 1 | 2,100 | Nov. 17 — Dec. 10, 2010 | — |
| Wave 2 | 2,433 | May 11 — May 25, 2011 | Participated in wave 1 |
| Wave 3 | 1,979 | Nov. 9 — Nov. 18, 2011 | Participated in wave 2 |
| Wave 4 | 1,717 | May 11 — May 30, 2012 | Participated in wave 3 |
| Wave 5 | 1,757 | May 17 — June 4, 2013 Oct. 16 — 27, 2013 |
Participated in waves 1, 2, 3 or 4 |
| Wave 6 | 1,071 | May 5 — May 12, 2014 | Participated in waves 1, 2, 3, 4 or 5 |
PANEL ATTRITION[Up]
One of the main challenges of panel data is the dropout of participants between panel waves (i.e., panel attrition or mortality). Overall, the POLAT panel has retained a large share of its sample (49 %) during either five or all six waves of the panel. An additional 30% of respondents participated in three or four waves and 21% in only one or two waves.
Table 2 breaks down mortality patterns across panel waves. Each cell in Table 2 contains the number of respondents who did not participate in a given wave (at time t), but had participated in the previous wave (at time t -1). For example, of the 2,100 respondents who participated in wave 287 did not participate in the second wave. That is, 14% of the sample from the first wave was lost due to attrition in the second. As seen in Table 2, the highest mortality between subsequent waves in absolute and relative terms was registered in the sixth wave. However, in waves 5 and 6, participants that had participated in prior waves other than the previous wave were invited to participate in the panel anew. As such, 382 panelists that we lost after waves 1, 2 or 3 were ‘recovered’ in wave 5 (approximately 28%), while 98 panelists that we lost after waves 1, 2, 3 or 4 were ‘recovered’ in wave 6 (approximately 5%).
Table 2.
Attrition rate in the POLAT Panel by wave
| N | % of the sample lost from the previous wave | |
|---|---|---|
| Wave 1 | — | — |
| Wave 2 | 287 | 14 |
| Wave 3 | 454 | 19 |
| Wave 4 | 262 | 13 |
| Wave 5 | 342 | 20 |
| Wave 6 | 755 | 43 |
| Total sample | 2,100 |
While the representativeness of a sample is certainly not a strong point of panel surveys, it is important to assess if some characteristics are conditioning the likelihood of respondents leaving the panel, because this could be a source of potential bias. Table A1 in the Appendix reveals that education level exerts the most consistent effect: for all panel waves, respondents with a lower level of formal education were more likely to drop out from the panel. This effect is statistically significant in most waves. In two waves, women and younger respondents were also more likely to drop out. Participants who spent more time online and who express their opinions online were less likely to drop out. The effects of municipality size, employment status, political interest and living with their partner are too weak or inconsistent to be considered relevant.
VALIDITY CHECKS[Up]
We test the validity of some of our indicators against a concurrent wave of the European Social Survey (ESS), as well as a monthly Barometer conducted by the Centro de Investigaciones Sociológicas (CIS). Both the ESS and the CIS Barometer conduct face-to-face surveys on representative samples of the Spanish population based on rigorous sampling methods and tested field protocols. Due to differences in the sampling and the method of data collection, both surveys provide a high benchmark for cross-validating the POLAT dataset.
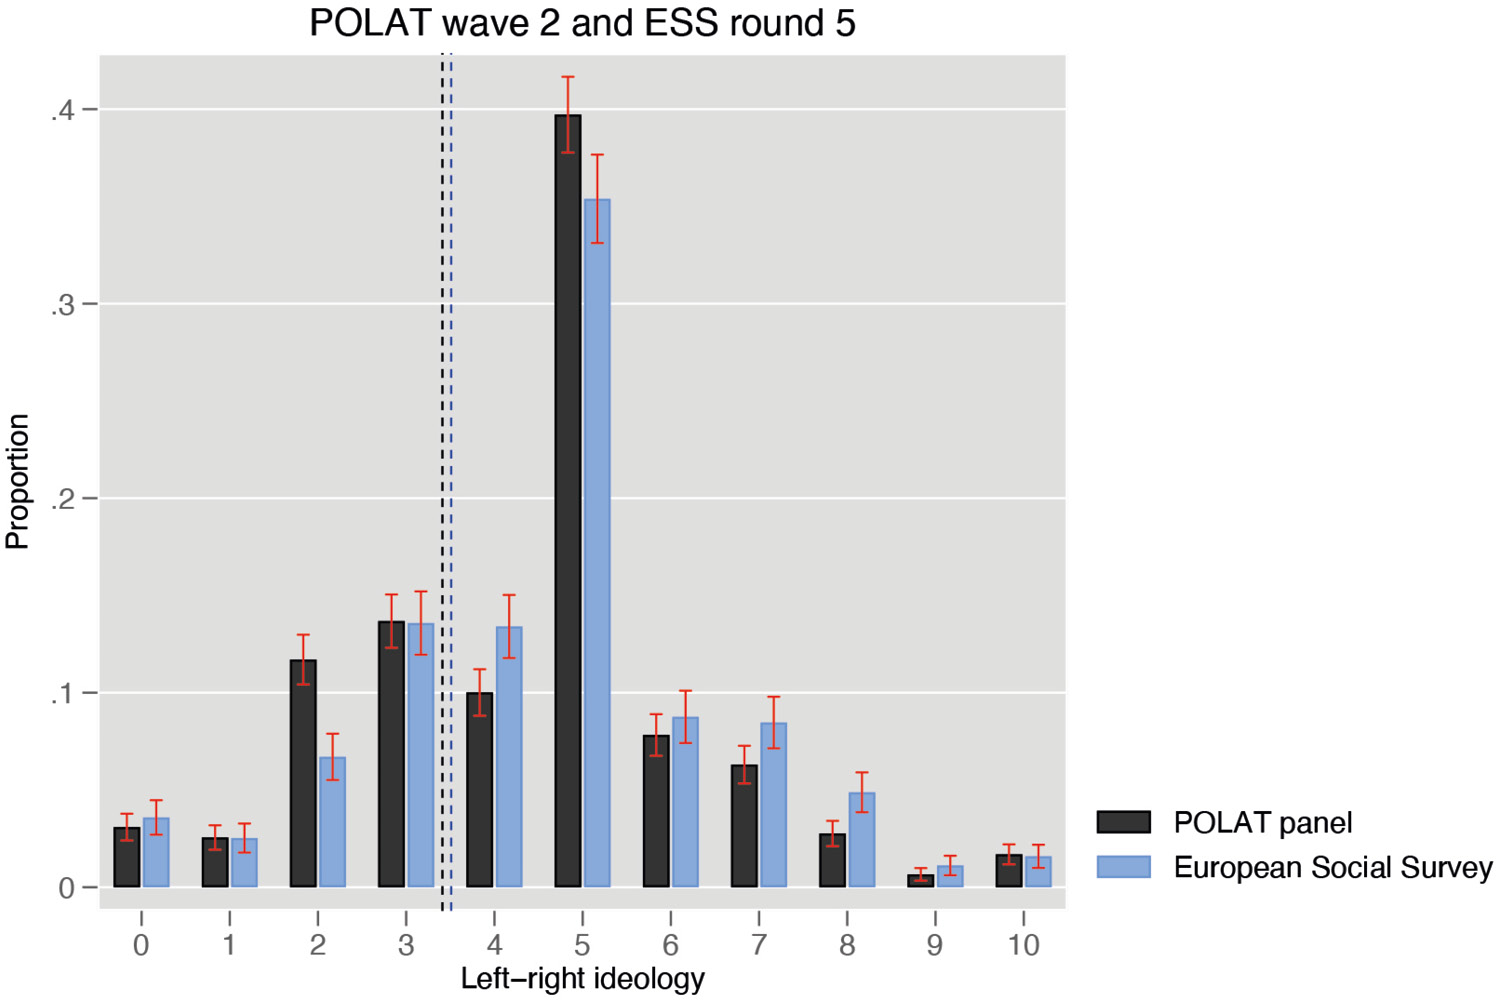
We first conduct static validation at a single point in time by comparing the placement of respondents on the left-right political space, a widely used political attitude in the second wave of the POLAT Panel (fielded in May 2011) and the fifth round of the ESS (fielded between April and July 2011). The formulation and response categories of the questions are very similar in both surveys, thus providing a sound basis for comparison. The average ideology (the vertical dashed lines in Figure 1) is almost identical: 4.41 (4.34-4.49 95% CI) in the POLAT data and 4.52 (4.45-4.58 95% CI) in the ESS. Figure 1 reveals that distribution along the left-right political spectrum amongst respondents in the POLAT Panel and the ESS is similar.
Figure 1.
Comparison of self-placement along ideological spectrum between POLAT (wave 2) & ESS (round 5)
|
Note: Entries report the proportion of respondents in each category of the ideological scale and 95% confidence intervals. Dashed lines indicate the mean placement in each survey. In the ESS, extremes are labeled as “left” and “right,” while with POLAT, they are labeled as “extreme left” and “extreme right.” |
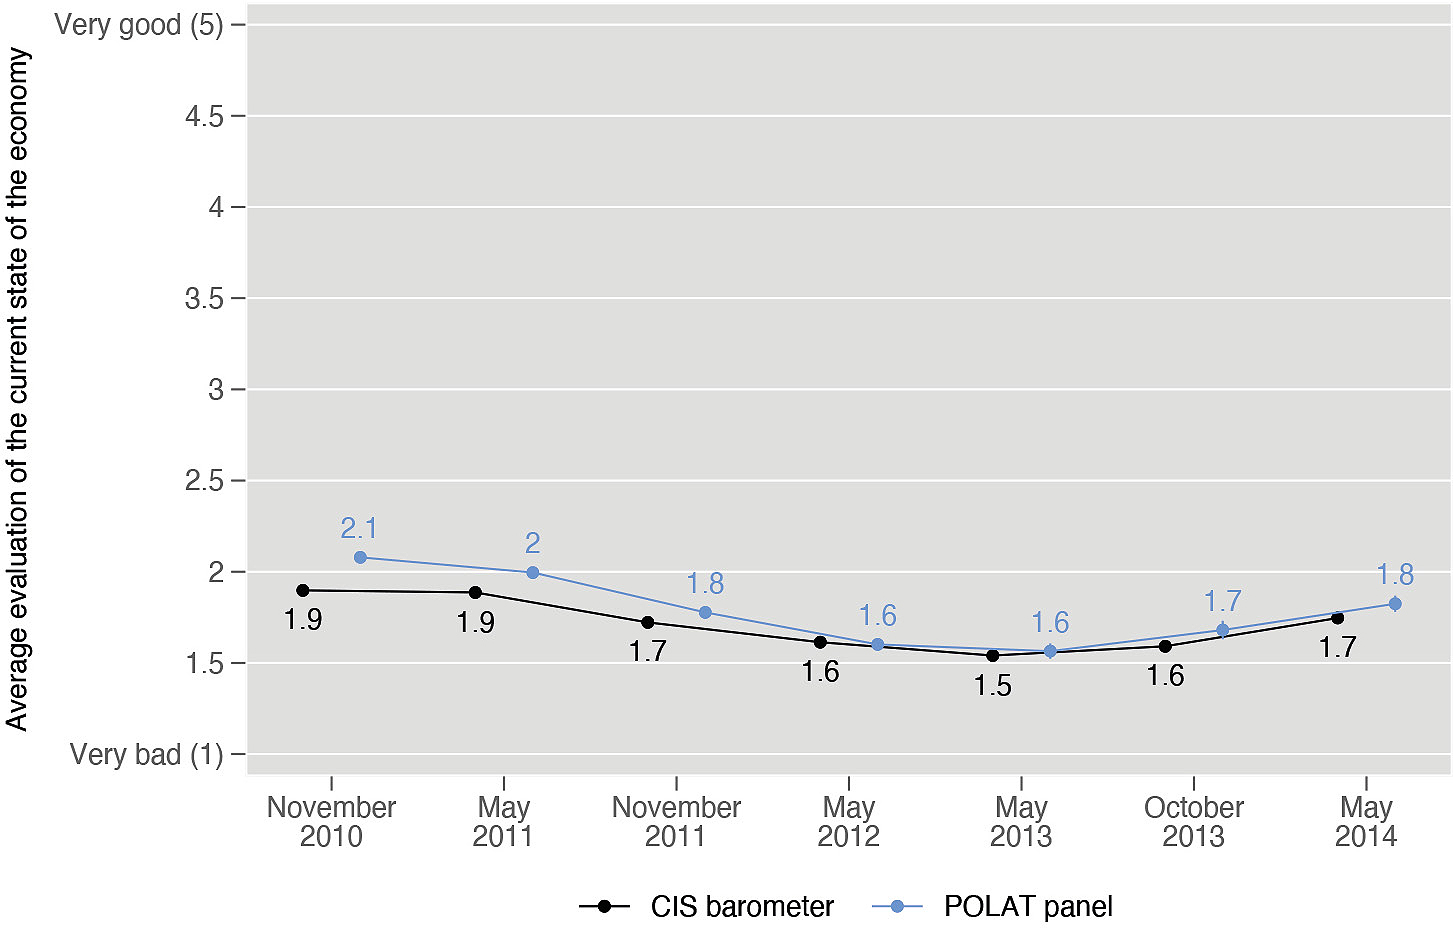
To assess the capacity of our panel to track changes in Spanish public opinion, we also conduct a dynamic validation across time. We draw on a question capturing respondents’ evaluation of the current state of the Spanish economy. This question is ideal as it employs the same wording across surveys and waves. Furthermore, it is widely used as predictor vote choice. The results presented in Figure 2 reveal that the temporal trends identified by the POLAT Panel mirror those in the CIS Barometer. The POLAT Panel offers similar, if not identical, average values on key ideological and economic indicators in concurrent waves of the ESS and the CIS Barometer. POLAT thus fares well when compared to extant surveys with more rigorous sampling procedures and face-to-face interviews.
Figure 2.
Comparison of Evaluation of Current State of the Economy in POLAT & CIS Barometer
|
Note: While the above figure contains 95% confidence intervals, they are indistinguishable from the value points due to how small they are. |
ILLUSTRATING POTENTIAL APPLICATIONS OF POLAT BY EXAMINING EVALUATIONS OF THE CURRENT STATE OF THE ECONOMY [Up]
The POLAT panel provides opportunities to analyze within-individual changes in attitudes and behaviors and to relate them to contextual features. Just two days after fieldwork for wave 3 was complete, the incumbent PSOE government failed to secure a victory in the general elections. Given the deterioration of evaluations of the economy leading up to the elections, one might argue that Spaniards displayed textbook economic voting behavior—they punished the incumbent for their unsatisfactory management of the economy by voting for the opposition. We may wonder to what extent economic voting is a pattern that distinguishes some individuals from others (those that have more negative views of the economy being less likely to vote for the incumbent), or rather a mood (those that become more negative, becoming less likely to vote for the incumbent. This is addressed in model 1 in Table 3, which presents the results of within-between random-effects models intended to separate the effect of differences between individuals from the effect of changes within individuals (Mundlak, 1978; Bell & Jones, 2015).
As we can see, both between-individual differences in evaluations of the economy and within-individual differences in these evaluations equally affect the likelihood of voting for the incumbent. The effect of within-individual changes is a particularly demanding test for the economic voting theory. When a given individual assesses the current state of the economy as better off by one unit than they had in the previous wave (on a five-point scale), their likelihood of voting for the incumbent increases by 2.37 units on a 0-10 scale, controlling for identifying with the party in power, as well as the standard socio-demographics of sex, age and education. In fact, a within individual change in the evaluation of the economy from “bad” to “good” (a 2-unit increase on the 5-point scale) has—on average—an effect on the likelihood of voting for the incumbent not too far from identifying with the party in power.
Table 3.
Analysis of economic evaluations on incumbent vote (between-individuals differences and within-individual changes)
| (1) | (2) | |||
|---|---|---|---|---|
| Within | Between | Within | Between | |
| Economic evaluation | 2.366[***] (0.16) |
2.375[***] (0.207) |
2.800[***] (0.191) |
1.937[***] (0.282) |
| PP in power | -0.147 (0.082) |
-1.046[***] (0.212) |
||
| Economic evaluation X PP in power | -1.515[***] (0.259) |
1.097 (0.629) |
||
| Incumbent party ID | 6.127[***] (0.072) |
5.733[***] (0.122) |
6.096[***] (0.072) |
5.711[***] (0.121) |
| Age | -0.168[***] (0.018) |
-0.004 (0.004) |
-0.037 (0.027) |
-0.001 (0.004) |
| Education | -0.049 (0.034) |
-0.023[*] (0.011) |
-0.041 (0.034) |
-0.026[*] (0.011) |
| Female | 0.254[***] (0.059) |
0.242[***] (0.059) |
||
| Constant | 0.254[***] (0.059) |
1.723[*] (0.188) |
||
| N | 11,056 | 11,056 | ||
Given that the incumbent changes along time, we can also assess whether the influence of the current state of the economy on voting behavior changes depending on who is in power. This is addressed in model 2 of Table 3, which includes an interaction between the party in power (PP 1, PSOE 0) and evaluations of the current economy. We can see that the impact of within-individual changes in economic evaluations on the likelihood of voting for the incumbent is moderated by the party in power: the strength of the effect diminishes by 1.52 units on the 0-10 scale when the PP is in power. The effect remains positive, meaning that the PP is also rewarded for good economic performance, but not as much as the PSOE (see Figure 3).
Figure 3.
Marginal effect of economic evaluation on the probability of voting for the incumbent by party in power
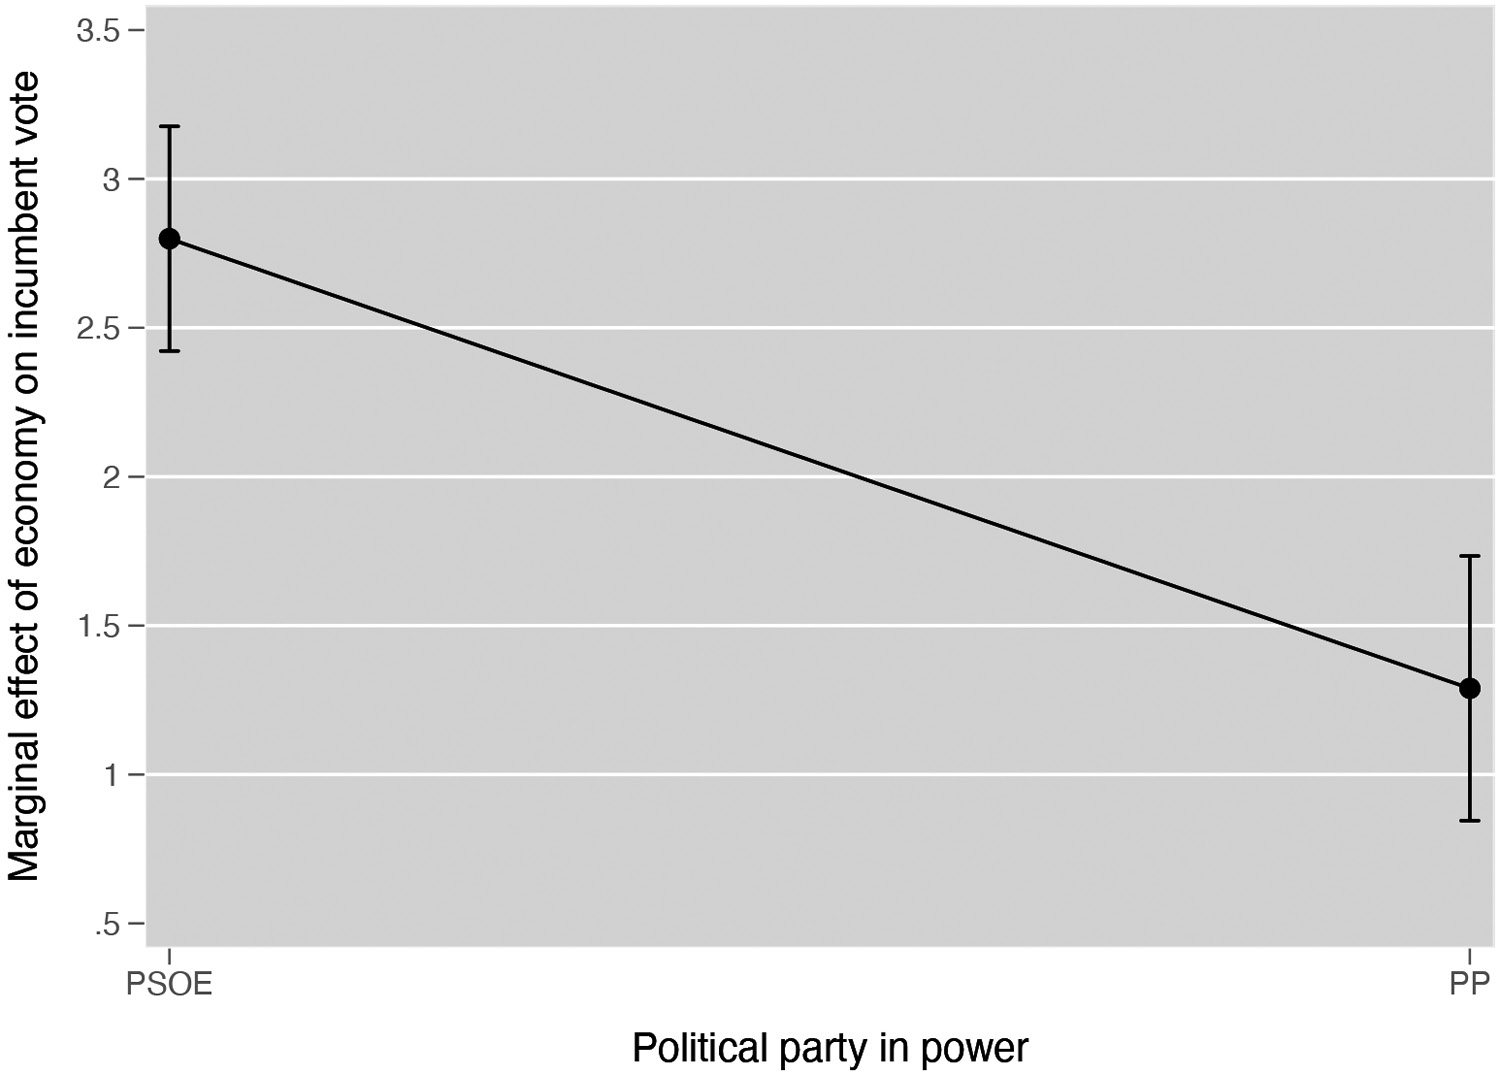
Given that the PP is commonly regarded as being more adept at managing the economy than PSOE (Martín & Urquizu-Sancho, 2012), it may be the case that economic expectations are higher when the PP is in power, leading to lower rewards even when these expectations are met (as an outstanding student in mathematics receiving less praise from a teacher or parent for an excellent grade on a mathematics exam compared to another student who is generally not as strong in mathematics). These findings suggest that parties positioned on the left of the political spectrum might have to most to gain from stimulating the economy.
DECLARATION OF INTEREST [Up]
The first four waves of this panel were the product of a collaboration between the Center for Sociological Research (CIS) and the UAB research group Democracy, Elections and Citizenship (DEC). The authors want to acknowledge financial support from project CSO2010-18534 Cambio y Estabilidad en las Actitudes Políticas, from the Spanish Ministry of Economy and Competitiveness.
Declaration of interest: none
DATA AVAILABILITY[Up]
Data are available here:
Hernández, E., Galais, C., Rico, G., Muñoz, J., Hierro, M.J., Pannico, R., Barbet, B., Marinova, D., Anduiza, E. (2020) POLAT Panel. Spanish Political Attitudes Dataset (6 waves). Barcelona: Universitat Autònoma de Barcelona. https://ddd.uab.cat/record/243399
The dataset (.cvs, .dta formats) are accompanied by a readme.txt file with essential information about the dataset, the original survey questions used in the six waves (in Spanish), the methodology report (in English and Spanish) and the Data Management Plan (in English). The dataset is available not only for individual researchers, research labs and institutions but also for citizens, educators, funders, civil servants and industry. The dataset is registered under a CC0 Creative Commons license.
Further releases of subsequent waves are in preparation and can be made available upon request.
References[Up]
|
Anduiza, E., Cristancho, C., & Sabucedo, J. M. (2014). Mobilization through online social networks: the political protest of the indignados in Spain. Information, Communication & Society, 17(6), 750-764. https://doi.org/10.1080/1369118X.2013.808360 |
|
|
Ares, M., & Hernández, E. (2017). The corrosive effect of corruption on trust in politicians: Evidence from a natural experiment. Research & Politics, 4(2), 2053168017714185. https://doi.org/10.1177/2053168017714185 |
|
|
Bell, A., & Jones, K. (2015). Explaining fixed effects: Random effects modeling of time-series cross-sectional and panel data. Political Science Research and Methods, 3(1), 133-153. https://doi.org/10.1017/psrm.2014.7 |
|
|
Field, B. N. (2009). A ‘second transition’ in Spain? Policy, institutions and interparty politics under Zapatero (2004-8). South European Society and Politics, 14(4), 379-397. https://doi.org/10.1080/13608740903503803 |
|
|
Galais, C., & Lorenzini, J. (2017). Half a loaf is (not) better than none: How austerity-related grievances and emotions triggered protests in Spain. Mobilization, 22(1), 77-95. https://doi.org/10.17813/1086-671X-22-1-77 |
|
|
Gidron, N., Sheffer, L., & Mor, G. (2022). The Israel Polarization Panel Dataset, 2019-2021. Electoral Studies, 80, 102512. https://doi.org/10.1016/j.electstud.2022. 102512 |
|
|
Hernández, E., Galais, C., Rico, G., Muñoz, J., Hierro, M.J., Pannico, R., Barbet, B., Marinova, D., Anduiza, E. (2020) POLAT Panel. Spanish Political Attitudes Dataset (6 waves). Barcelona: Universitat Autònoma de Barcelona. https://ddd.uab.cat/record/243399 |
|
|
Martín, I., & Urquizu-Sancho, I. (2012). The 2011 general election in Spain: the collapse of the socialist party. South European Society and Politics, 17(2), 347-363.https://doi.org/10.1080/13608746.2012.708983 |
|
|
Martínez, J. S. (2014), ‘¿Aumenta la crisis necesariamente la desigualdad?’/‘Does the crisis need to increase inequality?’, Agenda Pública, 20 January, http://www.eldiario.es/agendapublica/impacto_social/crisis-necesariamenteaumenta-desigualdad_0_219428169.html. Accessed 11 August 2016. |
|
|
Medina, L. (2016). Crisis, changes and uncertainty: Spanish party system after the Great Recession. Portuguese Journal of Social Science, 15(2), 237-254. https://doi.org/10.1386/pjss.15.2.237_1 |
|
|
Medina, L. and Muñoz, J. (2014). ¿Quiénes y por qué cambiaron su voto? El análisis de las transferencias de voto entre 2008 y 2011. Las Elecciones Generales de 2011. Madrid: Centro de Investigaciones Sociológicas. |
|
|
Mundlak, Y. (1978). On the pooling of time series and cross section data. Econometrica: journal of the Econometric Society, 69-85. https://doi.org/10.2307/1913646 |
|
|
Royo, S. (2009). After the fiesta: The Spanish economy meets the global financial crisis. South European Society and Politics, 14(1), 19-34. https://doi.org/10.1080/13608740902995828 |
|
|
Scherpenzeel, A. (2011). Data collection in a probability-based internet panel: how the LISS panel was built and how it can be used. Bulletin of Sociological Methodology/Bulletin de Méthodologie Sociologique, 109(1), 56-61. https://doi.org/10.1177/0759106310387713 |
|
|
Torcal, M., Santana, A., Carty, E., & Comellas, J. M. (2020). Political and affective polarisation in a democracy in crisis: The E-Dem panel survey dataset (Spain, 2018-2019). Data in brief, 32, 106059. https://doi.org/10.1016/j.dib.2020.106059 |
APPENDIX[Up]
Table A1.
Predictors of attrition between subsequent waves
| All waves | Wave 2 | Wave 3 | Wave 4 | Wave 5 | Wave 6 | |
|---|---|---|---|---|---|---|
| Municipality size: 50,000-500,000 | -0.08 (0.06) |
-0.06 (0.15) |
-0.10 (0.12) |
0.04 (0.15) |
0.06 (0.14) |
-0.06 (0.12) |
| Over 500,000 | 0.12+ (0.07) |
0.00 (0.18) |
0.02 (0.15) |
0.22 (0.18) |
0.12 (0.18) |
0.06 (0.12) |
| Female | 0.14[**] (0.05) |
0.05 (0.13) |
0.25[*] (0.11) |
0.06 (0.14) |
0.10 (0.13) |
0.23[*] (0.10) |
| Age | 0.01+ (0.00) |
-0.01 (0.01) |
0.01 (0.01) |
0.02 (0.01) |
-0.03[**] (0.01) |
-0.03[***] (0.01) |
| Education | -0.07[***] (0.01) |
-0.12[**] (0.04) |
-0.14[***] (0.03) |
-0.02 (0.04) |
-0.10[**] (0.03) |
-0.03 (0.03) |
| Employed | -0.02 (0.06) |
0.03 (0.15) |
-0.02 (0.12) |
-0.13 (0.15) |
0.15 (0.14) |
0.16 (0.11) |
| Living with the partner | -0.01 (0.06) |
-0.11 (0.15) |
-0.24[*] (0.12) |
0.12 (0.16) |
0.07 (0.14) |
0.25[*] (0.11) |
| Political interest | -0.04 (0.03) |
-0.02 (0.08) |
0.00 (0.07) |
-0.04 (0.08) |
-0.10 (0.08) |
-0.01 (0.06) |
| Expresses opinions on the internet | -0.12[*] (0.05) |
0.01 (0.14) |
-0.14 (0.11) |
-0.12 (0.14) |
-0.17 (0.13) |
0.02 (0.10) |
| Time spent on the internet per day | -0.03 (0.02) |
-0.07 (0.05) |
-0.05 (0.04) |
-0.02 (0.05) |
-0.08+ (0.05) |
-0.06+ (0.04) |
| Constant | -1.09[***] (0.18) |
-0.80+ (0.43) |
-1.14[**] (0.37) |
-2.20[***] (0.48) |
0.28 (0.44) |
0.61+ (0.35) |
| Observations | 9,931 | 2,099 | 2,415 | 1,958 | 1,717 | 1,742 |
|
DV: 0 “No dropout” 1 “Dropout.” Reference category for Municipality size: Less than 500,000. Standard errors in parentheses. |
|
Note: “Female”, “Employed”, “Living with the partner” and “Expresses opinions on the internet” are dummy variables (0-1) that indicate the status of the respondent. The “Education” variable is a six-value scale (from “Primary education or less” to “University education or more”). The “Political interest” variable is a four-value scale that ranges from “Not at all interested” to “Very interested”. The “Time spent on the internet per day” variable is a six-value scale that ranges from “Less than 1 hour” to “More than 8 hours.” |