FIGURE I. Percentage of repeating students in the Autonomous Regions, PISA 2018
Source: OECD.
https://doi.org/10.4438/1988-592X-RE-2023-402-600
Susana Nieto-Isidro
https://orcid.org/0000-0002-6751-9398
Universidad de Salamanca
Fernando Martínez-Abad
https://orcid.org/0000-0002-1783-8198
Universidad de Salamanca
Abstract
The high percentage of repeating students in the Spanish educational system is a recurring problem whose diagnosis has usually been addressed from the student level and their personal and socio-demographic characteristics. In this work, a different point of view is adopted, with the aim of looking for variables at the school level and at the regional level (Autonomous Communities) that are related to the grade retention, whether they are of a socio-demographic and economic nature, or educational factors subject to be controlled. To do this, based on the data from the Spanish PISA 2018 sample on grade repetition, the proportion of repeaters per center is used as the dependent variable, which is a quantitative variable that is related to different context variables added at the center level and with different socioeconomic and educational variables aggregated at the Autonomous Community level, obtained from both the PISA data and other national and international institutional sources. The initial descriptive and correlational analysis serves as a basis for obtaining the relevant variables included in a two-level multilevel model, in which the first level is constituted by the centers and the second level is constituted by the Autonomous Communities. The results point to the importance of four types of variables at the center level: socioeconomic, demographic, related to teaching resources and related to teaching work. At the Autonomous Community level, some indices related to social inequality and quality of life are relevant, as well as some aggregate variables related to resources and teaching work. The results point to the importance of improving the human and material resources assigned to the centers and to modify some aspects of the teaching work and the teacher-student relationship to reduce the proportion of repeat students in Spain.
Keywords: grade retention, PISA, multilevel analysis, educational policy, secondary education.
Resumen
El alto porcentaje de estudiantes repetidores en el sistema educativo español es un problema recurrente cuyo diagnóstico se ha abordado habitualmente desde el nivel del estudiante y sus características personales y socio-demográficas. En este trabajo se adopta un punto de vista diferente, con el objeto de buscar variables a nivel del centro escolar y a nivel regional (Comunidades Autónomas) que estén relacionadas con la repetición de curso, ya sean de carácter socio-demográfico y económico, o factores educativos susceptibles de ser controlados. Para ello, a partir de los datos de la muestra española de PISA 2018 sobre repetición de curso, se utiliza como variable dependiente la proporción de repetidores por centro, que es una variable cuantitativa que se relaciona con diferentes variables de contexto agregadas a nivel de centro y con diferentes variables socioeconómicas y educativas agregadas a nivel de Comunidad Autónoma, procedentes tanto de los datos PISA como de otras fuentes institucionales nacionales e internacionales. El análisis descriptivo y correlacional inicial sirve como base para la obtención de las variables relevantes incluidas posteriormente en un modelo multinivel de dos niveles, en el que el primer nivel lo constituyen los centros y el segundo nivel lo constituyen las Comunidades Autónomas. Los resultados apuntan a nivel de centro a la importancia de variables de cuatro tipos: socioeconómicas, demográficas, relacionadas con los recursos docentes y relacionadas con la labor docente. A nivel de Comunidad Autónoma son relevantes algunos índices relacionados con la desigualdad social y la calidad de vida, así como algunas variables agregadas relacionadas con los recursos y la labor docente. Los resultados apuntan a la importancia de mejorar los recursos humanos y materiales asignados a los centros así como a modificar algunos aspectos de la labor docente y la relación profesor-estudiante para reducir la elevada proporción de estudiantes repetidores en España.
Palabras clave: repetición de curso, PISA, modelos multinivel, política educativa, educación secundaria.
PISA assessments by the Organisation for Economic Cooperation and Development (OECD) are an important source of data at different scales in order to conduct highly complex analyses at multiple levels: from student level to higher levels, for example, school, country or region involved in these assessments. Large-scale studies allow us to analyse the effect of some education policies that differ from country to country or region to region, including socio-economic elements, investment in education, segregation, culture, etc.
In this paper we focus on one data from PISA —the proportion of students who state they have repeated a grade— and how this factor may relate with certain personal, contextual, socio-economic and education policy variables of interest.
Grouping will be at school level, i.e., repeating a grade will not be analysed as a dichotomous variable at student level, rather it will be used as a variable dependent on a quantitative variable formed by the proportion of students who state they have repeated grouped by school. Data are used from centres participating in the Spanish PISA 2018 sample (1,082 centres), each with quantitative data on the proportion of repeating students at that school. That variable will be related with factors provided by PISA at student level (considering the average of personal and contextual factors at each centre) and with the characteristics of the centre and, given how Spanish education is organised, with socioeconomic, contextual and education policy data of each Autonomous Region.
A descriptive and correlational analysis as well as multi-level analysis will be used. The latter is appropriate for studying nested data at various levels such as in the case of PISA, but from a different perspective; on one hand, the proportion of repeating students will be used as a dependent variable, in this case quantitative. On the other hand, instead of using common student and centre levels, centres will be used as the first level and Autonomous Regions as the second.
PISA includes information on repeating a grade based on student statements in the context questionnaire so there may be some distortion due to social desirability (López-Rupérez et al. 2021). Nevertheless, the measure given by PISA can generally be considered a good enough approximation of grade repetition for the purpose of this paper.
An interesting point for this study is that Spain has a very unfavourable ranking in this indicator throughout all waves of PISA that have included this data. In PISA 2018, the percentage ranges from 0.9% in Iceland or 2.5% in the UK to 28.7% in Spain or 30.8% in Belgium; the OECD average is 12.6%.
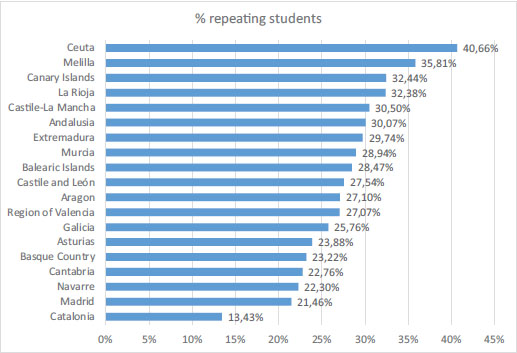
The percentage of repeating students also ranges widely in the different Autonomous Regions in Spain as shown in figure I for PISA 2018 data.
FIGURE I. Percentage of repeating students in the Autonomous Regions, PISA 2018
Source: OECD.
As seen in figure I, there are major differences between the Autonomous Regions of northern Spain (especially Asturias, Catalonia, Navarre and the Basque Country) and those in the south (especially Andalusia) and the islands (Canary and Balearic Islands). This has already been highlighted in various prior studies (Gil-Flores, 2014; López-Rupérez et al., 2021) and has been related with economic factors such as the relative poverty of regions (Daniele, 2021) or GDP per capita (Donato and Ferrer, 2012). These differences are also reflected in the regional distribution of school drop-out rates (Calero et al., 2010) as well as primary education results (González-Betancor and López-Puig, 2021). However, the study by Elosúa (2013) with PISA 2009 reading comprehension data finds that differences are due to individual socioeconomic level rather than regional; Donato and Ferrer (2012) also find no association between PISA 2009 science results and regional wealth, and the multi-level model of Rodríguez-Mantilla et al. (2018) for PISA 2015 science performance in Spain does not pinpoint any variable of influence at regional level.
PISA data can also be used to analyse the evolution of grade repetition in Spain. The difference between the various Autonomous Regions generally remains stable over time, although indicators have improved as highlighted by López-Rupérez et al (2021) in a study with PISA 2012, 2015 and 2018 data, as well as García-Perales and Jiménez (2018) with PISA data from 2000 to 2015.
The debate on the alleged benefits of grade repetition has specific characteristics that make it complicated to obtain a simple answer based on statistical analysis. According to several meta-analysis and literature review studies (Allen et al., 2009; Goos et al., 2021; Jimerson, 2001; Tingle et al., 2012; Valbuena et al., 2021), even though repetition is commonly justified due to poor overall academic performance, it does not appear to have a positive effect on performance and in some cases even shows negative consequences with different effect sizes. Results also differ when comparing repeating students with students of the same age (in different years) or with students from the same year (and who are younger).
One result that seems to be confirmed by available studies is that repetition may have a positive short-term effect but that effect disappears in the long term. In a longitudinal study with secondary students in Belgium, Lamote et al. (2014) show that there is a positive effect in language performance during the year a student repeats but they find a negative effect on that performance in the long term; however, they find no negative effects on self-concept. Similarly, in a longitudinal study with secondary students in the Spanish Canary Islands, Rodríguez (2022) concludes that repeating has no positive effect on academic performance or student motivational variables such as self-concept. Ehmke et al. (2010) also find that repetition has a positive effect on mathematical performance with secondary students in Germany, and improved mathematical self-concept in repeating students one year after they have repeated a year.
In the case of PISA data, at student level and for all countries, studies on grade repetition seems to concur that there is a negative relationship with academic performance in mathematics, reading and science; this negative relationship between grade repetition and performance in PISA is also maintained in more detailed analyses on some specific groups of students. For example, Hermann and Kopasz (2021) study the relationship between national education policies and the gender gap in mathematics, reading and science with PISA 2012 data and find that grade repetition (grade retention) is the factor with the most consistent correlations with the gender gap: boys obtain better results than girls in countries with a high proportion of repeating students regardless of performance level. The grade level factor - a measure of grade repetition and school starting age— is also a relevant predictive factor for high and low performance in mathematics and science in a paper by Gilleece et al. (2010) with PISA 2006 data in Ireland.
In the specific case of Spain, this relationship has been highlighted by numerous studies with PISA data from different waves and using different approaches and analysis techniques (García-Perales and Jiménez, 2019). For example, when analysing factors associated with high performance in mathematics for the Spanish PISA 2009 sample, Gorostiaga and Rojo-Álvarez (2016) find that grade repetition has a negative effect on performance. Molina et al. (2022) reach the same conclusion with performance data by gender in mathematics for the Spanish PISA 2018 sample; they indicate that it is the variable with the greatest effect on mathematics scores for both genders. Also, García-Pérez et al. (2014) with PISA 2009 data show the negative impact of repetition, especially during primary education or when repeating more than one grade. The same conclusion is reached by Calero et al. (2012) with PISA 2009 in Spain and Italy: grade repetition is a decisive variable for mathematics performance in both countries and particularly in the case of Spain if repeating a grade during primary education or repeating more than once.
One of the characteristics of grade repetition is that it is directly related with school drop-out rates, in other words, with the proportion of individuals who do not complete compulsory studies. Both Jacob and Lefgren (2009) and Hughes et al. (2017, 2018) use longitudinal studies to show the relationship between grade repetition and students dropping out at the age of sixteen.
The same relationship between grade repetition and dropping out is shown in Spain in a study by Lopez-Rupérez et al. (2021), which uses age-appropriateness rate to show that the level of grade repetition at age 15 is a predictor that secondary education students will not graduate. Also, Guio and Choi (2014) use PISA data from 2000 to 2009 to study factors related to school drop-out rates in Spain including grade repetition; the same as the study by Calero et al. (2010) with PISA 2006 data and Choi and Calero (2013) with PISA 2009 data; in all these cases, grade repetition is one of the personal factors associated with dropping out in Spain.
As regards the percentage of students who repeat a grade, international studies show that it varies greatly for the different countries that implement PISA assessments. Goos et al. (2013) indicate that this percentage depends on various factors including beliefs in each society on the advantages and benefits of this practice. In their literature review on the effects of grade repetition policies in the OECD, Valbuena et al. (2021) conclude that this measure is inefficient given the economic, personal and social effects, and they recommend seeking alternatives, as do Calero et al. (2010), Choi and Calero (2013) and García-Pérez et al. (2014). Rodríguez (2022) also warns of this inefficiency due to the detrimental effects on academic performance and different motivational variables such as self-concept; in the same vein as Ehmke et al. (2010) and Tingle et al. (2012).
In the case of Spain, considerable research effort has been dedicated to analysing factors related with grade repetition although most of these studies have focused on the personal and contextual factors of students. For example, Valbuena et al. (2021) show that students from more economically disadvantaged environments and whose parents have less studies are more likely to repeat, the same as López-Rupérez et al. (2021) with data from the Spanish PISA 2018 sample and García-Pérez et al. (2014) with data from the Spanish PISA 2009 sample, which also show the influence of data of birth (being born in the last quarters of the year), gender (boys) and being an immigrant in the probability of students repeating. With data from the Spanish PISA 2019 sample, Cordero et at. (2014) coincide in the effect of birth month and being an immigrant, along with not attending preschool, family structure or lack of books at home as factors affecting grade repetition. In their study with data from the General Diagnostic Assessment 2009 in Spain, González-Betancor and López-Puig (2016) note that some socioeconomic factors such as the mother’s education level and having an unemployed father significantly affect grade repetition.
Arroyo-Resino et al. (2019), with data from PISA 2015 in Spain, relate grade repetition less with socioeconomic factors, which are less important, than with teaching process factors and non-cognitive factors. The most relevant predictors of their model include student aspiration: those with greater aspirations, who expect to complete more than compulsory secondary education, are less likely to repeat.
This study, however, will not focus on students’ personal factors which are difficult to change, but rather on the contextual factors of schools, and on socioeconomic and education policy factors at regional level. These are the factors that are easier to change in order to minimise the percentage of repeaters, particularly school-related variables.
The objectives of this study are to analyse the proportion of repeating students in Spanish schools participating in PISA 2018 and relate this proportion with different personal (aggregated by centre), contextual, socioeconomic and education policy data at both centre and Autonomous Region level; and to analyse which of these factors could be controlled by school socio-education policies and teaching to reduce the percentage of repeaters per centre.
The main contributions of this study are: not using repetition as a dichotomous variable at student level but as an aggregated quantitative variable, i.e., by analysing the proportion of repeating students in each school and Autonomous Region. Meanwhile, the analysis will be conducted in two phases: initially with a correlational analysis to find variables related with the proportion of repeaters at the school itself (contextual and educational factors) and at regional level (socioeconomic, development and education policy factors). These variables will then be used for a multi-level analysis with an uncommon approach where the first level will be schools and the second Autonomous Regions.
To achieve these objectives, the following research questions are proposed:
This study does not therefore focus on students’ personal characteristics associated with grade repetition, but rather on analysing factors associated with grade repetition at meso (school) and macro (system) level.
This ex post facto study analysed secondary data. Spanish student and school databases available in the PISA 2018 assessment framework were used1 (OCDE, 2019, 2020).
The population defined in PISA 2018 in Spain are Spanish compulsory secondary education students aged 15, grouped in their respective schools, which are considered clusters in the sampling process. The OECD implements a two-stage cluster stratified probabilistic sampling. Each Autonomous Region of Spain (AR) is considered a stratum in PISA 2018, which allows a representative sample of both students and schools in each.
The analysis unit in this paper are schools: as explained later, after pre-processing data a final sample was obtained of n=1082 Spanish schools offering compulsory secondary education, distributed by AR as indicated in table I.
TABLE I. Distribution of schools by Autonomous Region
AR |
Frequency |
Percentage |
Andalusia |
53 |
4.9 |
Aragón |
52 |
4.8 |
Asturias |
55 |
5.1 |
Cantabria |
55 |
5.1 |
Castile and León |
59 |
5.5 |
Castile-La Mancha |
53 |
4.9 |
Catalonia |
50 |
4.6 |
Ceuta |
12 |
1.1 |
Region of Valencia |
52 |
4.8 |
Extremadura |
54 |
5.0 |
Galicia |
59 |
5.5 |
Balearic Islands |
53 |
4.9 |
Canary Islands |
54 |
5.0 |
La Rioja |
44 |
4.1 |
Madrid |
142 |
13.1 |
Melilla |
8 |
0.7 |
Murcia |
52 |
4.8 |
Navarre |
49 |
4.5 |
Basque Country |
126 |
11.6 |
Total |
1082 |
100 |
Source: OECD.
In addition to assessing student performance in mathematics, reading and science, PISA tests include context questionnaires given to students, their families, teachers and management teams. These include extensive information on demographic, socioeconomic, personal, educational, etc., matters of the school environment (OECD, 2019).
The variable criterion of the study was the proportion of repeaters in the school. As for predictor variables, based on evidence obtained from previous studies (e.g., Choi and Calero, 2013; Cordero et al., 2014; Goos et al., 2021; López-Rupérez et al., 2021), and taking into account the modules assessed in PISA 2018 context questionnaires (OCDE, 2019), four blocks were included: socioeconomic variables; demographic, school available resources; and teachers’ work. All related composite indices available in PISA were included in these blocks. Gender and town size variables, especially relevant in literature, were also included.
It is also important to note that this study is multi-level; with the school being level one and AR level two. Key socioeconomic factors were also obtained from other public databases that are widely used in literature (table II): per capita income as a general indicator of AR wealth; spending on education indicators by student and per capita; quality of life indicators (such as the Human Development Index); and socioeconomic inequity and inequality indicators (GINI, AROPE and S80/S20 indices).
TABLE II. Socioeconomic variables (AR level) included in the study
Variable |
Database |
Per capita income |
INE* |
Spending on education per capita |
INEE** |
Spending per student |
INEE |
Human Development Index. |
World Bank Open Data |
GINI Index |
INE |
AROPE (At Risk of Poverty and/or Exclusion) Index |
INE |
S80/S20 Index |
INE |
* National Institute of Statistics, ** National Institute for Educational Assessment.
Source: Compiled by authors.
Other variables included in the study were taken from PISA 2018 databases. Key factors extracted from the student database were added to the schools database, calculating their average. Table III shows the set of variables obtained by block and source database, including the name of each variable in the original databases.
TABLE III. Predictor variables included in the study
Block |
Variable |
Name in PISA |
Database |
Socioeconomic |
Family socioeconomic level |
ESCS |
Student |
Demographic |
Town size |
SC001Q01TA |
School |
Demographic |
Ownership |
SCHLTYPE |
School |
Demographic |
School size |
SCHSIZE |
School |
Demographic |
% of females |
ST004D01T |
Student |
Demographic |
Average immigrants |
IMMIG |
Student |
Demographic |
Change of school |
SCCHANGE |
Student |
Demographic |
Duration of preschool education |
DURECEC |
Student |
School resources |
No. of school teachers |
TOTAT |
School |
School resources |
Student-teacher ratio |
STRATIO |
School |
School resources |
Class size |
CLSIZE |
School |
School resources |
ICTs available in the school |
ICTSCH |
Student |
School resources |
Computer-student ratio |
RATCMP1 |
School |
School resources |
Internet Pc-student ratio |
RATCMP2 |
School |
School resources |
% of teachers with a master’s degree |
PROAT5AM |
School |
School resources |
% of teachers with a PhD |
PROAT6 |
School |
School resources |
Shortage of school materials |
EDUSHORT |
School |
School resources |
Shortage of human resources |
STAFFSHORT |
School |
Teaching |
Student behaviour |
STUBEHA |
School |
Teaching |
Teacher behaviour |
TEACHEHA |
School |
Teaching |
Disciplinary climate in language |
DISCLIMA |
Student |
Teaching |
Direct teacher instructions |
DIRINS |
Student |
Teaching |
Perceived feedback |
PERFEED |
Student |
Teaching |
Stimulation of reading |
STIMREAD |
Student |
Teaching |
Adaptive instruction |
ADAPTIVITY |
Student |
Teaching |
Teacher interest |
TEACHINT |
Student |
Teaching |
Competitiveness in school |
PERCOMP |
Student |
Teaching |
Cooperation in school |
PERCOOP |
Student |
Teaching |
Discriminatory school climate |
DISCRIM |
Student |
Teaching |
Use of ICTs in school |
USESCH |
Student |
Teaching |
Use of ICTs in lessons |
ICTCLASS |
Student |
Source: OECD.
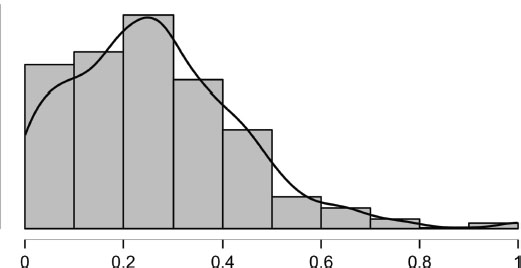
Before the proposed analyses, available data were pre-processed. As outliers were detected in the higher scores of the proportion of repeaters criterion variable data distribution (figure II), in order to avoid possible biases, seven schools were eliminated in which 100% of the students sampled claimed to have repeated a grade. So this study includes 1082 of the 1089 Spanish schools sampled in PISA 2018. Given that the original distribution of schools was altered, the school weighting available in PISA 2018 was not included for data analysis.
FIGURE II. Initial distribution of the proportion of repeaters variable
Prior to applying multi-level models to predict the proportion of repeaters we obtained Pearson correlations between the criterion variable and the set of predictor variables, so that initial multi-level models only included variable significantly correlated with the criterion.
Final models were obtained by a step-by-step regression model: the non-significant variable with the lowest weighted parameter was eliminated one by one and the model was repeated until all variables were significant.
A total of three multi-level models were tests in a nested process:
The multi-level models computed included the main effects of the school level and AR level variables as fixed factors and only intercepts of the different ARs as random factors. This decision is based on the exploratory nature of this study, which focused on detecting global factors associated with grade repetition and not detecting how these factors have a differential influence in each AR.
A significance level of 5% was used and analyses were conducted with JASP version 0.16 free software (descriptive and correlational analysis) and with SPSS (multi-level models).
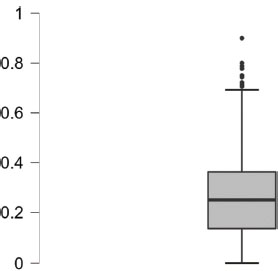
After eliminating outliers, the proportion of repeaters was distributed in an average value of 25.92% with a standard deviation of 16.54%. Figure III shows how the minimum number of repeating students per school in the sample is 0% (61 schools), with a maximum of 90% (1 school). The distribution shows a clear positive asymmetry with most schools ranging between 15% and 35% of repeating students.
FIGURE III. Distribution of the proportion of repeaters after pre-processing
Also note the high correlation between the proportion of repeaters and average school performance scores in PISA (figure IV). The autonomous regions of Ceuta and Melilla, where the percentage of repeating students is clearly higher than the other ARs, stand out in this sense as they correlate with significantly lower performance levels.
FIGURE IV. Proportion of repeaters by AR and relationship with academic performance
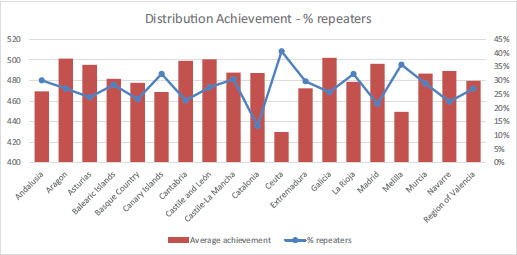
In fact, the correlation between performance assessed in PISA and the proportion of repeaters is very high at both school level and when these variables are aggregated at AR level (table IV).
TABLE IV. Correlations between performance and proportion of repeaters
|
School level |
AR level |
||
rxy |
p |
rxy |
p |
|
Performance in mathematics |
-.722 |
<.001 |
-.724 |
<.001 |
Performance in reading |
-.605 |
<.001 |
-.662 |
.002 |
Performance in science |
-.648 |
<.001 |
-.675 |
.002 |
Regarding correlations between predictor study variables and the proportion of repeating students, table V shows the results in indicators at AR level. Significant correlations can be observed with the overall wealth, quality of life and inequality indicators; direct correlation levels with these latter factors are high.
TABLE V. Correlations between socioeconomic indicators and the proportion of repeaters
|
AR level |
|
r |
p |
|
Per capita income |
-.537 |
.018 |
Spending on education per capita |
-.115 |
.659 |
Spending per student |
-.180 |
.489 |
Human Development Index |
-.757 |
<.001 |
GINI Index |
.596 |
.007 |
AROPE Index |
.611 |
.005 |
S80/S20 Index |
.715 |
<.001 |
Table VI shows how the proportion of repeaters correlates with other sociodemographic and economic variables in PISA. These indicators are all significant at school level and in terms of AR, only socioeconomic level is relevant in line with the inverse correlation with Per capita income. Larger schools in bigger towns which are considered private-charter schools tend to have a lower proportion of repeaters. Meanwhile, schools with a higher percentage of males and a greater rate of immigrant students are associated with higher grade repetition rates. Finally, schools in which students change school more and where students have attended fewer years of preschool are also associated with higher repetition rates.
TABLE VI. Correlations between sociodemographic factors and proportion of repeaters
|
School level |
AR level |
||
rxy |
p |
rxy |
p |
|
Town size |
-.123 |
<.001 |
-.311 |
.195 |
Ownership |
.458 |
<.001 |
.291 |
.227 |
School size |
-.237 |
<.001 |
.342 |
.152 |
Percentage of females |
-.155 |
<.001 |
-.169 |
.488 |
Average immigrants |
.453 |
<.001 |
-.326 |
.172 |
Change of school |
.361 |
<.001 |
-.304 |
.206 |
Duration of preschool education |
-.232 |
<.001 |
-.398 |
.092 |
Family socioeconomic level |
-.715 |
<.001 |
-.783 |
<.001 |
Many factors associated with school resources are significant at both levels as shown in table VII. At school level, student-teacher ratio (more students per teacher means a lower grade repetition rate, in line with the observations above for school and town size) and management team perception on shortage of material resources at the school (greater needs equal greater repetition rate) stand out. However, the computer-student ratio is not related with the percentage of repeaters, and neither is the level of teachers with higher education. In terms of AR, regions with a lower internet connection rate and greater material and human resource needs are associated with a higher proportion of repeaters.
TABLE VII. Correlations between school resources and proportion of repeaters
|
School level |
AR level |
||
rxy |
p |
rxy |
p |
|
No. teacher |
-.105 |
.001 |
.158 |
.518 |
Student-teacher ratio |
-.229 |
<.001 |
.421 |
.073 |
Class size |
-.132 |
<.001 |
.345 |
.149 |
ICTs available in the school |
-.099 |
.001 |
-.643 |
.003 |
Computer-student ratio |
.002 |
.994 |
-.136 |
.580 |
Internet PC-student |
-.037 |
.245 |
-.469 |
.043 |
Percentage of teachers with master’s degree |
.076 |
.033 |
.197 |
.419 |
Percentage of teachers with PhD |
.007 |
.846 |
-.139 |
.570 |
Shortage of school materials |
.241 |
<.001 |
.602 |
.006 |
Shortage of human resources |
.164 |
<.001 |
.620 |
.005 |
Teaching (as perceived by students and management teams) also appears to be significantly associated with the proportion of repeaters, as seen in table VIII. Teaching factors significantly associated with grade repetition at school level include disruptive student and teacher behaviour or negative classroom climate (direct relationship), or frequency of ICT use and cooperative climate (inverse relationship). Teacher skills (such as direct instructions and perceived feedback) are directly related with repeating: this association can be interpreted as the teacher being more significantly involved in contexts with greater academic need. At AR level, these teacher skills are once again most significantly associated with the repetition rate. Use of ICTs in school also has an important inverse association at regional level.
TABLE VIII. Correlations between teaching and proportion of repeaters
|
School level |
AR level |
||
rxy |
p |
rxy |
p |
|
Student behaviour |
.448 |
<.001 |
.389 |
.100 |
Teacher behaviour |
.189 |
<.001 |
.222 |
.361 |
Disciplinary climate in language |
-.060 |
.049 |
.543 |
.016 |
Direct teacher instructions |
.226 |
<.001 |
.675 |
.002 |
Perceived feedback |
.171 |
<.001 |
.505 |
.027 |
Stimulation of reading |
.037 |
.228 |
.601 |
.007 |
Adaptive instruction |
.039 |
.195 |
.399 |
.090 |
Teacher interest |
-.009 |
.776 |
.408 |
.083 |
Competitiveness in school |
-.062 |
.042 |
.287 |
.234 |
Cooperation in school |
-.299 |
<.001 |
-.302 |
.209 |
Discriminatory school climate |
.243 |
<.001 |
.376 |
.113 |
Use of ICTs in school |
-.105 |
.001 |
-.776 |
<.001 |
Use of ICTs in lessons |
-.173 |
<.001 |
-.335 |
.161 |
Firstly, the null model has an intraclass correlation coefficient (ICC) of 8.05%. Despite the literature review (Goldstein, 1995; Snijders and Bosker, 2011) indicating desirable ICC levels of around 10%, the correlational analysis shows numerous significant variables at AR level, which leads us to consider the multi-level analysis to be of interest. Table IX shows parameters of the three final multi-level models obtained. ICC for the complete model is 2.20%, absorbing most intergroup variability with the predictor variables incorporated.
TABLE IX. Multi-level models (L1= level 1, school, L2=level 2, AR)
|
Model 1 |
Model 2 |
Complete model |
||||||
β |
t |
p. |
β |
t |
p. |
β |
t |
p. |
|
Intercept |
-0.374 |
-4.08 |
<.001 |
1.932 |
2.76 |
.011 |
.988 |
1.951 |
.065 |
GINI (L2) |
0.005 |
2.38 |
.025 |
- |
- |
- |
- |
- |
- |
Town Size (L1) |
0.008 |
2.15 |
.032 |
0.008 |
2.16 |
.031 |
- |
- |
- |
Ownership (L1) |
0.028 |
4.38 |
<.001 |
0.028 |
4.45 |
<.001 |
.021 |
3.08 |
.002 |
Percent. males (L1) |
0.154 |
5.03 |
<.001 |
0.154 |
5.01 |
<.001 |
0.139 |
4.50 |
<.001 |
Immigrant rate (L1) |
0.085 |
4.65 |
<.001 |
0.083 |
4.57 |
<.001 |
0.095 |
5.44 |
<.001 |
Changes of sch. (L1) |
0.154 |
10.13 |
<.001 |
0.154 |
10.13 |
<.001 |
0.144 |
9.63 |
<.001 |
Preschool Ed. (L1) |
0.038 |
2.97 |
.003 |
0.037 |
2.856 |
.004 |
0.040 |
3.21 |
.001 |
Socioeconomic lev. (L1) |
-0.177 |
-21.22 |
<.001 |
-0.178 |
-21.32 |
<.001 |
-0.158 |
-19.15 |
<.001 |
ICTs available (L2) |
|
|
|
-0.059 |
-2.29 |
.030 |
- |
- |
- |
PC-Internet ratio (L2) |
|
|
|
-1.787 |
-2.47 |
.022 |
-1.185 |
-2.34 |
.029 |
Student behav. (L1) |
|
|
|
|
|
|
0.012 |
3.56 |
<.001 |
ICT use (L2) |
|
|
|
|
|
|
-0.147 |
-5.37 |
<.001 |
Direct Instruc. (L1) |
|
|
|
|
|
|
0.041 |
3.73 |
<.001 |
Coop. Perception (L1) |
|
|
|
|
|
|
-0.026 |
-2.41 |
.016 |
Regarding socioeconomic and demographic variables, of AR indicators (L2), only the GINI index has minor significant effects in model 1. In the final model, school ownership, percentage of males, immigrant student rate, number of school changes and attending preschool are factors at school level (L1) maintained in all models, with direct effects on the proportion of repeaters.
As for school resources, inverse moderate effects can only be observed at AR level (L2) in two variables related with universal access to ICTs in the ARs.
Finally, various factors related to teaching are significant in the complete model. At AR level (L2), frequency of ICT use is a predictor factor of grade repetition. At school level (L1), disruptive student behaviour and greater direct intervention in instructions by the teacher are risk factors associated with higher repetition rates. School environments in which students perceive a cooperative climate, however, are associated with lower grade repetition rates.
Based on data from the Spanish PISA 2018 sample, grade repetition was analysed by aggregation at school level, calculating the proportion of repeating students at each school, and analysing the relationship between this variable and different indicators at school and regional level. These indicators correspond to four types of variable: socioeconomic, demographic, related to resources and to teaching.
In response to research question Q1, the proportion of repeaters at schools in inversely related with performance in science, mathematics and reading measured by PISA. This result is in line with prior studies that indicate a negative relationship between performance and grade repetition (Calero et al., 2012; García-Perales and Jiménez, 2019; García-Pérez et al., 2014; Gilleece et al., 2010; Gorostiaga and Rojo-Álvarez, 2016; Hermann and Kopasz, 2021; Molina et al., 2022), which questions the use of repetition to improve student performance.
In answer to research question Q2, the school’s aggregate socioeconomic level is found to have a major impact on the proportion of repeaters. This relationship between sociodemographic level and repetition coincides with prior research (Calero et al., 2012; Choi y Calero, 2013, Gilleece et al., 2010; González-Betancor and López-Puig, 2016; Goos et al., 2013; Guio and Choi, 2014, López-Rupérez et al., 2021). School demographic variables such as ownership, town and school size, percentage of females and immigrants, and aggregated values of school changes and duration of preschool education of students, are highly significant, in line with studies on individual factors related with grade repetition (Cordero et al., 2014; García-Pérez et al., 2014; González-Betancor and López-Puig, 2016; López-Rupérez et al., 2021; Valbuena et al., 2021). School human and material resources generally have a slight association with the proportion of repeaters at the school, these include teacher-student ratio and class size. Management team perception on shortage of material and human resources is, however, moderately associated with the proportion of repeaters per centre. Finally, student perception of their own behaviour, overall school functioning, perceived climate, and cooperation and teaching, are also associated with the proportion of repeaters.
In response to research question Q3, at Autonomous Region level we can see a direct influence of sociodemographic factors such as greater socioeconomic inequality and lower quality of life, on the proportion of repeaters, in line with some prior studies (García-Pérez et al., 2014; González-Betancor and López-Puig, 2016; López-Rupérez et al., 2021). Economic inequalities between regions have also proven to have an impact on other aspects of education, such as drop-out rates (Calero et al., 2012) or performance in primary education (González-Betancor and López-Puig, 2021). Daniele (2021) also highlights that the poverty rate in regions of Spain and Italy can predict the rate of students with low performance in mathematics according to PISA, the same as higher levels of inequality, and that regional differences persist even when measures are adjusted based on student ESCS.
However, analysing AR education policy factors like spending on education per student or per capita, highlights that even though they are negatively related with the percentages of repeating students in that region, the direct relationships is not significant. Contradictory results can be found on this matter: Donato and Ferrer (2012) find a positive relationship between Autonomous Region spending on education and performance in science in PISA 2009, while Gil-Flores (2014) find no relationship between PISA 2012 performance in mathematics, reading and science and education resources allocated in the Autonomous Regions.
In the multi-level model developed based on the correlational analysis, the complete model includes variables at school level that are sociodemographic (aggregate socioeconomic level by centre), demographic (school ownership, percentage of males, immigrant student rate, number of school changes and attending preschool), and variables related with teaching (disruptive student behaviour, direct intervention in instructions and perception of a cooperative climate). At AR level, the complete model only includes variables related with aggregate teaching resources at schools, such as ICTs available, PC-Internet ratio and use of ICTs.
Lastly, to answer research question Q4 based on multi-level model results, most socioeconomic and demographic variables (such as ownership or aggregate socioeconomic level) stem from the school’s context and are difficult to change, although the development of education policies designed to promote preschool education and a more even distribution of immigrant students among schools could be useful. Results also emphasise the importance of improving variables related with school human and material resources (especially universal access to ICTs and their use in the classroom) as well as variables related to teaching, such as creating a cooperative climate and improving student behaviour in the classroom.
In summary, by using a clearly differentiated methodological approach, this study obtains results that are in line with prior studies, thus helping to consolidate the literature review. The results obtained point in two fundamental directions. On the one hand they confirm that fundamental factors associated with grade repetition rate at both school and AR level are socioeconomic and demographic, above factors associated with resources available in schools or teaching. These results must lead us to reflect on the approach and orientation of grade repetition in Spain as they highlight ‘a lack of consistency or effectiveness of education compensation mechanisms applied in our country to repeating students’ (López-Rupérez et al., 2021, p. 347). On the other hand, taking these inconsistencies into account, our results point toward certain education variables that may have a key effect of education compensation to increase the efficiency of grade repetition. Based on the results obtained, greater analysis is required on how the following key variables impact the effectiveness of grade repetition: adequate use of ICTs in school activities; classroom climate and coexistence at school; open cooperation climate among teachers; and direct instruction style and academic support for students by teachers.
This study used PISA data which, although an excellent source of data, collects information on variables such as grade repetition from student declarations and data may therefore be biased due to social desirability. In line with most research on grade repetition, this study is cross-cutting and thus limits the possibility of finding causal results. In order to analyse cause-effect relationships between the influential variables detected in this paper, it may be interesting to apply causal inference techniques in future studies so as to attribute causal relationships under certain conditions based on panel data. A detailed analysis of education policies implemented and their effects would also be of undoubted value to understand the best way of addressing a complex phenomenon such as grade repetition. Finally, taking into account the significant implications of the relationships found between some variables in this study, future studies are required with a more specific and detailed analysis of the mechanisms behind each of these associations.
Grant PID2021-125775NB-I00 funded by MCIN/AEI/10.13039/501100011033/ and by ERDF A Way of Making Europe.
Allen, C.S., Chen, Q., Willson, V.L., & Hughes, J.N. (2009). Quality of research design moderates effects of grade retention on achievement: A meta-analytic, multilevel analysis. Educational Evaluation and Policy Analysis, 31(4), 480–499. https://doi.org/10.3102/0162373709352239
Arroyo-Resino, D.; Constante-Amores, I.A. & Asensio-Muñoz, I. (2019). La repetición de curso a debate: un estudio empírico a partir de PISA 2015. Educación XX1, 22(2), 69–92. https://doi.org/10.5944/educXX1.22479
Calero, J., Choi, Á., & Waisgrais, S. (2010). Determinantes del riesgo de fracaso escolar en España: una aproximación a través de un análisis logístico multinivel aplicado a PISA-2006. Revista de Educación, Número Extraordinario 2010, 225–256. https://www.educacionyfp.gob.es/dam/jcr:53d0ecfb-b7b4-4ce9-b2e3-f9280c672801/re201009-pdf.pdf
Calero, J., Escardíbul, J.O., & Choi, Á. (2012). El fracaso escolar en la Europa mediterránea a través de PISA-2009: radiografía de una realidad latente. Revista Española de Educación Comparada, (19), 69–104. https://doi.org/10.5944/reec.19.2012.7578
Choi, Á., & Calero, J. (2013). Determinantes del riesgo de fracaso escolar en España en PISA-2009 y propuestas de reforma. Revista de educación, 362, 562–593. https://doi.org/10.4438/1988-592X-RE-2013-362-242
Cordero, J.M., Manchón, C., & Simancas, R. (2014). La repetición de curso y sus factores condicionantes en España. Revista de Educación, 365, 12–37. https://doi.org/10.4438/1988-592X-RE-2014-365-263
Daniele, V. (2021). Socioeconomic inequality and regional disparities in educational achievement: The role of relative poverty. Intelligence, 84, 101515. https://doi.org/10.1016/j.intell.2020.101515
Donato, L., & Ferrer Esteban, G. (2012). Desigualdades territoriales en España e Italia: nuevas evidencias a partir de la evaluación PISA-2009. Revista Española de Educación Comparada. https://doi.org/10.5944/reec.19.2012.7580
Ehmke, T., Drechsel, B., & Carstensen, C.H. (2010). Effects of grade retention on achievement and self-concept in science and mathematics. Studies in Educational Evaluation, 36(1-2), 27–35. https://doi.org/10.1016/j.stueduc.2010.10.003
Elosúa, P. (2013). Diferencias individuales y autonómicas en el estatus socioeconómico y cultural como predictores en PISA. Revista de Educación, 361, 646–664. https://doi.org/10.4438/1988-592X-RE-2013-361-236
García-Perales, R., & Jiménez, C. (2019). Relación entre repetición de curso, rendimiento académico e igualdad en educación: Las aportaciones de PISA. Revista Educación, Política y Sociedad. 4(1), 84–108. https://revistas.uam.es/reps/article/view/12312
García-Pérez, J.I., Hidalgo-Hidalgo, M., & Robles-Zurita, J.A. (2014). Does grade retention affect students’ achievement? Some evidence from Spain. Applied economics, 46(12), 1373–1392. https://doi.org/10.1080/00036846.2013.872761
Gil-Flores, J. (2014). Factores asociados a la brecha regional del rendimiento español en la evaluación PISA. Revista de Investigación Educativa, 32(2), 393–410. https://doi.org/10.6018/rie.32.2.192441
Gilleece, L., Cosgrove, J., & Sofroniou, N. (2010). Equity in mathematics and science outcomes: characteristics associated with high and low achievement on PISA 2006 in Ireland. International Journal of Science and Mathematics Education, 8(3), 475–496. https://doi.org/10.1007/s10763-010-9199-2
Goldstein, H. (1995). Multilevel statistical models. John Wiley & Sons.
González-Betancor, S.M., & López-Puig, A.J. (2016). Grade retention in primary education is associated with quarter of birth and socioeconomic status. PloS one, 11(11), e0166431. https://doi.org/10.1371/journal.pone.0166431
González-Betancor, S.M., & López-Puig, A.J. (2021) Student achievement in primary education: region matters more than school, Compare: A Journal of Comparative and International Education, 51(8), 1118–1137, https://doi.org/10.1080/03057925.2020.1716304
Goos, M., Pipa, J., & Peixoto, F. (2021). Effectiveness of grade retention: A systematic review and meta-analysis. Educational Research Review, 34, 100401. https://doi.org/10.1016/j.edurev.2021.100401
Goos, M., Schreier, B.M., Knipprath, H.M.E., De Fraine, B., Van Damme, J., & Trautwein, U. (2013). How can cross-country differences in the practice of grade retention be explained? A closer look at national educational policy factors. Comparative Education Review, 57(1), 54–84. https://doi.org/10.1086/667655
Gorostiaga, A., & Rojo-Álvarez, J.L. (2016). On the use of conventional and statistical-learning techniques for the analysis of PISA results in Spain. Neurocomputing, 171, 625–637. https://doi.org/10.1016/j.neucom.2015.07.001
Guio, J.M., & Choi, Á. (2014). Evolución del riesgo de fracaso escolar en España durante la década del 2000: Análisis de los resultados de PISA con un modelo logístico de dos niveles. Estudios sobre educación, 26, 33–62. https://doi.org/10.15581/004.26.33-62
Hermann, Z., & Kopasz, M. (2021). Educational policies and the gender gap in test scores: a cross-country analysis. Research Papers in Education, 364, 461–482. https://doi.org/10.1080/02671522.2019.1678065
Hughes, J.N., Cao, Q., West, S. G., Smith, P.A., & Cerda, C. (2017). Effect of retention in elementary grades on dropping out of school early. Journal of School Psychology, 65, 11–27. https://doi.org/10.1016/j.jsp.2017.06.003
Hughes, J.N., West, S.G., Kim, H., & Bauer, S.S. (2018). Effect of early grade retention on school completion: a prospective study. Journal of educational psychology, 110(7), 974. https://doi.org/10.1037/edu0000243
Jacob, B.A., & Lefgren, L. (2009). The effect of grade retention on high school completion. American Economic Journal: Applied Economics, 1(3), 33–58. https://doi.org/10.1257/app.1.3.33
Jimerson, S.R. (2001). Meta-analysis of grade retention research: Implications for practice in the 21st century. School psychology review, 30(3), 420–437. https://doi.org/10.1080/02796015.2001.12086124
Lamote, C., Pinxten, M., Van Den Noortgate, W., & Van Damme, J. (2014). Is the cure worse than the disease? A longitudinal study on the effect of grade retention in secondary education on achievement and academic self-concept. Educational Studies, 40(5), 496–514. https://doi.org/10.1080/03055698.2014.936828
López-Rupérez, F., García-García, I., & Expósito-Casas, E. (2021). La repetición de curso y la graduación en Educación Secundaria Obligatoria en España: análisis empíricos y recomendaciones políticas. Revista de Educación, 394, 325–393. https://doi.org/10.4438/1988-592X-RE-2021-394-510
Molina, D., Molina, E., Sánchez Pelegrín, J.A., & Contreras, J.M. (2022). Estudio por género del impacto de factores contextuales en el rendimiento matemático del alumnado español en PISA 2018. Revista Complutense de Educación, 33(4), 645–656. https://doi.org/10.5209/rced.76428
OCDE (2019). PISA 2018 Assessment and Analytical Framework https://doi.org/10.1787/b25efab8-en
OCDE (2020). PISA 2018 Technical Background https://doi.org/10.1787/1b045c06-en
Rodríguez, D. (2022). Grade retention, academic performance and motivational variables in Compulsory Secondary Education: a longitudinal study. Psicothema. https://doi.org/10.7334/psicothema2021.582
Rodríguez-Mantilla, J.M., Fernández-Díaz, M., & Jover, G. (2018). PISA 2015: Predictores del rendimiento en Ciencias en España. Revista de Educación, 380, 75–102. http://doi.org/10.4438/1988-592X-RE-2017-380-37
Snijders, T.A., & Bosker, R.J. (2011). Multilevel analysis: An introduction to basic and advanced multilevel modeling. Sage.
Tingle, L.R., Schoeneberger, J., & Algozzine, B. (2012). Does grade retention make a difference? The Clearing House: A Journal of Educational Strategies, Issues and Ideas, 85(5), 179–185. https://doi.org/10.1080/00098655.2012.679325
Valbuena, J., Mediavilla, M., Choi, Á., & Gil, M. (2021). Effects of grade retention policies: A literature review of empirical studies applying causal inference. Journal of Economic Surveys, 35(2), 408–451. https://doi.org/10.1111/joes.12406
Contact address: Susana Nieto-Isidro. Universidad de Salamanca, Instituto Universitario de Ciencias de la Educación. Paseo de Canalejas 169, 37008 Salamanca. E-mail: sni@usal.es
_______________________________