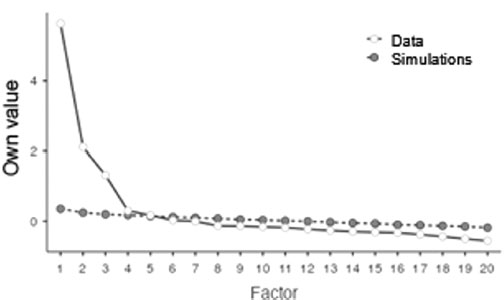
FIGURE I. Sedimentation graph with results of parallel analysis
https://doi.org/10.4438/1988-592X-RE-2023-402-595
Marta Tourón
https://orcid.org/0000-0001-5430-4198
Universidad Internacional de la Rioja
Enrique Navarro-Asencio
https://orcid.org/0000-0002-3052-146X
Universidad Complutense de Madrid
Javier Tourón
https://orcid.org/0000-0001-8217-1556
Universidad Internacional de la Rioja
Abstract
The development of measurement instruments in the field of high abilities in Spain is scarce. The deficit in the identification of these students is due, in part, to this lack. Current identification procedures focus on a global approach that recommends using various information sources and instruments, such as detection scales, that go beyond intelligence or aptitude test scores, among others. The importance of co-cognitive variables, usually malleable, has been highlighted by many authors, so that the triangulation of complementary information sources is considered essential. Here, for the first time, the study of the construct validity of the GRS 2 Parents Scale in Spain is addressed, with a sample of 1334 fathers and mothers. An exploratory and confirmatory factorial study, AFE and AFC, was carried out, and the metrics of the variables and their multivariate normality have been taken into account, adapting the analysis accordingly. Weighted least squares estimation methods were used. Eight models have been studied and, finally, a structure of four first-order factors and two second-order factors is proposed, which explains 58% of the variance of the scores. The fit indices of the model are satisfactory (CFI, .98; TLI, .97; GFI, .98), the convergent validity (AVE, above .54 and Composite Reliability, between .78 and .92) show an acceptable result. The proposed structure improves the original three-factor one. This scale is validated in Spain for the first time and provides a measure for the identification of students with high ability. This study will be completed with the validation of the other two scales for teachers that make up the GRS 2, which is being carried out by the authors.
Keywords: gifted rating scales, high ability, gifted identification, construct validity, confirmatory factor analysis.
Resumen
El desarrollo de instrumentos de medida en el ámbito de las altas capacidades en España es escaso. El déficit en la identificación de estos alumnos se debe, en parte, a esta carencia. Los sistemas actuales de evaluación se centran en un enfoque global que recomienda utilizar fuentes de información e instrumentos diversos, como las escalas de detección, que vayan más allá de las puntuaciones de los tests de inteligencia o aptitudes, entre otros. La importancia de las variables co-cognitivas, de ordinario maleables, ha sido puesta de manifiesto por muchos autores, de modo que la triangulación de fuentes de información complementarias se considera esencial. Aquí se aborda por primera vez el estudio de la validez de constructo de la Escala de Padres de las GRS 2 (Gifted Rating Scales) en España, con una muestra de 1334 padres y madres. Se llevó a cabo un estudio factorial exploratorio y confirmatorio, AFE y AFC, y se ha tenido en cuenta la métrica de las variables y su normalidad multivariada adecuando los análisis. Se emplearon métodos de estimación de mínimos cuadrados ponderados. Se han estudiado 8 modelos y, finalmente, se propone una estructura de cuatro factores de primer orden y dos factores de segundo orden que explica el 58% de la varianza. Los índices de ajuste del modelo son satisfactorios (CFI, .98; TLI, .97; GFI, .98), la validez convergente (AVE, por encima de .54) y la Fiabilidad Compuesta, con valores entre .78 y .92 muestra un resultado aceptable. La estructura propuesta mejora la original de tres factores. Esta escala es la primera validada en España y aporta una medida para la identificación de los alumnos de alta capacidad relevante. Este estudio se completará con la validación de las otras dos escalas para profesores que componen el GRS 2, y que se está llevando a cabo por los autores.
Palabras clave: escala de detección, altas capacidades, identificación, validez de constructo, análisis factorial confirmatorio.
The concept of intelligence understood as a capacity or aptitude and talent as its application to different domains has undergone continuous evolution, from authors such as Galton (1869) or Terman (1925) who described intelligence as a unique, innate and immutable trait, and put their emphasis on its quantification and measurement through IQ tests, to the explanation of a developmental ability, with new models emerging such as those of Gagné (2015, 2018, 2021), Renzulli and Delcourt (2017), Renzulli and Gaesser (2015), Renzulli (2016), Renzulli and Reis (2018, 2021), Pfeiffer (2015a, 2017a) or Olszewski-Kubilius et al. (2019), Worrell et al. (2019) among others, who also highlight the importance of both the context and the co-cognitive factors and variables (Renzulli, 2021) necessary for the development of talent.
On the other hand, the desirability of identifying psychoeducational needs to facilitate the planning of educational care for each schoolchild, in particular for gifted students, and the developmental conception of potential, make it necessary to resort to sources of information beyond the tests associated with the measurement of intelligence or specific aptitudes. Specifically, the importance of context and the non-cognitive or psychosocial, malleable variables proposed by the most contemporary models (Pfeiffer, 2018), brings to the forefront the need for instruments of a diverse nature that make it possible to assess other dimensions beyond the purely intellectual ones, or some dimensions of these, based on standardized tests alone. Thus, the use of different sources of information from the school or family context becomes a necessity (Pfeiffer and Blei, 2008). However, very few instruments are available for this purpose, particularly in Spain.
In this context, it seems particularly important to provide tools to detect student potential and to contribute to a progressive increase in the number of students identified based on their abilities. Although in recent years in Spain some assessment scales for parents, teachers and students have been provided to the educational community, such as those developed by Rogers (2002) and adapted to Spanish by Tourón (2012), which have been available online since 2019, or the Renzulli Scales (Renzulli et al., 2001) for the assessment of the behavioural characteristics of gifted students, the instruments available in Spanish are scarce or lack adequate validation studies.
Therefore, this study aims to carry out the first validation of the parent version of the Gifted Rating Scales (Gifted Rating Scales. Parent Form, GRS 2) in Spanish. This newly developed scale belongs to the second version of the GRS, which includes two other scales for teachers, also currently being validated in Spain by the authors of this paper. The GRS 2, particularly the teacher scales, are the ones with the highest coverage, psychometric quality and with the largest amount of research in English conducted.
The Gifted Rating Scales were originally designed in 2003 and initially developed to determine whether a student could benefit from participating in a programme for highly gifted students, used in conjunction with other diagnostic tests, as part of a student's comprehensive assessment (Pfeiffer and Jarosewich, 2003). However, a review of the literature prior to the development of the original scales revealed certain shortcomings and limitations in the technical adequacy and usefulness of the existing scales (Jarosewich et al., 2002), which reinforced the need for a screening tool that could be completed by teachers, that would help them to assess observable behaviours of their students that might have high potential, and that would be easy to use, valid and reliable.
Thus, the original GRS included two forms for teachers (GRS-P for students in Preschool/Kindergarten; and GRS-S for students in Primary to Secondary education). This allowed teachers to assess behaviours that might indicate high ability in students aged 4-13 years.
In 2019 the scales used until then were revised and a new scale was added, the parent form (GRS 2 Parent Form) (Shaughnessy, 2022).
The GRS 2 parent form, the subject of this paper, is based on a multidimensional model of high abilities and consists of items that fall within three broad dimensions: cognitive abilities, creative and artistic abilities, and social-emotional skills. The items that make up this last dimension are new. The items belonging to the cognitive abilities (8 items) and creative and artistic abilities (8 items) dimensions were adapted from a subset of the items in the original teacher scales, GRS (Pfeiffer and Jarosewich, 2003). Only items reflecting behaviours or characteristics indicative of high ability and observable by a parent outside an educational setting were selected.
The development of the socio-emotional competence dimension was undertaken with the aim of broadening the assessment of the gifted beyond a traditional lens that focuses primarily on “head strengths” – which include problem solving, memory, reasoning and creativity – to a more holistic and comprehensive view of the student that includes “heart strengths” such as personal and interpersonal strengths (Pfeiffer, 2001, 2017b). Essentially, the purpose was to incorporate a positive psychology perspective into the GRS 2 parenting scale.
The structure of this scale in Spanish has not been studied so far. Precisely, the central aim of this validation work is to analyse the structure of this new scale for parents and to provide evidence on its validity.
The collaboration of the participants was sought through associations of parents with gifted children (58), other institutions and educational centres, who received a letter explaining the details of the scale and the characteristics of their collaboration. Participation was also requested through various social networks. In all cases collaboration was voluntary and anonymous. The scale was available for online response between April and October 2022.
The sample consisted of a total of 1334 fathers and mothers. After data filtering, the total number of valid responses was 1109; mothers contributed 977 (88.1%) and fathers 113 (10.2%). The remaining 19 cases did not record this information. 61% of them indicated that they were assessing sons and 39% daughters.
The average age of the children assessed by their parents is 10 years (SD= 3.5 years), with cases ranging from 4 to 18 years old. Among them, 55% were in Primary Education (1st-6th grades), 25% in Compulsory Secondary Education (7th-10th grades), 14% in Preschool Education and the remaining 6% in Baccalaureate (11th-12th grades). Table I shows the distribution of cases in the different courses in order of highest to lowest participation.
TABLE I. Frequencies and percentages of cases in the various courses
Course |
Frequencies |
% |
6th Grade |
111 |
10.0% |
4th Grade |
105 |
9.5% |
5th Grade |
103 |
9.3% |
1st Grade |
102 |
9.2% |
2nd Grade |
95 |
8.6% |
3rd Grade |
94 |
8.5% |
7th Grade |
88 |
7.9% |
8th Grade |
79 |
7.1% |
2nd Preschool |
65 |
5.9% |
9th Grade |
62 |
5.6% |
3rd Preschool |
59 |
5.3% |
10th Grade |
50 |
4.5% |
1st Preschool |
33 |
3.0% |
11th Grade |
32 |
2.9% |
12th Grade |
31 |
2.8% |
Naturally, this sample is not representative of all parents with gifted children; however, it should be noted that for the purpose of the study, which is to provide initial evidence of the validity and structure of the scale, a sample of adequate size and variance is sufficient.
The Gifted Rating Scales Second Edition (GRS 2) is a revision of the original GRS (Pfeiffer and Jarosewich, 2003), integrating the same key elements as its predecessor, but with some new features, including a parent form, which is the one studied here. This parent version of the GRS 2 provides information about the students and allows for scores based on behaviours observed in different contexts, which facilitates a more holistic view of the students' abilities.
The GRS 2 Parent Form is a questionnaire for parents of students aged 4-18 years. The inventory consists of a total of 20 items grouped into three dimensions, which are described below.
The dimensions of the scale and its component items are listed in Table II. Each item is rated on a 6-point Likert-type scale: (1) never, (2) sometimes, (3) somewhat often, (4) quite often, (5) almost always and (6) always, according to how parents rate the frequency with which they observe the behaviour indicated in each item (e.g. “Has an active imagination”).
TABLE II. Scale dimensions and items
Dimension |
Items |
Cognitive Ability |
I2, I3, I4, I13, I14, I17 |
Creative/Artistic Ability |
I7, I9, I10, I11, I12, I18, I20 |
Socio-Emotional Skills |
I1, I5, I6, I8, I15, I16, I19 |
The scales, originally in English, were translated independently by the first and third authors, experts in the field of high abilities. Said translations were compared with each other and no discrepancies were observed. Subsequently, the translation was revised by technical staff of the publisher to whom the rights to the scales currently belong (MHS). The authors' proposal was accepted unchanged.
Once the scale was available in Spanish, it was hosted on an online service (Survey Monkey) in order to make it accessible to respondents. The scale items were randomly arranged to avoid possible biases due to the original order of the scales, where items are presented grouped by dimensions (Bishop, 2008; Tourón et al., 2018).
Along with the previous instructions, other descriptive variables were included in the online response form, such as who answers the scale (parent/guardian/other); and with respect to the person assessed: gender, age, grade, performance, psycho-pedagogical evaluation and tests for which information on the child is available.
In order to test the structure of the scale, an exploratory and a confirmatory factor analysis were carried out to provide evidence of the validity of the scale.
To decide on the type of correlations to be used, the normality of the distribution of the responses to each item was tested using Shapiro Wilk's W statistic and the multivariate normality of the set of items was tested using Mardia's symmetry and kurtosis statistics.
On the other hand, a sample of more than 1000 cases, such as the one used in this study, can be considered sufficient. Gaskin and Happell (2014) recommend that, with approximately 6 items per factor, if factor weights of around .5 are obtained, a factor size of approximately 300 cases may be sufficient. With a smaller representation of items, the size should be higher; the same authors recommend about 1000 cases with models that include four items per factor.
The correlations between items are the fundamental information used in factor analysis. The current recommendation with ordinal items, as is the case here, is to use polychoric correlations (Izquierdo et al., 2014; Lloret-Segura et al., 2014). Although with Likert scales of more than 5 points and symmetrical distributions, Pearson's correlation could be used (Viladrich et al., 2017). The method of parameter estimation must also comply with this condition.
Firstly, with 40% of the sample, the structure of the correlations was studied using exploratory factor analysis (EFA) to obtain information on the optimal number of factors. The technique of parallel analysis was used, which estimates the eigenvalues that the factors would obtain by simulating one-dimensional results and compares them with the real data in a sedimentation plot. Secondly, with the rest of the sample, the confirmatory factor analysis (CFA) was carried out. The adequacy of the inter-item correlation matrix was tested using the KMO statistic and the Barlett test. In the first case, values of .8 or more are considered good and, in the second case, a significant result (p<.05). These statistics determine whether the size of the inter-item correlations is sufficient to carry out the factor analysis.
Weighted least squares estimation methods were used. And, in the case of CFA, its robust version (WLSM), one of the most recommended options with ordinal variables was used (Li, 2014 and Xia, 2016).
In the model evaluation phase, the standardized indices were used: χ2 normalized robust (χ2 /d.f.), to assess the overall fit, where values between 3 and 5 are considered acceptable; RMSEA, to assess the residual matrix, which is acceptable with values below .08; and the TLI (Tucker-Lewis Index), for comparative fit, which is acceptable at .90 and above. Following Hu and Bentler (1999), an acceptable fit in the combination of these indices is sufficient as evidence of validity. In addition, the GFI (Goodness of Fit Index) and the standardized root mean square error (SRMR) for the overall fit, as well as the CFI (Comparative Fit Index) for the comparative fit are added to the CFA. Modification rates were also calculated in this case.
The dimensionality of the construct is reinforced with the interpretation of the relationship between latent factors. Evidence of convergent validity is also provided through the analysis of factor weights, using the Average Variance Extracted, AVE, resulting from adding the standardized factor loadings (Pi) squared (equivalent to R2) and dividing by the total number of items of the dimension as indicated in formula (1).
In addition, the internal consistency of the dimensions is estimated by calculating the Composite Reliability (CR), based on the factor loadings and the error variance (ei) with the formula (2),
where the error variance of an item is the result of subtracting its squared factor loading from 1, as indicated in formula (3).
AVE values of .5 or more indicate that the factor explains 50% or more of the variability of the responses to its component items. Combining this statistic with composite reliability data above .7, convergent validity can be assumed. Information is also included on the explanatory power of the model based on the total variance explained by the set of factors and, in this case, values above 50% are sufficient. The original measurement model, as noted, includes three dimensions (Cognitive Ability, Creative/Artistic Ability and Socio-Emotional Skills). Nonetheless, 1-dimensional and 4-dimensional confirmatory models and some variations included in Table III have been tested, with a total of eight models being tested. Of these, model 4 correlates the errors of items I5 with I15 and I16 with I19; model 5, in addition to correlating these errors, changes item 17 from cognitive to creative ability factor; model 6 proposes a four-factor structure, changing the dimension of item 17; model 7 is similar to model 5 but with a second-order factor; and finally, model 8 proposes four first-order factors and two second-order factors.
TABLE III. Estimated confirmatory models
Model |
Structure |
Specification |
1 |
3 Factors |
Original model |
2 |
4 Factors |
The Socio-Emotional Skills factor is subdivided into two dimensions: Emotional control and Social skills |
3 |
1 Factor |
One unique dimension |
4 |
3 Modified A factors |
Original model allowing correlations between errors according to modification indexes |
5 |
3 Modified B factors |
Original model with correlation between errors and change of item 17 to the Creative dimension |
6 |
4 Modified A factors |
Like Model 2 and change item 17 to the Creative dimension |
7 |
3 Modified B factors |
Like Model 5 + 1 2nd Order Factors |
8 |
4 Modified A factors |
Like Model 6 + 2 2nd Order Factors |
Data analyses have been carried out with jamovi and various modules developed for it (Jamovi Project, 2022; R Core Team, 2021; Friesen et al., 2019; Gallucci and Jentschke, 2021; Rosseel, 2019; Jorgensen et al, 2019 and Epskamp et al. 2019).
The overall mean of the scale (6-point Likert) is 4.5 points (SD=1.22 points) and the median, on average, is 4.7 points. The lowest rated items are 5, 8 and 15 (“Handles stress well”; “Keeps working even when unsuccessful at first” and “Controls his/her anger”, respectively), all three with medians of 3 points. On the opposite side, with medians of 6 points, are items 2, 4 and 13 (“Learns things quickly”; “Has a great memory” and “Is quick to understand things”, respectively), which also have the lowest variability, with standard deviations of less than 1.
In addition, the correlation of each item with the rest is positive and with values varying between .4 and .7, with an average of .54. A result that indicates the uniformity of the set of items. Their descriptive statistics are shown in table IV.
TABLE IV. Descriptive statistics of the items
Item |
Mean |
Median |
SD |
Min. |
Max. |
Polyserial R |
I1 |
4.47 |
5 |
1.36 |
1 |
6 |
.491 |
I2 |
5.35 |
6 |
0.85 |
2 |
6 |
.561 |
I3 |
4.92 |
5 |
1.05 |
2 |
6 |
.546 |
I4 |
5.36 |
6 |
0.92 |
1 |
6 |
.480 |
I5 |
2.97 |
3 |
1.33 |
1 |
6 |
.439 |
I6 |
4.53 |
5 |
1.32 |
1 |
6 |
.554 |
I7 |
4.80 |
5 |
1.24 |
1 |
6 |
.590 |
I8 |
3.56 |
3 |
1.49 |
1 |
6 |
.553 |
I9 |
4.67 |
5 |
1.31 |
1 |
6 |
.655 |
I10 |
4.62 |
5 |
1.24 |
1 |
6 |
.690 |
I11 |
4.75 |
5 |
1.16 |
1 |
6 |
.659 |
I12 |
4.13 |
4 |
1.56 |
1 |
6 |
.562 |
I13 |
5.37 |
6 |
0.87 |
2 |
6 |
.536 |
I14 |
5.04 |
5 |
1.24 |
1 |
6 |
.431 |
I15 |
3.41 |
3 |
1.42 |
1 |
6 |
.447 |
I16 |
4.01 |
4 |
1.32 |
1 |
6 |
.568 |
I17 |
4.86 |
5 |
1.30 |
1 |
6 |
.489 |
I18 |
4.24 |
4 |
1.24 |
1 |
6 |
.633 |
I19 |
4.75 |
5 |
1.10 |
1 |
6 |
.419 |
I20 |
5.12 |
5 |
1.10 |
1 |
6 |
.615 |
The results of an analysis of the normality of the variables (items) with the Shapiro-Wilk W test have yielded statistical values of p<.001, in all cases, which leads us to reject the null hypothesis. On the other hand, the multivariate normality results for the assumptions of symmetry being distributed as χ2 (5754.06, p< .001) and kurtosis being normally distributed (42.47, p<.001), lead us to reject both assumptions.
Given the non-normality of the distribution of the responses, we decided to use the polychoric correlation matrix to carry out the factorial study, which was conducted in two stages.
First, the measures of sampling adequacy (KMO), with an average value of .87 (values above .80 are considered optimal) and a significant Bartlett's test of sphericity result, are indicators that the inter-item correlation values are adequate for the factorial study.
Secondly, the dimensionality results of the AFE indicate a 5-dimensional structure. However, as can be seen in the sedimentation graph of the parallel analysis shown in Figure I, the eigenvalue of the fifth factor is very close to the value of the one-dimensional model resulting from the simulations.
FIGURE I. Sedimentation graph with results of parallel analysis
In addition, the factor weights of the fifth factor are from two items (7: “Is creative” and 17: “Gives a lot of detail when explaining things”), which also have a larger load on another factor. On the other hand, the results of the factor weights and the calculated AVE and composite reliability indices show an optimal 4-factor fit (see Table V). Dimension five achieves an AVE of 0.45 and a reliability close to 0.4.
TABLE V. AVE indices and composite reliability of the four-factor model
Factors |
AVE |
FC |
F1 |
0.705 |
0.836 |
F2 |
0.703 |
0.895 |
F3 |
0.652 |
0.750 |
F4 |
0.667 |
0.719 |
Further evidence in favour of the 4-factor model is its explanatory power. Approximately 60% of the variability in the data is reproduced by it, while the 3-factor model accounts for 54.6%. The fifth factor contributes less than 3% of explained variance. Consequently, the 4-factor model improves the explanation of the items that are located in the fourth factor.
The fit indices of the models estimated in the exploratory study are shown in table VI.
TABLE VI. Exploratory Factor Analysis (EFA) fit indices
Indexes |
5 factors |
4 factors |
3 factors |
χ2 |
964,885 |
1347.888 |
1894.254 |
gl |
100 |
116 |
133 |
p |
<.001 |
<.001 |
<.001 |
χ2/df |
9,649 |
11,620 |
14,243 |
RMSEA |
.088 |
.098 |
.109 |
RMSEA (LI) |
.083 |
.105 |
.105 |
RMSEA (LS) |
.093 |
.114 |
.114 |
TLI |
.877 |
.849 |
.812 |
Although the results of these indices do not show acceptable values, they seem to improve as the number of factors increases. Considering the evidence of the variability explained by the factors, the factor weights of the items that compose them and the AVE and composite reliability statistics, a 4-dimensional structure would be the one recommended by the EFA.
The items that make up the factors, as a result of the EFA, maintain the original structure, with the only variation being item 17 (“Gives a lot of details when explaining things”), which changes from the Cognitive Ability dimension to the Creative/Artistic Ability one. This is the only difference between the original and the three-factor model.
The four-factor model separates the Socio-Emotional Skills into two sub-dimensions, to place items 5, 8 and 15 in one of them, which, let us recall, are the lowest scoring items of the scale and refer to stress management, anger and perseverance at work. We have named this sub-dimension, “Emotional Control”. The other sub-dimension groups together items 1, 6, 16 and 19, which, because of their content, we have called “Social Skills”. These two dimensions, in the original design of the scale, are grouped in the factor that the authors call Socio-Emotional Skills (see table VII).
TABLE VII. Structure of the four-factor EFA model
Factors |
Items |
Cognitive Ability |
I2, I3, I4, I13, I14 |
Creative/Artistic Ability |
I7, I9, I10, I11, I12, I17, I18, I20 |
Social Skills |
I1, I6, I16, I19 |
Emotional Control |
I5, I8, I15 |
The correlations between the factors, which can be seen in table VIII, show a higher average correlation between Cognitive and Creative/Artistic Abilities on the one hand, and Social and Emotional Skills on the other. The values are not large enough to be considered a single dimension, although they could be explained by second-order common factors. Hypothesis that is tested in the confirmatory stage of the model.
TABLE VIII. Correlations between the factors based on the EFA
|
Cognitive Ability |
Creative/Artistic Ability |
Social Skills |
Emotional Control |
Cognitive Ability |
1 |
|
|
|
Creative/Artistic Ability |
0.472 |
1 |
|
|
Social Skills |
0.392 |
0.385 |
1 |
|
Emotional Control |
0.268 |
0.136 |
0.552 |
1 |
Taking into account the results of the EFA, eight confirmatory models were tested in the second stage (see table III), two of them with second-order factors. The fit values for each of the models tested are presented in table IX.
TABLE IX. Fit indices of models tested in the CFA
Indexes |
M1 |
M2 |
M3 |
M4 |
M5 |
M6 |
M7 |
M8 |
χ2 |
2048 |
1740 |
6833 |
1726 |
1457 |
1596 |
1457 |
1601 |
gl |
167 |
164 |
170 |
165 |
167 |
164 |
165 |
165 |
p |
<.001 |
<.001 |
<.001 |
<.001 |
<.001 |
<.001 |
<.001 |
<.001 |
χ2/gl |
12,263 |
10,610 |
40,194 |
10,461 |
8,725 |
9,732 |
8,830 |
9,703 |
SRMR |
.086 |
.078 |
.154 |
.075 |
.071 |
.074 |
.075 |
.074 |
RMSEA |
.101 |
.093 |
.189 |
.089 |
.084 |
.089 |
.084 |
.089 |
RMSEA (LI) |
.097 |
.089 |
.202 |
.085 |
.080 |
.085 |
.080 |
.085 |
RMSEA (LS) |
.105 |
.097 |
.209 |
.093 |
.088 |
.093 |
.088 |
.090 |
CFI |
.968 |
.974 |
.867 |
.976 |
.978 |
.976 |
.978 |
.976 |
TLI |
.964 |
.969 |
.851 |
.972 |
.975 |
.972 |
.975 |
.972 |
GFI |
.978 |
.981 |
.910 |
.983 |
.984 |
.983 |
.984 |
.983 |
The M1 is the three-factor model (scale’s original), where the first factor is Cognitive Ability, the second Creative/Artistic and the third Socio-Emotional Skills. The comparative fit indices (CFI and TLI) achieve good values (>.95). The Goodness of Fit Index (GFI) also points in this direction. In contrast, the residual-based indices (SRMR and RMSEA) slightly exceed acceptable values, exceeding .08. The modification indices suggested an improvement in the fit if the correlations between the residuals of the two groups of items of the Socio-Emotional Skills factor (5, 8 and 15 on the one hand, and 1, 6, 16 and 19 on the other) are included. This result is further evidence, as already pointed out by the EFA, of the existence of two factors explaining the responses to the Socio-Emotional Skills items.
The M2 tested the grouping of the items into four factors, separating the socio-emotional skills. As can be seen in Table IX, the values of the fit indices improve. Residue rates decrease and there is also a reduction in χ2 values. And the values of the CFI, TLI and GFI indexes increase.
Subsequently, the M3 tested a unidimensional structure of the construct and, as can be seen, the fit indices worsen considerably.
The M4 and M5 are models with slight variations on the M1. The first includes correlations between the residuals of items 5 and 15 and between 16 and 19, and the second, additionally, shifts item 17 from the cognitive factor to the creative factor. Correlating the residuals assumes the existence of another factor that determines part of the variability of the responses to these items and, as the fit indices show, the results are similar to M2. In addition, changing factor item 17 also produces a slight improvement in the fit values.
The M6 is equivalent to the M2, but by changing item 17 to another dimension and, as with the three-factor models (M5), the fit improves slightly.
Finally, models M7 and M8 include second-order factors considering three and four factors, respectively. M7 links the Cognitive and Creative/Artistic Ability factors and M8 links those two as well as the two Socio-Emotional Skills factors. And, as Table IX shows, the adjustments are roughly equivalent.
The Convergent Validity (Average Variance Explained, AVE) and Composite Reliability presented in Table X show better results in the four-factor models (M2, M6 and M8) with AVE of the Socio-Emotional Skills factors (Factor 3 and Factor 4) with values above .5. In contrast, in the three-factor models (M1, M4, M5 and M7), the Socio-Emotional Skills factor (Factor 3) explains only 40% of the variability.
TABLE X. Evidence of Convergent Validity and Composite Reliability
Average Variance Explained (AVE) |
||||||||
|
M1 |
M2 |
M3 |
M4 |
M5 |
M6 |
M7 |
M8 |
Factor 1 |
.531 |
.531 |
.376 |
.531 |
.595 |
.595 |
.595 |
.595 |
Factor 2 |
.650 |
.649 |
|
.650 |
.598 |
.598 |
.598 |
.598 |
Factor 3 |
.403 |
.536 |
|
.403 |
.403 |
.536 |
.403 |
.536 |
Factor 4 |
|
.544 |
|
|
|
.545 |
|
.545 |
Total |
.528 |
.565 |
|
.528 |
.532 |
.568 |
.532 |
.568 |
Composite Reliability |
||||||||
Factor 1 |
.868 |
.868 |
.918 |
.868 |
.878 |
.877 |
.878 |
.877 |
Factor 2 |
.927 |
.927 |
|
.927 |
.920 |
.920 |
.920 |
.920 |
Factor 3 |
.823 |
.821 |
|
.823 |
.823 |
.820 |
.815 |
.821 |
Factor 4 |
|
.781 |
|
|
|
.782 |
|
.782 |
The composite reliability values can be considered acceptable in all cases (>.7). The best internal consistency of the items is found in Factor 2 (Creative/Artistic Ability), which achieves reliability values above .9.
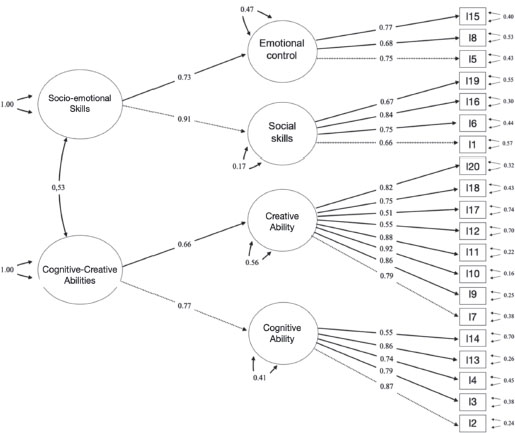
The CFA results indicate that the best models, considering the fit values, are M6 and M8. M8 was chosen as the model that best represents the structure of relationships that occur between the items of the construct and allows the scores of the four primary factors and the two second-order dimensions to be used. Table XI includes the factor weights achieved with this model and the proportion of variance explained (R2).
TABLE XI. Factor weights (b), R2 and residuals of the items and 2nd order factors of Model 8
Dimensions |
Items |
b |
R2 |
Error |
Cognitive Ability |
I2 |
.873 |
.762 |
.238 |
I3 |
.787 |
.619 |
.381 |
|
I4 |
.744 |
.554 |
.446 |
|
I13 |
.861 |
.741 |
.259 |
|
I14 |
.545 |
.297 |
.703 |
|
Creative/Artistic Ability |
I7 |
.786 |
.618 |
.382 |
I9 |
.865 |
.748 |
.252 |
|
I10 |
.919 |
.845 |
.155 |
|
I11 |
.883 |
.780 |
.220 |
|
I12 |
.546 |
.298 |
.702 |
|
I17 |
.505 |
.255 |
.745 |
|
I18 |
.752 |
.566 |
.434 |
|
I20 |
.822 |
.676 |
.324 |
|
Social Skills |
I1 |
.657 |
.432 |
.568 |
I6 |
.751 |
.564 |
.436 |
|
I16 |
.838 |
.702 |
.298 |
|
I19 |
.668 |
.446 |
.554 |
|
Emotional Control |
I5 |
.752 |
.566 |
.434 |
I8 |
.684 |
.468 |
.532 |
|
I15 |
.775 |
.601 |
.399 |
|
2nd order Factors |
Dimensions |
b |
R2 |
Error |
Cognitive-Creative Ability |
Cognitive |
.767 |
.588 |
.412 |
|
Creative |
.662 |
.438 |
.562 |
Socio-Emotional Skills |
Social Skills |
.913 |
.834 |
.166 |
Emotional Control |
.727 |
.529 |
.471 |
The factor weights of the items in M8, for the first order factors, are all above .5. The most representative ones are item 2 (b=.873; R2=.762) in the Cognitive Ability factor, item 10 in Creative/Artistic Ability (b=.919; R2=.845), item 16 in Social Abilities (b=.838; R2=.702), and item 15 in Emotional Control (b=.775; R2=.601). In fact, 70% of the factor weights (b) are above .70 and 30% of them are between .50 and .69.
The second-order factors also explain more than 50% of the variability of the scores; specifically, 51.3% in the case of the Cognitive-Creative factor and 68.1% in the Socio-Emotional Skills factor, which reinforces the superiority of this model over the others.
Finally, the plot of the effects between factors and items of M8 is shown in Figure II.
FIGURE II. Diagram of observed, latent variables and effects in the M8
This is the first study carried out on the factor structure of this instrument in Spanish. The only reference for assessing the results obtained is the original structure of the scale, organized in three dimensions as explained above.
After testing several models and considering the above fit and error indices, we have found that a first-order four-factor structure is the most suitable. This structure involves dividing the original Socio-Emotional Skills dimension into two parts, which we have named based on the content of the items included: Social Skills and Emotional Control. Thus, we would have a four-factor structure instead of a three-factor structure. Further analysis has led us to verify that the fit to the sample data improves when considering, in addition, two second-order factors that group cognitive and creative artistic abilities, on the one hand, and the other factor that groups the social and emotional control dimensions, which we call Socio-Emotional Skills (Model 8).
From a practical point of view, this division of the Socio-Emotional Skills dimension into two components (Social Skills and Emotional Control) may refine the assessment of the candidates' profile by distinguishing these two sub-dimensions (factors), although the proposed measurement model would also allow for the integration of the two dimensions in case homogeneous scores are obtained in both and one does not mask the other.
The need and desirability of including parents as a source of information in the process of identifying and assessing gifted students, which can be triangulated with other data sources, has been highlighted by several authors (Nicpon and Pfeiffer, 2011; Pfeiffer, 2015b), and the lack of instruments has been seen as a gap in this field. On the other hand, parents can provide relevant data from contexts other than school, in particular from the socio-emotional domain.
This dimension reflects what Pfeiffer (2001, 2017b) has called the “strengths of the heart”, which go beyond cognitive variables. In fact, other authors have highlighted the importance of determination, courage, hard work, etc. as essential dimensions in talent development (Duckworth, 2016; Pfeiffer, 2013; Subotnik et al., 2021; Olszewski-Kubilius et al., 2015, 2019).
Pfeiffer (2015b) notes that some authors argue that parents' assessments may be biased in their perceptions of their children's skills and abilities; however, research indicates that identification systems that include parental nominations improve and prevent large numbers of gifted students from going unidentified (McBee et al., 2016). In fact, there are studies that show the validity of parental assessments and their correlation with measures of aptitude and performance (Lee and Olszewski-Kubilius, 2006), and numerous authors recommend including these assessments in a process of global screening that, together with those from teachers, allow us to learn about aspects of students not covered by intelligence and aptitude tests (Pfeiffer, 2017a).
For all these reasons, it is of the utmost importance to have properly validated instruments, such as the one presented here, so that they can be used in educational practice.
This work is certainly a preliminary validation that will require further confirmatory studies, both with Spanish samples and comparative studies with other similar investigations carried out in different cultural contexts.
The official figures for students identified as having high intellectual ability in Spain are quite concerning, as they indicate that nearly 98% of students go undetected (Tourón, 2020). In light of this, the availability of adequately validated instruments is particularly relevant.
This work will be completed with the validation of the other two teacher scales that make up GRS 2, which is being carried out by the authors. This will represent a significant advance in the use of useful tools for the identification of students' potential.
This research was supported by the Research Vice-rectorate of Universidad Internacional de La Rioja.
We acknowledge with appreciation the support of Professor Steven Pfeiffer, who provided us with items from the developmental version of the GRS-2 for this study.
Abdulla, A. M., & Cramond, B. (2017). After Six Decades of Systematic Study of Creativity: What do Teachers Need to Know About What it is and How it is Measured? Roeper Review, 39(1), 9–23.
Beghetto, R. A., & Plucker, J. A. (2016). Revisiting the Relationship Among Schooling, Learning, and Creativity. In J. C. Kaufman & J. Baer (Eds.), Creativity and Reason in Cognitive Development (pp. 72–91). Cambridge University Press. https://doi.org/10.1017/CBO9781139941969.005
Bishop, G. F. (2008). Item Order Randomization. In P. J. Lavrakas, Encyclopedia of Survey Research Methods (p. 397). SAGE.
Cropley, A. J. (2000). Defining and Measuring Creativity: Are Creativity Tests Worth Using? Roeper Review, 23(2), 72–79.
Cropley, A. J., & Urban, K. K. (2000). Programs and Strategies for Nurturing Creativity. In K. A. Heller, F. J. Mönks, R. Subotnik, Robert Sternberg (Eds.), International Handbook of Giftedness and Talent (2nd ed., pp. 485–498). Pergamon Press.
Csikszentmihalyi, M., & Wolfe, R. (2000). New Conceptions and Research Approaches to Creativity: Implications of a Systems Perspective for Creativity in Education. In K. A. Heller, F. J. Mönks, R. Subotnik, Robert Sternberg (Eds.), International Handbook of Giftedness and Talent (2nd ed., pp. 81–93). Pergamon Press.
Dai, D. Y. (2018). A History of Giftedness: Paradigms and Paradoxes. In S. I. Pfeiffer (Ed.), Handbook of Giftedness in Children (2nd. ed., pp. 1–14). Springer. https://doi.org/10.1007/978-3-319-77004-8_1
Duckworth, A. (2016). Grit: The Power of Passion and Perseverance. Scribner/Simon & Schuster.
Durlak, J. A., Weissberg, R. P., Dymnicki, A. B., Taylor, R. D., & Schellinger, K. B. (2011). The Impact of Enhancing Students' Social and Emotional Learning: A Meta-Analysis of School-Based Universal Interventions. Child Development, 82(1), 405–432.
Epskamp S., Stuber S., Nak J., Veenman M, Jorgensen T. D. (2019). semPlot: Path Diagrams and Visual Analysis of Various SEM Packages' Output. [R Package]. Retrieved from https://CRAN.R-project.org/package=semPlot
Friesen, L., Kroc, E., Zumbo, B. D. (2019). Psychometrics & Post-Data Analysis: Non-Parametric Item Response Theory. [jamovi module]. Retrieved from https://github.com/lucasjfriesen/jamoviPsychoPDA
Gagné, F. (1993). Constructs and Models Pertaining to Exceptional Human Abilities. In K. A. Heller, F. J. Mönks, & A. H. Passow (Eds.), International Handbook of Research and Development of Giftedness and Talent (pp. 69–87). Pergamon Press.
Gagné, F. (2015). From Genes to Talent: The DMGT/CMTD Perspective. Revista de Educación, 368, 66–91. https://doi.org/10.4438/1988-592X-RE-2015-368-289
Gagné, F. (2018). Academic Talent Development: Theory and Best Practices. In S. I. Pfeiffer, E. Shaunessy-Dedrick, & M. Foley-Nicpon (Eds.), APA Handbook of Giftedness and Talent (pp. 163–183). American Psychological Association. https://doi.org/10.1037/0000038-011
Gagné, F. (2021). The Differentiating Model of Giftedness and Talent. In T. L. Cross & J. R. Cross (Eds.), Handbook for Counselors Serving Students with Gifts and Talents: Development, Relationships, School Issues, and Counseling Needs/Interventions (2nd ed., pp. 9–28). Routledge. https://doi.org/10.4324/9781003235415-3
Gallucci, M., Jentschke, S. (2021). SEMLj: jamovi SEM Analysis. [jamovi module]. https://semlj.github.io/.
Galton, F. (1869). Hereditary Genius: An Inquiry Into its Laws and Consequences. Macmillan and Co.
Gaskin, C. J., & Happell, B. (2014). On Exploratory Factor Analysis: A Review of Recent Evidence and Assessment of Current Practice, and Recommendations for Future Use. International Journal of Nursing Studies, 51(3), 511–521.
Getzels, J. W., & Jackson, P. W. (1962). Creativity and Intelligence: Explorations with Gifted Students. Wiley.
Hargreaves, A. (1996). Revisiting Voice. Educational Researcher, 25(1), 12–19.
Haroutounian, J. (1995). Talent Identification and Development in the Arts: An Artistic/Educational Dialogue. Roeper Review, 18(2), 112–117.
Haroutounian, J. (2002). Kindling the Spark: Recognizing and Developing Musical Talent. Oxford University Press on Demand.
Hu, L. T., & Bentler, P. M. (1999). Cutoff Criteria for Fit Indexes in Covariance Structure Analysis: Conventional Criteria versus New Alternatives. Structural Equation Modeling, 6(1), 1–55. https://doi.org/10.1080/10705519909540118
Isaksen, S. G., Puccio, G. J., & Treffinger, D. J. (1993). An Ecological Approach to Creativity Research: Profiling for Creative Problem Solving. The Journal of Creative Behavior, 27(3), 149–170. https://doi.org/10.1002/j.2162-6057.1993.tb00704.x
Izquierdo, I., Olea, J., & Abad, F. J. (2014). El análisis factorial exploratorio en estudios de validación: Usos y recomendaciones [Exploratory Factor Analysis in Validation Studies: Uses and Recommendations]. Psicothema, 26(3), 395–400.
Jamovi Project, The (2022). jamovi. (Version 2.3) [Computer Software]. Retrieved from https://www.jamovi.org
Jarosewich, T., Pfeiffer, S. I., & Morris, J. (2002). Identifying Gifted Students Using Teacher Rating Scales: A Review of Existing Instruments. Journal of Psychoeducational Assessment, 20(4), 322–336.
Jorgensen, T. D., Pornprasertmanit, S., Schoemann, A. M., Rosseel, Y., Miller, P., Quick, C., Garnier-Villarreal, M., Selig, J., Boulton, A., Preacher, K., Coffman, D., Rhemtulla, M., Robitzsch, A., Enders, C., Arslan, R., Clinton, B., Panko, P., Merkle, E., Chesnut, S., Byrnes, J., Rights, J. D., Longo, Y., Mansolf, M., Ben-Shachar, M. S., Rönkkö, M. (2019). semTools: Useful Tools for Structural Equation Modeling. [R Package]. Retrieved from https://CRAN.R-project.org/package=semTools
Lee, S. Y. & Olszewski-Kubilius, P. (2006). Comparison Between Talent Search Students Qualifying via Scores on Standardized Tests and via Parent Nomination. Roeper Review, 28, 157–166.
Li, Ch.-H. (2014). The Performance of MLR, USLMV, AND WLSMV Estimation in Structural Regression Models with Ordinal Variables. Doctoral Dissertation. Michigan State University.
Lloret-Segura, S., Ferreres-Traver, A., Hernández-Baeza, A., & Tomás-Marco, I. (2014). El análisis factorial exploratorio de los ítems: una guía práctica, revisada y actualizada. [Exploratory Item Factor Analysis: a practical guide revised and updated], Anales de Psicología/Annals of Psychology, 30(3), 1151–1169.
McBee, M. T., Peters, S. J., & Miller, E. M. (2016). The Impact of the Nomination Stage on Gifted Program Identification: A Comprehensive Psychometric Analysis. Gifted Child Quarterly, 60(4), 258–278. https://doi.org/10.1177/0016986216656256
Neihart, M., Pfeiffer, S., & Cross, T. (2016). The Social and Emotional Development of Gifted Children: What Do We Know? (2nd ed.). Prufrock.
Nicpon, M. F., & Pfeiffer, S. I. (2011). High-Ability Students: New Ways to Conceptualize Giftedness and Provide Psychological Services in the Schools. Journal of Applied School Psychology, 27(4), 293–305.
Olszewski-Kubilius, P., Subotnik, R. & Worrell, F. C. (2015). Re- pensando las altas capacidades: una aproximación evolutiva. [Re-Thinking Giftedness: A Developmental Approach]. Revista de Educación, 368, 40–65. https://doi.org/10.4438/1988-592X-RE-2015-368-297
Olszewski-Kubilius, P., Worrell, F. C., Subotnik, R. F., & Foley-Nicpon, M. (2019). Reflections on Talent Development in Academics. In R. F. Subotnik, P. Olszewski-Kubilius, & F. C. Worrell (Eds.), The Psychology of High Performance: Developing Human Potential into Domain-Specific Talent (pp. 225–236). American Psychological Association. https://doi.org/10.1037/0000120-011
Pfeiffer, S. I. (2001). Professional Psychology and the Gifted: Emerging Practice Opportunities. Professional Psychology: Research and Practice, 32(2), 175.
Pfeiffer, S. I. (2013). Lessons Learned from Working with High-Ability Students. Gifted Education International, 29(1), 86–97.
Pfeiffer, S. I. (2015a). Tripartite Model of Giftedness and Best Practices in Gifted Assessment. Revista de Educación, 368, 66–95. DOI: https://doi.org/10.4438/1988-592X-RE-2015-368-293
Pfeiffer, S. I. (2015b). Essentials of Gifted Assessment. John Wiley & Sons.
Pfeiffer, S. I. (2017a). Identificación y evaluación del alumnado con altas capacidades: Una guía práctica. [Identification and Evaluation of High Ability Students: A Practical Guide]. UNIR Editorial.
Pfeiffer, S. I. (2017b). Success in the Classroom and in Life: Focusing on Strengths of the Head and Strengths of the Heart. Gifted Education International, 33(2), 95–101.
Pfeiffer, S. I. (2018). Giftedness and Talent Development in Children and Youth. In P. Ward, J. M. Schraagen, J. Gore, & E. M. Roth (Eds.), The Oxford Handbook of Expertise (pp. 103–127). https://doi.org/10.1093/oxfordhb/9780198795872.013.5
Pfeiffer, S. I., & Blei, S. (2008). Gifted Identification Beyond the IQ test: Rating Scales and Other Assessment procedures. In S. I. Pfeiffer (Ed.), Handbook of Giftedness in Children: Psychoeducational Theory, Research, and Best Practices (pp. 177–198). Springer Science. https://doi.org/10.1007/978-0-387-74401-8_10
Pfeiffer, S. I., & Jarosewich, T. (2003). GRS: Gifted Rating Scales. Psychological Corporation.
Plucker, J.A., Guo, J., & Makel, M. C. (2018). Creativity. In S. I. Pfeiffer (Ed.), Handbook of Giftedness in Children (pp. 81–99). Springer. https://doi.org/10.1007/978-3-319-77004-8_6
Plucker, J. A., & Runco, M. A. (1998). The Death of Creativity Measurement Has Been Greatly Exaggerated: Current Issues, Recent Advances, and Future Directions in Creativity Assessment. Roeper Review, 21(1), 36–39.
Porath, M. (1993). Gifted Young Artists: Developmental and Individual Differences. Roeper Review, 16(1), 29–33.
Presbury, J. H., Benson, A. J. & Torrance, E. P. (1997). Creativity. In G. G. Bear, K. M. Minke, & A. Thomas (Eds.), Children’s needs II: Development, Problems and Alternatives (pp. 449–456). National Association of School Psychologists.
R Core Team (2021). R: A Language and environment for statistical computing. (Version 4.1) [Computer software]. https://cran.r-project.org. (R packages retrieved from MRAN snapshot 2022-01-01).
Renzulli, J. S. (2016). The Three-Ring Conception of Giftedness. In J. Renzulli, S. M. Reis, Reflections on Gifted Education: Critical Works by Joseph S. Renzulli and Colleagues (pp. 55–90). Prufrock. https://doi.org/10.4324/9781003237693-5
Renzulli, J. S. (2021). Intelligences Outside the Normal Curve: Co-Cognitive Factors That Contribute to the Creation of Social Capital and Leadership Skills in Young People. In J. Renzulli, S. M. Reis, Reflections on Gifted Education: Critical Works by Joseph S. Renzulli and Colleagues (pp. 129–150). https://doi.org/10.4324/9781003237693-5
Renzulli, J. S., & Delcourt, M. A. B. (2017). Gifted Behaviors versus Gifted Individuals. In C. M. Callahan, H. L. Hertberg-Davis, Fundamentals of Gifted Education (pp. 42–54). Routledge. https://doi.org/10.4324/9781315639987-5
Renzulli, J. S., & Gaesser, A. H. (2015). A Multi Criteria System for the Identification of High Achieving and Creative/Productive Giftedness. Revista de Educación, 368, 96–131. https://doi.org/10.4438/1988-592X-RE-2015-368-290
Renzulli, J. S., Hartment, R., & Callahan, C. (2001). Escalas de Renzulli (SCRBSS): Escalas para la valoración de las características de comportamiento de los estudiantes superiores [Scales for Rating the Behavioral Characteristics of Superior Students]. Amarú Ediciones.
Renzulli, J. S., & Reis, S. M. (2018). The Three-Ring Conception of Giftedness: A Developmental Approach for Promoting Creative Productivity in Young People. In S. I. Pfeiffer, E. Shaunessy-Dedrick, & M. Foley-Nicpon (Eds.), APA Handbook of Giftedness and Talent (pp. 185–199). American Psychological Association. https://doi.org/10.1037/0000038-012
Renzulli, J. S., & Reis, S. M. (2021). The Three Ring Conception of Giftedness: A Change in Direction from Being Gifted to the Development of Gifted Behaviors. In R. J. Sternberg & Ambrose, D. (Eds.), Conceptions of Giftedness and Talent (pp. 335–355). Palgrave Macmillan. https://doi.org/10.1007/978-3-030-56869-6_19
Rogers, K. B. (2002). Re-forming Gifted Education: Matching the Program to the Child. Great Potential Press, Inc.
Rosseel, Y. (2019). lavaan: An R Package for Structural Equation Modeling. Journal of Statistical Software, 48(2), 1–36. DOI: https://doi.org/10.18637/jss.v048.i02
Runco, M. A. (2014). “Big C, Little c” Creativity as a False Dichotomy: Reality is not Categorical. Creativity Research Journal, 26(1), 131–132.
Shaughnessy, M. F. (2022). An Interview with Steven I. Pfeiffer: Gifted Rating Scales-(GRS [TM] 2). North American Journal of Psychology, 24(1), 1–1.
Sternberg, R. J. (1985). Implicit Theories of Intelligence, Creativity, and Wisdom. Journal of Personality and Social Psychology, 49(3), 607.
Subotnik, R. F., Olszewski-Kubilius, P., & Worrell, F. C. (2021). Unlocking Creative Productivity: A Talent Development Approach. Journal of Modern Foreign Psychology, 10(4). https://doi.org/10.17759/jmfp.2021100402
Terman, L. M. (1925). Mental and Physical Traits of a Thousand Gifted Children. Genetic Studies of Genius. Volume 1. Stanford University Press.
Tourón, J. (2012). Los cuestionarios de Rogers para la nominación de los más capaces. Padres y Profesores [Rogers Questionnaires for Parent and Teacher Gifted Nominations]. https://www.javiertouron.es/los-cuestionarios-de-rogers-para-la
Tourón, J. (2020). Las altas capacidades en el sistema educativo español: reflexiones sobre el concepto y la identificación [Gifted Students in the Spanish Education System: Reflections on Conceptualization and Identification Issues]. Revista de Investigación Educativa, 38(1), 15–32.
Tourón, J., Martín, D., Navarro Asensio, E., Pradas, S. e Íñigo, V. (2018). Validación de constructo de un instrumento para medir la competencia digital docente de los profesores (CDD) [Construct validation of a questionnaire to measure teachers’ digital competence (TDC)]. Revista Española de Pedagogía, 76(269), 2554. https://doi.org/10.22550/REP761201802
Viladrich, C., Angulo-Brunet, A., & Doval, E. (2017). A Journey Around Alpha and Omega to Estimate Internal Consistency Reliability. Annals of Psychology, 33(3), 755–782. https://doi.org/10.6018/analesps.33.3.268401
Worrell, F. C., Subotnik, R. F., Olszewski-Kubilius, P., & Dixson, D. D. (2019). Gifted Students. Annual Review of Psychology, 70, 551–576.
Xia, Y. (2016). Investigating the Chi-square Based Model-fit Indexes for WLSMV and ULSMV Estimators (Dissertation). Florida State University. http://purl.flvc.org/fsu/fd/FSU_2016SU_Xia_fsu_0071E_13379
Contact address: Marta Tourón. Universidad Internacional de La Rioja – UNIR, Avd. de La Paz, 137. 26006 Logroño La Rioja, Spain. E-mail: marta.tporto@unir.net