FIGURE I. Comparison of simulator, dyslexia and control groups on measures of reading, writing, verbal fluency and composite variables
Note: Typified scores (z)
Source: Cervera-Mérida, Pellicer-Magraner and Ygual-Fernández. Compiled by the authors.
https://doi.org/10.4438/1988-592X-RE-2024-404-623
José Francisco Cervera-Mérida
https://orcid.org/0000-0002-9345-0929
Universidad Católica de Valencia San Vicente Mártir
Ana Pellicer-Magraner
https://orcid.org/0000-0002-9664-7858
Universidad Católica de Valencia San Vicente Mártir
Amparo Ygual-Fernández
https://orcid.org/0000-0002-9785-7689
Universitat de València
Abstract
Disability pretence increases when compensatory aids are provided by the education and health systems. Although tests are available to assess dyslexia, direct observation is not sufficient to detect deceptive behaviour. In order to protect people with this learning disability, it is necessary to use specific strategies to detect deception when in doubt. This research looks for reliable indicators to ensure that the person has dyslexia or is faking it. 30 people with dyslexia, 30 simulators and 30 controls participated. A set of paired experimental tasks was applied: in one of them, people with dyslexia had difficulties and in the other they did not. Simulators tended to generalise a pattern of exaggeration across all tests, whereas people with dyslexia responded differentially to tasks that related to the neuropsychological characteristics of their disorder and other tasks free of that influence. A set of five indicators - text reading, pseudoword copying, and the effects of frequency, articulatory suppression and phonemic cueing - allow the detection of fraud with sensitivity and specificity rates above 90%.
Keywords: dyslexia, higher education, symptom simulation, deception detection, cut-off points.
Resumen
El fingimiento de la discapacidad aumenta cuando los sistemas educativos y sanitarios proporcionan ayudas compensatorias. Aunque contamos con pruebas para evaluar la dislexia, la observación directa no es suficiente para detectar conductas de engaño. Para proteger a las personas que padecen esta dificultad de aprendizaje es necesario usar estrategias específicas de detección de la simulación en caso de duda. Esta investigación busca indicadores fiables que permitan asegurar que la persona tiene dislexia o la finge. METODOLOGÍA: Participaron 30 personas con dislexia, 30 simuladores y 30 controles. Se aplicó un conjunto de tareas experimentales emparejadas: en una de ellas, las personas con dislexia tenían dificultades y en la otra no. RESULTADOS: Los simuladores tienden a generalizar un patrón de exageración en todas las pruebas, mientras que las personas con dislexia responden de forma diferencial ante tareas que se relacionan con las características neuropsicológicas de su trastorno y otras tareas libres de esa influencia. DISCUSIÓN Y CONCLUSIONES: un conjunto de cinco indicadores -lectura de textos, copia de pseudopalabras, y los efectos de la frecuencia, la supresión articulatoria y el indicador fonémico- permiten la detección del fraude con índices de sensibilidad y especificidad superiores al 90%.
Palabras clave: dislexia, educación superior, simulación de síntomas, detección de engaño, puntos de corte.
There is historical evidence that the simulation of disability symptoms is enhanced when health and education systems provide protection and compensatory measures (Harrison et al., 2010; Hurtubise et al., 2017; Loser, 2013). Many education systems grant privileges to people with dyslexia for access to and progression in university studies. We have evidence that the number of these students reaching higher education is increasing and the heterogeneity among them is very large (Rice & Brooks, 2004), and that teachers who are instructed to provide the stipulated supports do not always know how to do so and sometimes have doubts about whether they are fair, proportionate and effective (Ryder & Norwich, 2019). The diagnosis of dyslexia is mainly made on the basis of performance on standardised reading and writing tests because, although it is true that some markers have been found that are related to its neurobiological origin (Doust et al., 2022; Formoso et al., 2021; Gertsovski & Ahissar, 2022), these have not yet been incorporated into the clinical diagnosis which is still made on the basis of the criteria established in the DSM-5 (American Psychiatric Association, 2013). These conditions are fertile ground for fraud to occur, although few studies have estimated it (Harrison et al., 2008; Morgan & Sweet, 2009; Sullivan et al., 2007; Van den Boer et al., 2018). Its detection is not automatic with standard assessment procedures (González Ordi et al., 2012) and direct observation is not sufficient to reveal simulators (Sweet, 1999).
In general, in order to discover feigning behaviour, it is necessary to converge clinical, psychological, neuropsychological and specific tests to detect fraud. The application of self-report-based simulation detection tests, such as the Victoria Symptom Validity Test or the Validity Symptom Test, have demonstrated sensitivity and specificity in adults with specific learning difficulties (Frazier et al., 2008; Giménez et al., 2015), but have several drawbacks: they may be too obvious, are easily available on the internet and do not include the specific symptoms of people who actually suffer from these difficulties. Another alternative is to use specific and sensitive indicators of pretend dyslexia in reading and writing tests, which reveal the pretending without the person being aware of it. These have been less studied, but have several advantages: people who seek information to simulate symptoms often do not understand how they work and have been shown to be resistant to training (Lindstrom et al., 2011). The study by Lindstrom et al. (2011) was based on an analysis of the performance of one group of participants with dyslexia and another group of people trying to simulate the symptoms in ordinary tests of written language proficiency. It was concluded that the simulators were able to cheat on most measures of reading and writing performance, but not on measures of neuro-linguistic processing, speed and number of errors in reading texts. Harrison et al. (2008) developed two instruments called the Dyslexia Assessment of Simulation or Honesty (DASH) and the Feingning Index (FI) based on the ability of people with dyslexia to correctly read words with altered letter order. These instruments have high sensitivity and specificity (Harrison et al., 2010).
In general, we know that the simulator tends to exaggerate symptoms, even those of other abilities unrelated to their disorder (González Ordi et al., 2012). In one of the few studies to detect fake participants with dyslexia, it was observed that they faked poor performance in all reading and writing tasks, as well as in tasks measuring intelligence (Harrison et al., 2008).
The main feature in adults with dyslexia is slow reading (Bønnerup et al., 2019; Nergård-Nilssen & Hulme, 2014; Rouweler et al., 2020), which persists along with a higher number of spelling errors (Afonso et al., 2015), even in those who apparently manage to compensate for their difficulties (Hatcher et al., 2002). They also show difficulty in reading long pseudowords and infrequent words, which is interpreted as a lack of automation of grapheme-phoneme conversion rules and poor lexical pathway efficiency, respectively (Bruck, 1990; Nergård-Nilssen & Hulme, 2014; Suárez-Coalla & Cuetos, 2015). On the other hand, they do not seem to benefit from context, because they are also slow at reading texts (Szenkovitz & Ramus, 2005; Tops et al., 2012) and are more sensitive to word frequency (Yael et al., 2015). The level of transparency of languages can have an important influence on reading fluency. In the most transparent languages, people with dyslexia achieve good levels of accuracy, although slowness always persists, even in university students (Suárez-Coalla & Cuetos, 2015). An Italian study, another language with a high degree of orthographic transparency, confirms the discriminatory power of reading speed as a marker of dyslexia in adults, even if the level of comprehension is normal (Re et al., 2011).
As in more opaque orthographies, Spanish adults with dyslexia continue to have difficulties in tasks involving the management of their phonological skills. Some studies in transparent orthographies suggest that phonological skills are related to reading, but that their effect diminishes after the first or second year of primary school (de Jong & van der Leij, 2003; Holopainen et al., 2000; Landerl & Wimmer, 2000).
This paper focuses on the search for differences between simulators and people with dyslexia when performing reading and writing tasks. We look for tasks that reveal simulation, in order to provide specific strategies that complement general clinical assessment methods (Rogers & Correa, 2008). The hypothesis underlying this work is that defaulters will tend to generalise their pattern of behaviour across all tests administered to them, whereas people with dyslexia will respond differently to tasks that are related to the neuropsychological characteristics of their disorder and tasks that are free of that influence or, at least, that adults with dyslexia manage to pass. For this purpose, we have designed a set of tests paired two by two. Apparently both tests are very similar, so we expect the simulators to behave in the same way, while people with dyslexia will show differential performance.
A total of 90 Spanish-speaking adults (73 females and 17 males) participated in three groups of 30 each: simulator, dyslexic and control. The three groups were sex-matched ꭓ2 (2, 90)=3.62, p=0.16. The dyslexia group was recruited among relatives and acquaintances of children receiving specific treatment. All reported having a clear diagnosis or history of specific reading and writing difficulties and having received compensatory care. Their mean age was 32.5 ± 9.33 years (range 20 to 47). The intelligence of the dyslexia group was controlled using the TONI-2 test (Brown et al., 2000), (IQ, M=109, SD =11.4). The simulator and control groups were recruited among volunteer students of psychology, speech therapy and occupational therapy from two universities in the city of Valencia (Spain). All of them reported having no neurological history, language disorders or learning difficulties; they were studying in Spanish and were randomly assigned to the control or sham group. The mean age was 23.13 ± 5.89 years (range 18 to 42), that of the sham group 23.07 ± 4.20 years (range 17 to 34). To establish a criterion for inclusion in the simulator and control groups, a Global Index of Reading Efficiency in Words (IGELp) was defined, weighting the time spent and the errors made in the reading test of 30 isolated infrequent words, using the expression IGELp= (30-nº. errors)/seconds*100), which followed a normal distribution (K= .572, p= .90). Five participants from the control and simulator groups with IGELp ≤ 93, which corresponds to the first decile and whose reading efficiency was very low, were excluded from the sample. The CSC-S RF questionnaire (Barkley & Murphy, 2006) was administered in order to detect possible participants with ADHD. Six people were excluded for this reason, so we can be sure that the sample is free of dyslexia/ADHD comorbidity.
The study was approved by the Ethics Committee of the Catholic University of Valencia San Vicente Martir (Declaration of Helsinki in the European Council Agreement, 1964-2013), complied with data protection law and participants gave their written consent.
Given the scarcity of standardised tests in Spanish, we decided to use specially created experimental tasks.
▪ Reading tests
To assess participants’ reading we used three classic tasks that measure lexical access (Suárez-Coalla & Cuetos, 2015): text reading and high and low frequency word reading.
Text Reading: speed (wpm) and accuracy (hits) were assessed with the Punctuation Signs subtest of the PROLEC-SE test (Ramos & Cuetos, 2005), whose scope of application extends up to the 4th year of Compulsory Secondary Education, as we consider that in this last educational year, levels of accuracy and speed similar to those of adults are reached.
Isolated Word Reading: includes two lists, the first of 30 frequent words (frequency range 50-100) and the second of 30 non-frequent words (frequency 1), according to the Diccionario de Frecuencias de las Unidades Lingüísticas del Castellano (Alameda & Cuetos, 1995), matched in length and syllabic complexity. Time and errors were assessed. In order to compare the effect of frequency, the composite variable Frequency Effect on Speed Reading Single Words (IWRSFE) was created, subtracting the score obtained when reading infrequent words from frequent words (IWRSFE = wpm high frequency - wpm low frequency).
▪ Writing tests
Dictation of words with and without articulatory suppression: participants dictated 20 words with low frequency of use, frequency range 11-19 (Alameda & Cuetos, 1995). Half of the words were written under the condition of articulatory suppression, which consists of writing while pronouncing the syllable «la» uninterruptedly (Re et al., 2011). Dictation was performed using a digital recording with comfortable listening through headphones. To compare the effect of articulatory suppression, the variable ASEDW (Effect of Articulatory Suppression on Dictation Writing) was calculated, following the same procedure of subtracting the measurements without and with articulatory suppression (ASEDW = hits without suppression - hits with suppression).
Time-limited pseudoword copying: delayed copying of pseudowords after a 4-second on-screen exposure. Ten pronounceable pseudowords (following Spanish phonotactic rules) of eleven characters each were presented, with a predominance of syllables of moderate-high complexity.
▪ Verbal fluency tasks
Semantic and phonemic verbal fluency: participants were given a task similar to that of the Verbal Fluency subtest of the NEPSY-II (Korkman et al., 2014), in which they were asked to evoke as many words as possible in one minute with the characteristics specified, first with a semantic and then a phonemic inducer. Semantic verbal fluency was determined by asking the participant to evoke any animal and phonemic fluency with words containing the consonant cluster [pr] in any position.
The effect of the semantic versus phonemic inducer was assessed by means of the composite variable SPFIE (Semantic Phonemic Fluency Induction Effect), calculated as Semantic Fluency hits minus Phonemic Fluency hits.
The group of simulators received the following verbal instructions three days before the tests: «Your goal is to demonstrate that dyslexia can be simulated. Take it as a challenge. We want you to imagine that you are a student who needs to obtain the privileges granted to people with dyslexia at the university. To get them, you will be tested to determine if you have dyslexia. Your aim is to fool the examiner». These conditions made it possible for people to seek any kind of information in a similar way to a fraudster. Both the control group and the group of people with dyslexia were instructed to perform the tests in the best possible way, making as few mistakes as possible and completing them in the shortest possible time. All participants individually performed the same reading, writing and phonological processing tasks. The approximate time to complete the total number of tests was 1 hour and 30 minutes.
A one-factor ANOVA and the corresponding HSD Tukey post hoc tests were performed for each of the tasks applied, after checking for homoscedasticity and normality conditions. T-test was used to analyse the within-group effects of the composite variables reflecting the effects of word use frequency, articulatory suppression and semantic versus phonological fluency. In order to provide strategies and indicators for the detection of simulation, COR curve analyses were conducted to determine a cut-off point of the tests as an indicator of simulation.
The simulator group obtained the worst results in all tasks, showing a general tendency to exaggeration. The differences between the three groups were always significant and with high effect sizes, higher for speed and lower for accuracy. Table I shows the scores obtained by the three groups in all the tests administered and in the composite variables, as well as the corresponding statistical comparisons using the one-way ANOVA.
TABLE I. Means, standard deviations and ANOVA in the reading, writing and fluency verbal test and compound variables
Measure |
Groups |
|
||||
Simulation |
Dyslexia |
Control |
||||
M (SD) |
M (SD) |
M (SD) |
F (2, 89) |
p |
ɳp2 |
|
Text reading (wpm) |
73.43(38.64) |
130.70 (29.99) |
192.63 (22.40) |
110.52 |
<.001*** |
0.71 |
Text reading (hits) |
268.57(25.51) |
289.17 (4.06) |
291.97 (1.92) |
21.90 |
<.001*** |
0.33 |
HF word reading (wpm) |
22.04 (13.70) |
73.44 (18.03) |
114.65 (25.37) |
167.54 |
<.001*** |
0.60 |
LF word reading (wpm) |
22.09 (13.09) |
46.99 (12.46) |
84.51 (16.66) |
147.10 |
<.001*** |
0.60 |
Reading PA words (hits) |
23.53 (5.34) |
29.57 (1.01) |
29.67 (1.21) |
35.88 |
<.001*** |
0.52 |
BF word reading (hits) |
19.67 (7.88) |
28.43 (1.68) |
28.70 (2.89) |
32.46 |
<.001*** |
0.54 |
Word dictation without AS (hits) |
3.67 (3.38) |
13.57 (1.70) |
14.80 (0.48) |
70.82 |
<.001*** |
0.62 |
Word dictation with AS (hits) |
3.57 (3.33) |
7.53 (4.15) |
13.47 (1.81) |
31.13 |
<.001*** |
0.42 |
Copy pseudo-words time limitation (cc) |
72.20(16.98) |
96.03 (4.50) |
99.97 (1.52) |
65.39 |
<.001*** |
0.60 |
Semantic verbal fluency (hits) |
13.30 (5.94) |
23.47 (5.69) |
27.33 (7.01) |
28.58 |
<.001*** |
0.40 |
Verbal phonemic fluency (hits) |
7.13(4.06) |
10.50 (4.46) |
13.83 (4) |
14.43 |
<.001*** |
0.25 |
IWRSFE |
-0.05(4.26) |
26.45 (12.73) |
30.14 (17.40) |
29.70 |
<.001*** |
0.41 |
ASEDW |
0.10(1.86) |
5.89 (3.47) |
1.33 (1.49) |
52.35 |
<.001*** |
0.55 |
SPFIE |
6.17(4.59) |
12.97 (4.71) |
13.50 (7.29) |
29.70 |
<.001*** |
0.41 |
Note. M: Mean; SD: Standard Deviation; F: ANOVA; ɳp2: Partial Eta squared, effect size value: 0.01 small; 0.06 medium; 0.18 large; *** = p-value < .001; AF: High frequency; LF: Low frequency; cc: correct characters; AS: Articulatory Suppression; IWRSFE: Effect Frequency Velocity Reading Speed Isolated Words; ASEDW: Articulatory Suppression Effect on Dictation Writing; SPFIE: Semantic Phonological Fluency Induction Effect.
Source: Cervera-Mérida, Pellicer-Magraner and Ygual-Fernández. Compiled by the authors.
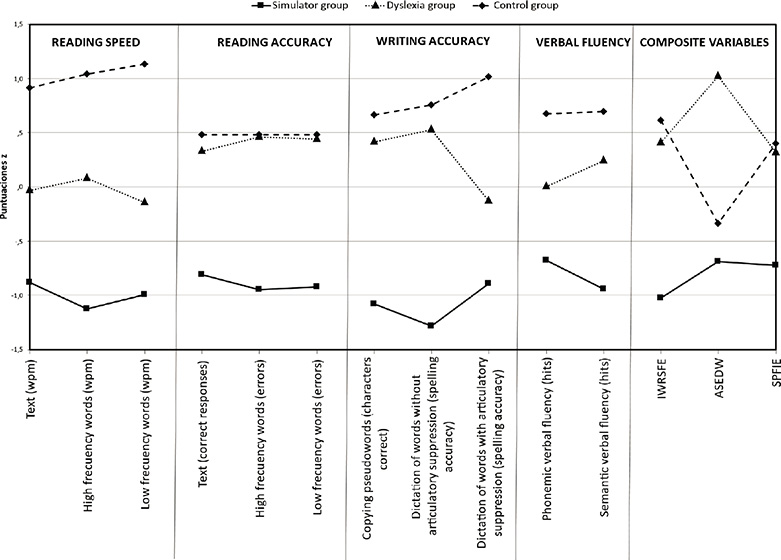
Figure I compares the scores obtained by the three groups on the reading, writing, verbal fluency and the composite variables measuring the effects of frequency, articulatory suppression and semantic or phonemic inducer. Typical z-scores were used to compensate for the different measurement scales.
FIGURE I. Comparison of simulator, dyslexia and control groups on measures of reading, writing, verbal fluency and composite variables
Note: Typified scores (z)
Source: Cervera-Mérida, Pellicer-Magraner and Ygual-Fernández. Compiled by the authors.
The results show something to be expected: the control group is faster than the dyslexia group and the dyslexia group is faster than the simulator. However, the dyslexia group reads as accurately as the control group, with no significant differences between them in the post hoc tests - due to the ceiling effect of transparent languages - while the simulator group makes many more errors because they are not aware of this effect, and their scores are much lower.
Comparing the intra-group differences for reading the high and low frequency words in the T-test, it appears that control and dyslexia read the frequent words faster and more accurately, with a large effect size; while the simulator read the high and low frequency words at about the same speed and, unexpectedly, was slightly more accurate in reading the low frequency words (see Table I and Table III).
The effect of frequency was quantified by means of the composite variable Isolated Word Reading Speed Frequency Effect (IWRSFE) (Table I). The control and dyslexia groups show a strong positive effect of frequency. Both groups read infrequent words at a slower speed and no significant differences were found between them in the post hoc tests (Table II). However, the simulator group does not suffer from the frequency effect, as it reads less frequent words faster and therefore has a negative effect, behaving differently when compared to the control and dyslexia groups (Figure I). Therefore, we can assume that the frequency effect distinguishes non-fakers - whether they suffer from dyslexia or not - from fakers.
TABLE II. Reading tests (text and single words) and frequency effect. Multiple comparisons between groups using Tukey’s HSD
Groups |
Text |
High frequency words |
Low frequency words |
IWRSFE |
||||
Speed (wpm) |
Speed (wpm) |
Speed (wpm) |
||||||
DM |
p |
DM |
p |
DM |
p |
DM |
p |
|
Simulator vs Dyslexia |
-57.27 |
<.001*** |
-51.40 |
<.001*** |
-24.90 |
<.001*** |
-26.50 |
<.001*** |
Groups |
Text |
High frequency words |
Low frequency words |
IWRSFE |
||||
Speed (wpm) |
Speed (wpm) |
Speed (wpm) |
||||||
DM |
p |
DM |
p |
DM |
p |
DM |
p |
|
Simulator vs Control |
-119.20 |
<.001*** |
-92. 61 |
<.001*** |
-62.43 |
<.001*** |
-30.20 |
<.001*** |
Dyslexia vs Control |
-61.93 |
<.001*** |
-41.21 |
<.001*** |
-37.51 |
<.001*** |
-3.69 |
0.5 |
|
Accuracy (hits) |
Accuracy (hits) |
Accuracy (hits) |
|
||||
DM |
p |
DM |
p |
DM |
p |
|||
Simulator vs Dyslexia |
-20.60 |
<.001*** |
-6.03 |
<.001*** |
-8.77 |
<.001*** |
||
Simulator vs Control |
-23.40 |
<.001*** |
-6.13 |
<.001*** |
-9.03 |
<.001*** |
||
Dyslexia vs Control |
-2.80 |
0.75 |
-0.10 |
0.992 |
-0.26 |
0.976 |
||
Note: IWRSFE: Isolated Word Reading Speed Frequency Effect;
wpm = words per minute; MD = mean difference; *** = p-value <0.001
Source: Cervera-Mérida, Pellicer-Magraner and Ygual-Fernández, own elaboration.
TABLE III. Intra-group comparisons by T-test for word reading, verbal fluency and dictation word writing tests
Groups |
Word reading speed (wpm) |
||||
High frequency |
Low frequency |
|
|||
M (SD) |
M (SD) |
T-test |
p |
d Cohen |
|
Simulator |
22 (13.7) |
22.09 (13.1) |
-0.066 |
0.95 |
-- |
Dyslexia |
73.44 (18) |
46.99 (12.5) |
11.38 |
<.001*** |
2.08 (L) |
Control |
114.65 (25.4) |
84.51 (16.7) |
9.48 |
<.001*** |
1.47 (L) |
|
Word reading accuracy (hits) |
||||
High frequency |
Low frequency |
|
|||
M (SD) |
M (SD) |
T-test |
p |
d Cohen |
|
Simulator |
23.53 (5.3) |
19.67 (7.9) |
4.86 |
<.001*** |
0.99 (L) |
Dyslexia |
29.57 (1) |
28.43 (1.7) |
4.20 |
<.001*** |
0.77 (L) |
Control |
29.67 (1.2) |
28.7 (2.9) |
2.99 |
.006** |
0.66 (L) |
|
|
|
|
|
|
Verbal fluency (hits) |
|||||
Semantic inducer |
Phonemic inducer |
|
|||
M (SD) |
M (SD) |
T-test |
p |
d Cohen |
|
Simulator |
13.30 (6) |
7.13 (4.1) |
7.30 |
<.001 |
1.33 (L) |
Dyslexia |
23.47 (5.7) |
10.50 (4.5) |
15.10 |
<.001 |
2.7 (L) |
Control |
27.30 (7) |
13.83 (4) |
9.70 |
<001 |
1.76 (L) |
|
|
|
|
|
|
Accuracy of handwriting dictation (hits) |
|||||
No Suppression |
With Suppression |
|
|||
M (SD) |
M (SD) |
T-test |
p |
d Cohen |
|
Simulator |
3.67 (3.4) |
3.57 (3.3) |
0.29 |
0.77 |
-- |
|
Accuracy of handwriting dictation (hits) |
||||
No Suppression |
With Suppression |
|
|||
M (SD) |
M (SD) |
T-test |
p |
d Cohen |
|
Dyslexia |
13.57 (1.7) |
7.53 (4.2) |
9.90 |
<0.001*** |
-1.81 (L) |
Control |
14.80 (0.5) |
13.47 (1.8) |
4.50 |
<0.001*** |
-0.79 (L) |
Note: wpm = words per minute; M: Mean; SD: Standard Deviation;
*** = p-value <0.001; ** = p-value <0.01;
Effect size (d Cohen) - null, small (S) <0.2, medium (M) <0.5, large (L) >0.8
Source: Cervera-Mérida, Pellicer-Magraner and Ygual-Fernández. Compiled by the authors.
To assess the ability to detect the simulation of the variable Text Reading Speed between the simulator and dyslexia groups, a COR curve analysis was performed (see Figure II), which resulted in an area under the curve value of 0.87, which should be considered good, and a cut-off point of 83 wpm (sensitivity=90% and specificity=73%), so that this variable could be a moderately relevant indicator to discriminate the simulation.
FIGURE II. COR Speed curve Text Reading (wpm)
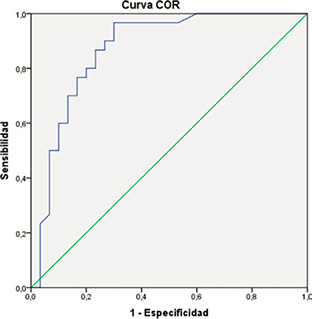
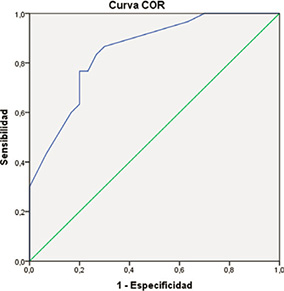
FIGURE III. COR Curve IWRSFE
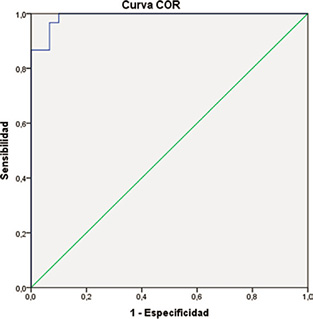
FIGURE IV. Pseudo-word copy COR curve
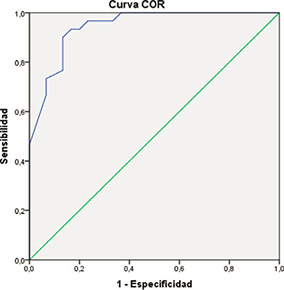
FIGURE V. COR ASEDW curve
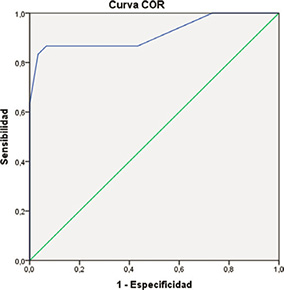
FIGURE VI. SPFIE COR curve
Source: Cervera-Mérida, Pellicer-Magraner and Ygual-Fernández. Compiled by the authors.
In the same way, the composite variable Isolated Word Reading Speed Frequency Effect (IWRSFE) was assessed, with an area under curve value of 0.99 which should be considered excellent (see Figure III) and a cut-off point of 4.8 (sensitivity=100% and specificity=90%), so that this variable, which expresses the difference in speed when reading frequent and infrequent words, could be a relevant indicator to discriminate the simulation.
In the writing tasks, the general trend is maintained: the control group performs better than the dyslexia group and the dyslexia group performs better than the simulator (see Table I and Figure I).
Copying accuracy was assessed by assigning one point for each letter copied correctly in the correct order. ANOVA ensures significant differences when comparing the three groups (Table I) and Tuckey’s HSD post hoc test shows that the control and dyslexia groups perform the task similarly, while the simulator, which makes significantly more errors, differs significantly from both (Table IV).
TABLE IV. Writing tests with the effect of articulatory suppression, and Verbal Fluency with the effect of inducer change. Multiple comparisons using Tukey’s HSD
Groups |
Copy Pseudowords |
Word dictation |
ESADP |
Verbal fluency (number of words) |
SPFIE |
|||||||||
No deletion |
With deletion |
Semantic indicator |
Phonemic indicator |
|||||||||||
DM |
p |
DM |
p |
DM |
p |
DM |
p |
DM |
p |
DM |
p |
DM |
p |
|
Simulator vs Dyslexia |
-23.83 |
<.001*** |
-9.9 |
-4 |
<.001*** |
-4,43 |
<.001*** |
-10.17 |
<.001*** |
-3.37 |
.007** |
-6.80 |
<.001*** |
|
Simulator vs Control |
-27.79 |
<.001*** |
-11.13 |
<.001*** |
-10 |
<.001*** |
-1.23 |
.271 |
-14.03 |
<.001*** |
-6.70 |
<.001*** |
-7.33 |
<.001*** |
Dyslexia vs Control |
-3.93 |
0.3 |
-1.23 |
0.08 |
-6 |
<.001*** |
3.20 |
<.001*** |
-3.87 |
.048* |
-3.33 |
.008** |
-0.53 |
-0.92 |
Note: MD = Mean Difference; ASEDW = Articulatory Suppression Effect on Dictation Writting;
SPFIE = Semantic Phonological Fluency Induction Effect; *** = p-value <0.001; ** = p-value <0.01; * = p-value <0.5
Source: Cervera-Mérida, Pellicer-Magraner and Ygual-Fernández. Compiled by the authors.
The COR curve analysis gives an area under the curve value of 0.94 (very good). This indicator could be considered clinically important in the detection of simulation. The cut-off point of 90 correctly copied characters shows sensitivity 90% and specificity 86.7% (see Figure IV).
The number of correctly spelled words was counted under the conditions without and with articulatory suppression. The differences between the three groups were clearly significant, both in the condition with and without articulatory suppression. A large effect size is reached in both conditions (Table I). Figure I shows how the scores of the dyslexia group are close to those of the control group in the non-articulatory suppression condition, although their differences do not reach statistical significance (see Table IV). However, the articulatory suppression condition makes the accuracy of the dyslexia group much worse and the scores are closer to those of the simulator, although they also maintain significant differences with this group.
When we compare the intra-group differences using the T-test (Table III), we see that articulatory suppression affects the dyslexia group with a very large effect size (d = -1.81) and the control group to a lesser extent (d = -0.79). However, it does not significantly affect the simulator group, as they make almost the same number of errors under both conditions.
The composite variable ASEDW, which assesses the effect of articulatory suppression,
The differences between the groups (Table I) and the post hoc contrasts allow us to affirm that suppression affects the dyslexia group to a greater extent, which differs significantly from the control and simulator groups, while it does not seem to have any significant differential effect between the latter groups (see Table IV). The ASEDW variable reaches an area under the curve value of 0.91 (very good) which could be used as a clear indicator of simulation with a cut-off point of 3.5 with a sensitivity of 83.3% and a specificity of 96.7% (Figure V).
In the two paired verbal fluency tests (semantic and phonemic verbal fluency) the control group performed best, followed by the dyslexia and the simulator, which clearly maintains exaggeration behaviour. Intergroup differences were significant for both the semantic and phonemic inducer (Table I), with no clustering in the post hoc test (see Table IV), as the dyslexia group always maintained significant differences with both groups. Intragroup differences were statistically significant and the effect size was large in all three groups (Table III), although much higher for the dyslexia group (d=2.7). To assess the effect of the semantic/phonemic inducer condition, the SPFIE variable was used following the procedure of subtraction between scores (table I). The post-hoc tests show that the control and dyslexia groups behave in the same way, and the simulator always differs from both, which shows that the effect of the change of condition has no effect on the simulator group while it has an effect on the other two (see Figure I and Table IV). The SPFIE variable reaches an area under curve value of 0.85 (very good) which could be considered a simulation indicator with a cut-off point of 7.5 with a sensitivity of 83.3% and a specificity of 73.3% (Figure VI).
The five indicators have perfect detection power for deception behaviour if the mean scores of the simulator and dyslexia groups are assessed. In the light of the results, the proposal is made concrete in five indicators of simulating dyslexia with their corresponding cut-off points and sensitivity and specificity values as detailed in Table V. Figure VII shows the cut-off points for each of the five indicators in multidimensional form.
TABLE V. Sensitivity, specificity and cut-off points for detecting simulation in dyslexia
Measure |
U |
Cut-off point |
Sensitivity % |
Specificity % |
Text reading speed (wpm) |
0.87* |
83 |
90 |
73 |
Copying of pseudo-words (correct characters) |
0.94** |
90 |
90 |
86.7 |
IWRSFE |
0.99*** |
4.8 |
100 |
90 |
ASEDW |
0.92** |
2.5 |
86.7 |
93.3 |
SPFIE |
0.85* |
7.5 |
83.3 |
73.3 |
U = value of the area under the curve; * Values of the area under the curve good (0.75-0.90); ** Values of the area under the curve very good (0.91-0.97); *** Excellent Area Under Curve Values (0.97-1);
IWRSFE: Isolated Word Reading Speed Frequency Effect; ASEDW: Articulatory Suppression Effect on Dictation Writing; SPFIE: Semantic Phonological Fluency Induction Effect.
Source: Cervera-Mérida, Pellicer-Magraner and Ygual-Fernández. Compiled by the authors.
FIGURE VII. Multidimensional representation of the average values for the five indicators in the simulator and dyslexia groups
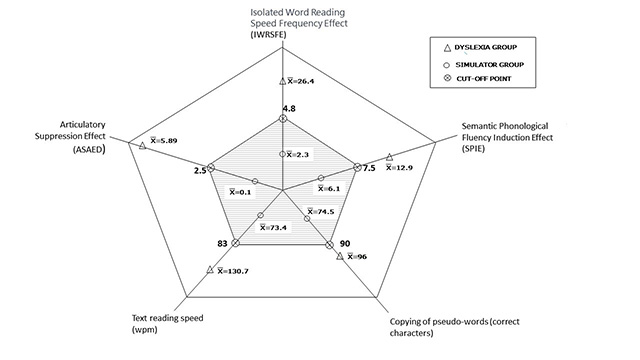
Note: The shaded area detects cheating behaviour below the set cut-off points.
Source: Cervera-Mérida, Pellicer-Magraner and Ygual-Fernández, own elaboration.
The inner pentagon represents the values below the detection thresholds, where the average scores of the simulator group are located. The outer zone indicates the absence of cheating behaviour and contains the scores of the dyslexia group. To determine whether the proposed set of five indicators and cut-off points has the power to detect pretence in each of the participants in the study, we consider that cheating behaviour is detected when the person scores below the threshold in at least two of the five indicators. Applying this criterion, we can see that the sensitivity is 100% (all people in the pretender group are detected as liars), and the specificity reaches 94%, since two people with dyslexia would be considered as pretenders in the basic tasks of reading text or writing to dictation that could be mistaken for pretence.
The results show the general trend of exaggeration in simulation behaviours. The pretender group is always slower and makes more errors, both in reading and writing tests and in verbal fluency tests. Previous work had come to the same conclusion using questionnaires designed to test feigning behaviour (Lindstrom et al., 2011) or using reading and writing tests (Harrison et al., 2008). The work of Harrison et al. (2008 and 2010) is based on the fact that people with dyslexia perform quite well on the task of reading sentences, where some words have altered letter order and pretenders exaggerate the symptoms. The present proposal to detect simulation has been carried out by measuring with paired tests the effect of three factors to which people with dyslexia are sensitive, while simulators are not: word frequency, articulatory suppression and the type of inducer for verbal fluency - semantic or phonemic. In one of these tests, people with dyslexia perform the task significantly better than in the other. We believe that this procedure may be resistant to sophisticated attempts at fraud. It is very unlikely that fraudsters would be able to detect which of the two tests they need to fail more or perform more slowly and do so at an appropriate rate. In addition, read and write speed tests have been included, where exaggeration behaviour is easily detected.
The results provide resources for educators and counsellors to detect simulation when the honesty of those seeking support for the inclusion of students with learning difficulties is questionable. Such doubts may arise, for example, in university access or when compensatory measures are proposed, situations where some educators may be sceptical.
The group of simulators was recruited from among students from two universities and two degrees that provide information about dyslexia and had time for research before taking the tests. In our opinion, these conditions may have given them an advantage over other types of people who would have exaggerated even more.
The frequency of use when reading single words produced the expected effect in the dyslexia and control groups: they read the less frequent words more slowly and less accurately. However, the simulator was not sensitive to this effect and read both types of words in the same way.
Articulatory suppression significantly affects the writing ability of people with dyslexia. Although all participants wrote more slowly and made more errors under this condition, people with dyslexia suffer from this effect two to four times more. The effect is so strong that they come to resemble imitators, scoring very low when they are forced to write and speak at the same time.
In the Verbal Fluency test, the exaggeration behaviour of the simulator group and the tendency of the dyslexia group to resemble the control group are maintained. People with dyslexia suffer from a strong phonemic versus semantic inducer effect, i.e. they are able to evoke many more words from a given semantic field than words containing a particular letter or sequence of letters. Simulators, unaware of this effect, evoked very few words with both inducers.
In the text reading test and the pseudoword copying test, people with dyslexia achieve similar accuracy to controls - as we know to be the case in transparent spelling languages - while simulators exaggerate and make many more errors. However, adults with dyslexia never read or write as fast as controls, although they consistently outperform simulators.
The general behaviour of symptom exaggeration is seen in text reading and pseudoword copying. Similarly, feigning behaviour can be revealed by paired tests in which people with dyslexia can perform quite well on one task and with great difficulty on the other, while pretenders perform equally well on both. Adults with dyslexia clearly suffer from the effects of frequency of use when reading single words, of articulatory suppression when writing in dictation, and of phonological versus semantic cueing in the verbal fluency task, whereas pretenders do not suffer from these effects and perform equally well in the paired tests.
The limitations we have observed have been discussed above: 100% sensitivity and 94% specificity are achieved when applying the criterion of scoring below on two or more indicators of simulation detection, which makes it possible that some people with dyslexia who obtain extraordinarily low scores on text reading and pseudoword copying tasks could be mistaken for simulators. In these few cases of doubt, other tests and indicators of educational history should be added to the assessment. One of the influencing factors may be low schooling and limited exposure to reading in individuals with school failure.
This work is a proposal for the development of strategies and indicators for the detection of faking dyslexia signs in a real context. Future work could standardise an instrument that incorporates these indicators for detecting faking in post-compulsory education students who are eligible for compensatory measures.
It is to be expected that clinicians and counsellors will apply any assessment instrument with caution and supplement it with history data and other indicators. For this reason, we believe that the limitations of the proposal are unlikely to be detrimental to the people with dyslexia whom this research is intended to protect. In fact, the indicators we propose could also be used as a complement to the diagnoses, reinforcing the results obtained in their assessment, as they are considered to be free of simulation.
Afonso, O., Suárez-Coalla, P., & Cuetos, F. (2015). Spelling impairments in Spanish dyslexic adults. Frontiers in Psychology, 6. APA PsycInfo. https://doi.org/10.3389/fpsyg.2015.00466
Alameda, J., & Cuetos, F. (1995). Diccionario de Frecuencias de las Unidades Lingüísticas del Castellano. Publications Service of the University of Oviedo.
American Psychiatric Association (2013). Diagnostic and Statistical Manual of Mental Disorders (Fifth Edition). American Psychiatric Association. https://doi.org/10.1176/appi.books.9780890425596
Barkley, R. A., & Murphy, K. R. (2006). Attention-deficit hyperactivity disorder. 2: A clinical workbook / Russel A. Barkley; Kevin R. Murphy (3. ed). Guilford Press.
Bønnerup, K. H., Pedersen, A. L., Weed, E., & Parrila, R. (2019). Differences in the literacy skills of Danish dyslexic students in two types of higher education programmes. Dyslexia (Chichester, England), 25(2), 173–189. MEDLINE Complete. https://doi.org/10.1002/dys.1617
Brown, L., Sherbenou, R. J., Johnsen, S. K., & Cruz, M. V. de la. (2000). TONI-2: test of nonverbal intelligence: assessing cognitive ability without the influence of language. TEA.
Bruck, M. (1990). Word-recognition skills of adults with childhood diagnoses of dyslexia. Developmental Psychology, 26(3), 439–454. APA PsycInfo. https://doi.org/10.1037/0012-1649.26.3.439
de Jong, P. F., & van der Leij, A. (2003). Developmental changes in the manifestation of a phonological deficit in dyslexic children learning to read a regular orthography. Journal of Educational Psychology, 95(1), 22–40. APA PsycInfo. https://doi.org/10.1037/0022-0663.95.1.22
Doust, C., Fontanillas, P., Eising, E., Gordon, S. D., Wang, Z., Alagöz, G., Molz, B., Pourcain, B. S., Francks, C., Marioni, R. E., Zhao, J., Paracchini, S., Talcott, J. B., Monaco, A. P., Stein, J. F., Gruen, J. R., Olson, R. K., Willcutt, E. G., DeFries, J. C., … Luciano, M. (2022). Discovery of 42 genome-wide significant loci associated with dyslexia. Nature Genetics, 54(11), 1621–1629. https://doi.org/10.1038/s41588-022-01192-y
Formoso, M. A., Ortiz, A., Martinez-Murcia, F. J., Gallego, N., & Luque, J. L. (2021). Detecting Phase-Synchrony Connectivity Anomalies in EEG Signals. Application to Dyslexia Diagnosis. Sensors (Basel, Switzerland), 21(21). https://doi.org/10.3390/s21217061
Frazier, T. W., Frazier, A. R., Busch, R. M., Kerwood, M. A., & Demaree, H. A. (2008). Detection of simulated ADHD and reading disorder using symptom validity measures. Archives of clinical neuropsychology: the official journal of the National Academy of Neuropsychologists, 23(5), Art. 5. MEDLINE Complete. https://doi.org/10.1016/j.acn.2008.04.001
Gertsovski, A., & Ahissar, M. (2022). Reduced Learning of Sound Categories in Dyslexia Is Associated with Reduced Regularity-Induced Auditory Cortex Adaptation. The Journal of Neuroscience: The Official Journal of the Society for Neuroscience, 42(7), 1328–1342. https://doi.org/10.1523/JNEUROSCI.1533-21.2021
Giménez, A., Luque, J. L., López-Zamora, M., & Fernández-Navas, M. (2015). A self-report of reading disabilities for adults: ATLAS. Anales de Psicología, 31(1), 109–119. APA PsycInfo.
González Ordi, H., Santamaría Fernández, P., & Capilla Ramírez, P. (2012). Simulation detection strategies: a multidisciplinary clinical manual. TEA.
Harrison, A. G., Edwards, M. J., Armstrong, I., & Parker, K. C. H. (2010). An investigation of methods to detect feigned reading disabilities. Archives of clinical neuropsychology: the official journal of the National Academy of Neuropsychologists, 25(2), Art. 2. MEDLINE Complete. https://doi.org/10.1093/arclin/acp104
Harrison, A. G., Edwards, M. J., & Parker, K. C. H. (2008). Identifying students feigning dyslexia: Preliminary findings and strategies for detection. Dyslexia (Chichester, England), 14(3), Art. 3. MEDLINE Complete. https://doi.org/10.1002/dys.366
Hatcher, J., Snowling, M. J., & Griffiths, Y. M. (2002). Cognitive assessment of dyslexic students in higher education. British Journal of Educational Psychology, 72(1), 119. Psychology and Behavioral Sciences Collection.
Holopainen, L., Ahonen, T., Tolvanen, A., & Lyytinen, H. (2000). Two alternative ways to model the relation between reading accuracy and phonological awareness at preschool age. Scientific Studies of Reading, 4(2), 77–100. APA PsycInfo. https://doi.org/10.1207/S1532799XSSR0402_01
Hurtubise, J. L., Scavone, A., Sagar, S., & Erdodi, L. A. (2017). Psychometric markers of genuine and feigned neurodevelopmental disorders in the context of applying for academic accommodations. Psychological Injury and Law, 10(2), Art. 2. APA PsycInfo. https://doi.org/10.1007/s12207-017-9287-5
Korkman, M., Kirk, U., & Kemp, S. (2014). NEPSY-II. Pearson.
Landerl, K., & Wimmer, H. (2000). Deficits in phoneme segmentation are not the core problem of dyslexia: Evidence from German and English children. Applied Psycholinguistics, 21(2), 243–262. APA PsycInfo. https://doi.org/10.1017/S0142716400002058
Lindstrom, W., Coleman, C., Thomassin, K., Southall, C. M., & Lindstrom, J. H. (2011). Simulated dyslexia in postsecondary students: Description and detection using embedded validity indicators. The Clinical Neuropsychologist, 25(2), Art. 2. APA PsycInfo. https://doi.org/10.1080/13854046.2010.537280
Loser, N. M. (2013). Malingering detection measure utility and concordance in a university accommodation-seeking student population [ProQuest Information & Learning]. In Dissertation Abstracts International: Section B: The Sciences and Engineering (Vol. 74, Issue 3–B(E)).
Morgan, J. E., & Sweet, J. J. (2009). Neuropsychology of malingering casebook (J. E. Morgan & J. J. Sweet (Eds.)). Psychology Press.
Nergård-Nilssen, T., & Hulme, C. (2014). Developmental dyslexia in adults: Behavioural manifestations and cognitive correlates. Dyslexia (10769242), 20(3), 191–207. CINAHL Complete. https://doi.org/10.1002/dys.1477
Ramos, J.L. & Cuetos, F. (2005). Evaluación de los Procesos Lectores. Prolec-Se (3rd Edition). TEA.
Re, A. M., Tressoldi, P. E., Cornoldi, C., & Lucangeli, D. (2011). Which Tasks Best Discriminate between Dyslexic University Students and Controls in a Transparent Language? Dyslexia (10769242), 17(3), Art. 3. Psychology and Behavioral Sciences Collection.
Rice, M., & Brooks, G. (2004). Developmental dyslexia in adults: a research review. National Research and Development Centre for adult literacy and numeracy.
Rogers, R., & Correa, A. A. (2008). Determinations of malingering: Evolution from case-based methods to detection strategies. Psychiatry, Psychology and Law, 15(2), 213–223. APA PsycInfo. https://doi.org/10.1080/13218710802014501
Rouweler, L., Varkevisser, N., Brysbaert, M., Maassen, B., & Tops, W. (2020). The flamingo test: A new diagnostic instrument for dyslexia in Dutch higher education students. European Journal of Special Needs Education, 35(4), 529–543. APA PsycInfo. https://doi.org/10.1080/08856257.2019.1709703
Ryder, D., & Norwich, B. (2019). UK higher education lecturers’ perspectives of dyslexia, dyslexic students and related disability provision. Journal of Research in Special Educational Needs, 19(3), 161–172. https://doi.org/10.1111/1471-3802.12438
Suárez-Coalla, P., & Cuetos, F. (2015). Reading difficulties in Spanish adults with dyslexia. Annals of Dyslexia, 65(1), 33–51. Psychology and Behavioral Sciences Collection.
Sullivan, B.K., May, K., & Galbally, L. (2007). Symptom Exaggeration by College Adults in Attention-Deficit Hyperactivity Disorder and Learning Disorder Assessments. Applied Neuropsychology, 14(3), 189–207. Psychology and Behavioral Sciences Collection.
Sweet, J. J. (1999). Malingering: Differential diagnosis. In J. J. Sweet, Forensic neuropsychology: Fundamentals and practice (pp. 255–285). Swets & Zeitlinger Publishers
Szenkovitz, G., & Ramus, F. (2005). Exploring dyslexics’ phonological deficit, I: lexical vs sub-lexical and input vs output processes. Dyslexia (10769242), 11(4), 253–268. Psychology and Behavioral Sciences Collection.
Tops, W., Callens, M., Lammertyn, J., Hees, V., & Brysbaert, M. (2012). Identifying students with dyslexia in higher education. Annals of Dyslexia, 62(3), 186–203. Psychology and Behavioral Sciences Collection. https://doi.org/10.1007/s11881-012-0072-6
Van den Boer, M., de Bree, E. H., & de Jong, P. F. (2018). Simulation of dyslexia. How literacy and cognitive skills can help distinguish college students with dyslexia from malingerers. PloS one, 13(5), e0196903. https://doi.org/10.1371/journal.pone.0196903
Yael, W., Tami, K., & Tali, B. (2015). The effects of orthographic transparency and familiarity on reading Hebrew words in adults with and without dyslexia. Annals of Dyslexia, 65(2), 84–102. https://doi.org/10.1007/s11881-015-0100-4
Contact address: José Francisco Cervera-Mérida. Universidad Católica de Valencia San Vicente Mártir, Facultad de Psicología, Departamento de Logopedia. Avenida de la Ilustración nº2, 46100, Burjassot. E-mail: josefran.cervera@ucv.es