FIGURE I. Neural network results, including the metrics proposed by Pizarroso et al. (2022), for Universidad Complutense de Madrid (average mark in Business Mathematics I and II)
Source: Compiled by author.
https://doi.org/10.4438/1988-592X-RE-2023-402-597
José Luis Arroyo-Barrigüete
https://orcid.org/0000-0002-3660-3933
Universidad Pontificia Comillas
Susana Carabias López
https://orcid.org/0003-1375-1308
Universidad Pontificia Comillas
Adolfo Hernández
https://orcid.org/003-1078-2328
Universidad Complutense de Madrid
Marina Segura
https://orcid.org/003-00002-6068-960X
Universidad Complutense de Madrid
Abstract
Previous studies suggest that the major taken at high school is a very relevant variable in predicting average marks during the first year of business administration (BA) degrees. However, the effect on particular subjects and specifically on mathematics, is not fully solved, as there are very few studies on the topic, the evidence is contradictory and there are no comparative studies between different centers. This paper compares the results at two different universities: 873 students of the BA degree at the Universidad Complutense de Madrid and 822 at the Universidad Pontificia Comillas. The information was obtained from the institutional databases at the two centers, selecting from among the students enrolled between the academic years 2009/2010-2021/2022 those for whom complete information was available. Methodologically, the use of regression models has been combined with interpretable neural networks to ensure the robustness of the results. The analysis shows that, at both universities and independently of the methodological approach, the results are virtually identical: students from the science major outperform their peers from the social sciences major in business mathematics I and II. From the point of view of teaching practice, these results have two implications. Firstly, it seems necessary to reflect on the focus and content of mathematics in the social sciences major, seeking greater alignment with the requirements of the degrees linked to this major. Secondly, regarding teaching practice in the first year of university, it seems necessary to rethink teaching strategies in mathematics, bearing in mind the characteristics and learning styles of students from the social sciences major.
Keywords: Mathematics, higher education, academic performance, business degree, advanced high school.
Resumen
Estudios previos apuntan a que la especialidad cursada en bachillerato es una variable muy relevante en la predicción del rendimiento medio durante el primer curso en grados en Administración y Dirección de Empresas (ADE). Sin embargo, el efecto en asignaturas concretas y específicamente en las de matemáticas, no está plenamente resuelto, pues además de que existen muy pocos estudios al respecto, las evidencias son contradictorias y no existen estudios comparativos entre varios centros. En este trabajo se comparan los resultados en dos universidades diferentes: 873 alumnos del grado en ADE de la Universidad Complutense de Madrid y 822 de la Universidad Pontificia Comillas. La información se ha obtenido de las bases de datos institucionales de ambos centros, seleccionando de entre todos los alumnos matriculados entre los cursos 2009/2010-2021/2022 aquellos para los que se disponía de información completa. Metodológicamente se ha combinado el uso de modelos de regresión con redes neuronales interpretables, para asegurar la robustez de los resultados. El análisis muestra que, en ambas universidades e independientemente de la aproximación metodológica, los resultados son virtualmente idénticos: los alumnos procedentes del bachillerato de ciencias presentan un rendimiento académico sensiblemente mejor en matemáticas empresariales I y II que sus compañeros de ciencias sociales. Desde el punto de vista de la práctica docente, estos resultados tienen dos implicaciones. En primer lugar, parece necesario llevar a cabo una reflexión sobre el enfoque y contenidos de matemáticas en el bachillerato de ciencias sociales, buscando un mayor alineamiento con los requerimientos de los grados ligados a esta especialidad. En segundo lugar, respecto a la práctica docente en el primer curso universitario, parece necesario repensar las estrategias didácticas en matemáticas, considerando las características y el estilo de aprendizaje de los alumnos procedentes del bachillerato de ciencias sociales.
Palabras clave: Matemáticas, educación superior, rendimiento académico, grado en administración de empresas, bachillerato.
According to previous research (Arroyo-Barrigüete et al., 2020a), the major at advanced high school has a considerable impact on the academic performance of Business Administration (BA) students during the first year of their university studies. However, this result refers to average performance, not to specific subjects. In the particular case of mathematics subjects, there are very few studies and the evidence is also contradictory. Thus, for example, Gonzalez Veiga et al. (1999) concluded that, both for the former five-year BA degree and for the three-year BA diploma, students who had taken the science major in their advanced high school studies achieved a better performance in BA mathematics than their peers who majored in social sciences. This study was based on a sample of 242 undergraduates in the five-year degree and 169 undergraduate students in the three-year diploma, all at the University of Oviedo. Martínez de Ibarreta et al. (2010), working on a sample of 554 BA students at the Universidad Pontificia Comillas, concluded that having taken a high school major in science had a positive effect on performance in quantitative subjects, especially in mathematics. However, these results do not coincide with a more recent study by Dávila et al. (2015) for students of the BA degree in this subject, whose conclusions suggest that there are no differences between the two groups of students. In this case, the authors worked on a sample of 279 students from the University of Las Palmas de Gran Canaria.
Knowing that mathematics subjects in the first year of the BA degree tend to present the highest drop-out rate1 is key to identifying those factors that influence this. Therefore, it is necessary to know the effect of a variable that, according to the aforementioned studies, could have a considerable impact.
This study has been carried out by university lecturers of quantitative methods in Business Administration studies, with the ultimate goal of improving teaching and learning processes, so that synergies between their teaching and research work can be generated (Jaworski, 1998). This research paper can be framed within the area of knowledge of Mathematics Education, whose philosophical and theoretical foundation is presented in Ernest (2016).
The need to accurately define the objective of the research and test out a concrete hypothesis can make it difficult to connect with the complex problem of improving teaching and learning processes. Godino et al. (2021) offer a solution to this difficulty that includes three contributions to research in Mathematics Education, based on the so-called onto-semiotic model (Godino and Batanero, 1994, Godino et al., 2007; Godino et al., 2019). The first of these contributions is the specification of the mathematical content of the problem under study. This specification is directly related to the name of the reference model, since it requires the development of two tasks: on the one hand, the ontological task of identifying the mathematical objects involved; on the other hand, the semiotic task of studying the relationships between these objects. The second contribution by Godino et al. (2021) is the decomposition of instructional processes into their different facets, which they call epistemic, cognitive, interactional, ecological, affective and mediational dimensions. Focusing on each of these facets allows such a complex problem as mathematics teaching processes to be efficiently analyzed; Hence, this is the approach chosen to draw the conclusions of this study. The third contribution, which consists of identifying criteria that contribute to good teaching practices through the so-called theory of didactic suitability, will also be considered. The concept of didactic suitability of a teaching process is defined as the degree to which it meets certain characteristics that allow it to be classified as optimal or adequate for its objectives. Suitability can be considered both in relation to the general teaching process and to a particular dimension.
Accordingly, the existence of discrepancies in previous studies and the importance of mathematics subjects in the academic failure of BA students justify this paper. In order to overcome certain limitations identified in previous studies, we have used significantly larger samples and, additionally, we have worked with two different universities - one public and the other private - whose students have a different sociodemographic profile.
Secondly, two types of causal models have been used - linear regression and neural networks. In this regard, the recent development carried out by Pizarroso et al. (2022) has paved the way for the use of neural networks for explanatory purposes, something that was not possible before. Some previous developments allowed an understanding of the functioning of the network to some extent, but this work allows a much simpler interpretation, which is relatively similar to that of a regression model. The enormous advantage is that a neural network model does not require an a priori functional specification, but the network itself is able to automatically detect any linear, non-linear or interaction effect. This avoids omitting relevant effects that could distort the result, and is therefore an extremely useful tool for validating the results of more conventional models: any discrepancy would indicate that some significant effect has been omitted2.
This double validation, with large samples from two different universities and using different methodologies, will make it possible to verify to what extent the results are similar regardless of the university or methodological approach, which would confirm the robustness and external validity of the results.
This study is part of a research project funded by the Spanish Ministry of Science and Innovation, whose objective is to develop algorithms to anticipate academic risk situations among university students. This work focuses on undergraduate studies in Business Administration, and on the effect of the high school major on academic performance in mathematics subjects taught in the first year of the degree. This choice is justified by the fact that the first year is key, which accounts for a large number of the dropouts, and mathematics subjects are in turn those with the highest level of academic failure.
The sample is composed of 1,695 students of the BA degree, of which 8733 are students at the Universidad Complutense de Madrid (academic years from 2009/2010 to 2021/2022), and 822 at the Universidad Pontificia Comillas in the same period. The information was collected through the institutional databases of the two universities4, obtaining data on all the students enrolled in the period considered. Subsequently, the data were cleaned, eliminating incomplete records, i.e. those for which no information was available on any of the variables required for the model. The study was carried out on all the students for whom complete information was available.
As seen in Table I, there are certain differences between the two groups of students, both in the percentage of women and in the percentage of students from the science major in advanced secondary education. Differences can also be seen in the university entrance marks and in the average marks in Business Mathematics I and II. Among other factors, this is due to a high percentage of students who do not take the first exam sitting at the first university (students who have been assigned a mark of zero). However, in the case of the second university, we hardly found any students that did not sit the exam. This induces a notable bias in the average mark, and is one of the main causes of the aforementioned difference in marks, in addition to, possibly, the different percentage of students from the science major. At any event, given that the objective is not to make a comparison of performance between the two universities, we will not delve further into this particular aspect, which furthermore presents considerable complexity.
TABLE I. Sample used in the analysis
|
Sample size |
% female |
% science major |
EvAU: average mark (sd) |
Maths I: average mark (sd) |
Maths II: average mark (sd) |
U. Complutense de Madrid |
873 |
43.99% |
19.36% |
7.02 (0.77) |
2.75 (2.55) |
3.83 (3.02) |
U. Pontificia Comillas |
822 |
50.24% |
31.87% |
7.71 (0.85) |
5.33 (1.94) |
5.73 (1.76) |
Source: Compiled by author.
The R programming environment (R Core Team, 2020) was used for data processing and model building, employing the packages lmtest (Zeileis and Hothorn, 2002), lubridate (Grolemund and Wickham, 2011), lfe (Gaure, 2013), NbClust (Charrad et al., 2014), ggplot2 (Wickham, 2016), car (Fox and Weisberg, 2019), RCurl (Lang and CRAN team, 2019), caret (Kuhn, 2020), gplots (Warnes et al., 2020), dplyr (Wickham et al., 2022) and NeuralSens (Pizarroso et al., 2022).
In both samples, a linear regression model was adjusted, using the average mark in Business Mathematics I and II as a dependent variable, and the major taken at high school, the gender of the student, and his or her university entrance exam score (EvAU) as independent variables, the latter being the equivalent of the SAT in the United States, since it is the score used in the university admission process. Due to problems of heteroscedasticity, robust estimations have been used, the absence of multicollinearity problems has been verified, and standardized variables have been used.
To confirm the functional specification validity, neural network models have also been adjusted using the same variables. Historically, neural network models were not suitable for the development of explanatory models due to their black-box nature. That is, they offered good predictions, in many cases better than those of more conventional econometric models, but it was not possible to interpret them, since the effect of each variable was unknown. However, several recent studies have solved this problem. Specifically, the development of Pizarroso et al. (2022), based on the NeuralSens algorithm, allows their interpretation in a very simple manner, since the slope of each variable is obtained, which would be the equivalent of the beta in a regression model. The nuance is that, unlike regression models, where the slope of each variable is unique (a single beta), in neural networks a slope is obtained for each piece of data. This implies that each variable will have a distribution of slopes. In the absence of non-linear effects, the distribution will be very narrow and its mean value will coincide exactly with the beta obtained in a regression model. The main advantage of using neural networks over regression models is that they do not require an a priori functional specification, and any non-linear effects in the data will be automatically identified by the network, without the need for the researcher to explicitly formulate them. Thus, if the results of the neural network coincide with those of the regression model, the functional specification of the second model would be confirmed to be correct. In the event of discrepancies, the regression model would be wrongly specified and would need to be modified, probably to include some non-linear effects not initially formulated.
The results section includes the three indicators proposed by Pizarroso et al. (2022) to interpret the results of a neural network: mean sensitivity, sensitivity standard deviation and mean squared sensitivity. As already indicated, in a neural network a sensitivity or slope is obtained for each piece of data, which is equivalent to a beta in a regression model, so that a given variable has as many betas as data in the sample. In other words, instead of obtaining a value for the slope of each variable, we obtain a density function, which in the absence of non-linear relationships will have a mean sensitivity equal to the slope of the regression model. The presence of distributions with several modes or high dispersion (high values of sensitivity standard deviation) are clear indicators of the presence of non-linear effects or interactions. If detected, they would force the functional specification of the regression model to be modified5. Finally, the value of the mean squared sensitivity is the metric proposed by the authors to determine the relative importance of each of the predictors.
The main problem of neural networks is their propensity to overfitting, which is why taking certain precautions in the process of selecting their hyperparameters (number of neurons in the hidden layer and penalty or decay) is essential. In this study, we have opted for the net method, i.e. adjusting all the penalty combinations between 10-7 and 10-2, and between 1 and 10 neurons in the hidden layer. In other words, 60 different neural networks have been adjusted, selecting the one with the lowest root mean square error (RMSE) as optimal. As a precaution, the 10-folds cross-validation procedure was applied in all cases to avoid over-fitting problems.
Finally, this analysis has been complemented with an equivalent one for the subject of Business Statistics, which, in addition to being the most similar subject in terms of content among all the basic-training subjects, presents the worst results (lower mean) of all the subjects except for Business Mathematics I and II (see Annex 1).
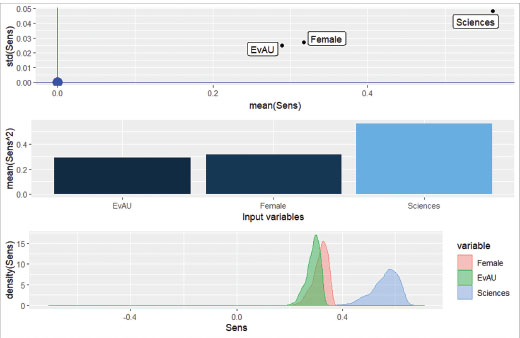
The regression model obtained for the Universidad Complutense de Madrid students presents an R2 of 0.18, and the three predictors have a positive and significant effect (alpha = 0.01). It can be seen that the major taken at high school has a considerable impact (see the left-hand side of Table II).
TABLE II. Estimates obtained by the regression model and the neural network for students at the Universidad Complutense de Madrid (average mark in Business Mathematics I and II)
|
Regression model (OLS) |
Neural network (NeuralSens) |
||||
|
Coef. |
sd |
p-value |
Mean sensitivity |
Sensitivity sd |
Mean sq. sensitivity |
Constant |
-0.25 |
0.05 |
8.6 E-8 |
|
|
|
Gender (Female=1) |
0.32 |
0.06 |
1.0 E-6 |
0.32 |
0.03 |
0.32 |
EvAU |
0.28 |
0.03 |
< 2 E-16 |
0.29 |
0.02 |
0.29 |
High school major (Science=1) |
0.54 |
0.08 |
2.0 E-10 |
0.56 |
0.05 |
0.56 |
Source: Compiled by author.
As far as the neural network6 is concerned (see the right-hand side of Table II), it does not seem to have detected non-linear effects or interactions, since the distributions are relatively narrow (Sensitivity std. deviation small, as shown in Table II) and unimodal (see bottom part of Figure I7). In fact, the coefficients estimated by the regression model are virtually identical to the mean sensitivity values obtained with the neural network (“Coef.” and “Mean sensitivity” columns in Table II). This is an indicator of the adequacy of the functional specification used in the regression model.
FIGURE I. Neural network results, including the metrics proposed by Pizarroso et al. (2022), for Universidad Complutense de Madrid (average mark in Business Mathematics I and II)
Source: Compiled by author.
The consistency of both models confirms the importance of the variable under study: the high school major has a considerable effect on performance in Business Mathematics I and II, so that those students who take the science major have a significantly higher performance than their peers that take the social sciences major.
In order to assess whether this effect extends to other related subjects, the analysis has been reproduced with the subject of Business Statistics, which is also taught during the first year and forms part of the “Basic Training” subjects which, after the two mathematics subjects, presents the worst results (lower mean) of all the subjects (see Annex 1). Given the focus of mathematics in the social sciences major, which has a greater content in statistics, it would be expected that students from this major would perform significantly better in this subject.
The results obtained are shown in Table III: on the left-hand side, the regression model, which obtains an R2 of 0.08; on the right-hand side, the neural network (3-1-1 with a decay of 0.01). Once again, both models are consistent, since the coefficients estimated by the regression model are practically identical to the mean sensitivity values obtained with the neural network. The results indicate that there are no differences (at a 1% significance level) between students from the science and social sciences major. However, at a significance level of 5%, there would be differences in favour of students from the science major. This result is even more striking than that obtained in the case of Business Mathematics I and II since, as already indicated, the social science major has a significantly higher statistics content than the science major.
TABLE III. Estimates obtained by the regression model and the neural network for students from the Universidad Complutense de Madrid (mark in Business Statistics)
|
Regression model (OLS) |
Neural network (NeuralSens) |
||||
|
Coef. |
sd |
p-value |
Mean sensitivity |
Sensitivity sd |
Mean sq. sensitivity |
Constant |
-0.20 |
0.05 |
2.7 E-5 |
|
|
|
Gender (Female=1) |
0.38 |
0.07 |
2.6 E-8 |
0.38 |
0.16 |
0.41 |
EvAU |
0.17 |
0.03 |
9.5 E-7 |
0.19 |
0.08 |
0.21 |
High school major (Science=1) |
0.19 |
0.08 |
2.5 E-2 |
0.20 |
0.08 |
0.22 |
Source: Compiled by author.
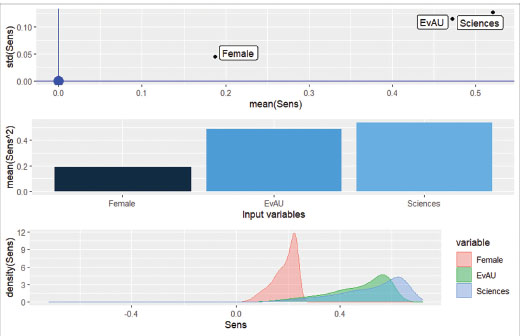
The regression model obtained for the Universidad Pontificia Comillas students (left-hand side of Table IV) has an R2 of 0.26, somewhat higher than in the previous sample, and the three predictors also have a positive and significant effect (alpha = 0.01). The optimal neural network identified (right-hand side of Table IV) presents a 3-1-1 architecture, with a decay of 0.01, somewhat lower than in the case of the Universidad Complutense de Madrid. It should be noted that the standard deviations of the sensitivities (Sensitivity sd) identified by NeuralSens are somewhat higher than in the case of the Universidad Complutense de Madrid, as can be seen in both Table IV and Figure II. This points to the possible existence of some non-linear effects in the EvAU and high school major variables8, albeit not too pronounced.
TABLE IV. Estimates obtained by the regression model and the neural network for students at Universidad Pontificia Comillas (average mark in Business Mathematics I and II)
|
Regression model (OLS) |
Neural network (NeuralSens) |
||||
|
Coef. |
sd |
p-value |
Mean sensitivity |
Sensitivity sd |
Mean sq. sensitivity |
Constant |
-0.27 |
0.05 |
7.4 E-8 |
|
|
|
Gender (Female=1) |
0.19 |
0.06 |
1.8 E-3 |
0.19 |
0.05 |
0.19 |
EvAU |
0.46 |
0.03 |
< 2 E-16 |
0.47 |
0.11 |
0.49 |
High school major (Science=1) |
0.56 |
0.07 |
2.99 E-16 |
0.52 |
0.13 |
0.54 |
Source: Compiled by author.
FIGURE II. Neural network results, including the metrics proposed by Pizarroso et al. (2022), for Universidad Pontificia Comillas students (average mark in Business Mathematics I and II).
Source: Compiled by author.
In this case, the coefficients estimated by the regression model are again very similar to the mean values obtained with the neural network (Mean sensitivity column in Table IV). It is confirmed that, in this sample, the major taken in high school again has a considerable effect on performance in Business Mathematics I and II, with students from the science major performing better than those taking social sciences.
Reproducing this analysis for the subject of Business Statistics, we obtain the results shown in Table V (regression with an R2 of 0.26 and a neural network of 3-1-1 with a decay of 0.01). We should indicate that although this exercise has been carried out for the purpose of completeness, in this case the comparison with the results obtained at the Universidad Complutense de Madrid is not appropriate for two reasons: at the Universidad Pontificia Comillas this subject is taken in the second year of the degree, which incorporates an uncontrolled effect due to the different maturity of the students, and this subject was incorporated into the curriculum in the 2015/2016 academic year, so the sample is somewhat reduced since there are no data for previous years, losing 428 records. At any event, the results of both causal models are, again, virtually identical to each other, and it is observed that the only relevant variable is the EvAU mark.
TABLE V. Estimates obtained by the regression model and the neural network for students at Universidad Pontificia Comillas (mark in Business Statistics)
|
Regression model (OLS) |
Neural network (NeuralSens) |
||||
|
Coef. |
sd |
p-value |
Mean sensitivity |
Sensitivity sd |
Mean sq. sensitivity |
Constant |
-0.04 |
0.07 |
0.57 |
|
|
|
Gender (Female=1) |
0.00 |
0.09 |
0.96 |
0.00 |
0.00 |
0.00 |
EvAU |
0.52 |
0.04 |
< 2 E-16 |
0.52 |
0.07 |
0.52 |
High school major (Science=1) |
0.12 |
0.10 |
0.21 |
0.10 |
0.01 |
0.10 |
Source: Compiled by author.
This work is framed within the difficulty of the transition of students from high school to university, particularly with regard to mathematics subjects (Gueudet, 2008, De Guzman et al., 1998). Specifically, we have studied the effect on performance in the first year of the BA degree caused by the major taken at high school. From the perspective of the onto-semiotic model (Godino et al., 2007; Godino et al., 2019), the global problem is made up of different dimensions: epistemic, cognitive, interactional, ecological, affective and mediational. The epistemic dimension, which is not the object of study in the present work, is dealt with in other studies such as that of Contreras de la Fuente (2001), focused on the epistemological obstacles that arise in mathematics subjects in the initial years of university. In contrast, this research focuses on the cognitive dimension, although the other facets may also have some influence. The aim is to contribute to a better understanding of teaching and learning processes through the identification of the factors that may explain the differences in student performance and facilitate the implementation of measures to reduce academic failure.
Two samples were taken from universities that are very different in their ecological dimension, especially in terms of the socio-demographic profile of the students, and have a larger size than used in previous research. The results indicate that the value of the coefficient relating the high school major to the average mark in Business Mathematics I and II is practically identical at both universities: 0.54/0.56 (regression model and neural network respectively) for the Universidad Complutense de Madrid, and 0.56/0.52 for the Universidad Pontificia Comillas. Taking into consideration that we have worked with two different methodological approaches and two different universities, this consistency suggests that the results are robust. The conclusion is that the major taken at high school has a considerable impact on performance in mathematics in the first year of the BA degree, with students in the science major performing better.
From the point of view of the educational pathway (interactional dimension), it is surprising that students who have taken the recommended major to study Business Administration (social sciences) are at a disadvantage compared with those who opted for a non-recommended major (sciences). This effect extends to other related subjects, such as Business Statistics, a subject in which there is surprisingly no difference between the two groups, despite the fact that the statistical workload is greater in the social sciences major. Given that the risk of academic failure is precisely concentrated in these subjects, these results invite reflection on the design of high school curricula. However, it should not be taken for granted that university programmes are not in need of revision (Ellerton and Clements, 1998).
In the cognitive dimension, a possible explanation of the result, supported by Skemp's (1976) approach, is that mathematics in the social science major has an instrumental focus, while mathematics in the science major achieves a greater relational understanding. Using the terminology of constructivist theory, relational understanding facilitates learning outcomes already achieved to scaffold new learning objectives. In this way, the zone of proximal development (Vygotsky, 1996) is expanded, so that they can be expected to understand new concepts more efficiently and achieve better results. It can be understood that an indicator of relational understanding is that there is a correlation between the student's results in one subject and those on which it is based (Gimenez et al., 2021). Therefore, in order to evaluate at least indirectly the plausibility of this explanation, in Annex II we have performed an exercise by estimating the regression models of the mark in Mathematics II against the mark in Mathematics I, and incorporating the mark in EvAU and gender as control variables. For students from the science major, the coefficient associated with the mark in Mathematics I is 0.61 and 0.56 (Universidad Complutense de Madrid and Universidad Pontificia Comillas respectively). In the case of students taking social sciences, this coefficient is lower, 0.43 and 0.44 respectively. This seems to confirm the hypothesis that students taking the science major have a better relational understanding in mathematics, and perhaps this is one of the factors that explains their higher performance in the first year of the degree.
The difficulties in learning mathematics in the first year of university may also stem from the affective dimension and its interaction with the cognitive facet (Gómez-Chacón, 2009). A second possible explanation for the results of this work, compatible with the first, is that the motivations and skills that led students to choose their high school major are related to their skills and attitudes towards abstract thinking and, consequently, to their performance in mathematics subjects. The results of Corrales Serrano (2020) support this explanation to some extent, since the personal perception of abilities and aptitudes appear as the third most important criterion for students to select their high school major (after two internal criteria on the valuation of the profession which it will give them access to).
From the point of view of teaching practice, the results of this work have two implications. Firstly, and with regard to the approach and content of mathematics during high school, it would be necessary to reflect on the social sciences major. It is interesting that students taking this major, which in general is the one recommended for BA studies, obtain worse results than those who took a major recommended for other degrees. Therefore, it seems appropriate to review the focus and content of mathematics in this major, seeking greater alignment with the requirements and needs of the related degrees. Secondly, we can reflect on teaching practice in the first year of university. As indicated, the theory of didactic suitability presented in Godino et al. (2021) facilitates the identification of criteria that contribute to good teaching practices. In the cognitive dimension, it highlights that the instructional process supports students according to their individual differences in prior knowledge and learning styles as a criterion of suitability. Therefore, better knowledge of the factors that generate differences among students facilitates compliance with this criterion. As has been shown in this work, the major taken at high school is one of these factors, the impact of which is considerable. Consequently, it seems necessary to rethink the didactic strategies in mathematics used during the first year of university. Perhaps it would be appropriate to consider the characteristics and learning style of students taking the social sciences major, adapting the teaching methodology to them.
This study has two main limitations. Firstly, the study was carried out on a single degree programme. Given that the main objective of this research was to perform a comparative analysis between two universities, it is difficult to find degrees that are sufficiently similar for such a comparison to be suitably made. Even in the case studied in this paper, the analysis of the subject Business Statistics presents the problem that it is taught in different years (first year at the Universidad Complutense de Madrid and second year at the Universidad Pontificia Comillas), which prevents direct comparison, as mentioned above. In this regard, as a future line of research, it is proposed to extend the analysis to other degrees, such as psychology or social work, degrees that are currently offered at the two universities analyzed and that include quantitative subjects in their curricula.
A second limitation is the number of universities compared. It would be desirable to extend the study to more universities, particularly in other Spanish provinces, in order to achieve a broader comparison. In this regard, it would be particularly relevant to replicate the work, using more recent samples, in those faculties in which discrepant results with those obtained in this work have been obtained, as is the case of the University of Las Palmas de Gran Canaria (Dávila et al., 2015).
Finally, it is proposed as a future line of research to study the evolution throughout the degree in other quantitative subjects, such as Econometrics and Financial Mathematics. It would be of interest to check whether the advantage that students from the science major have in the mathematical subjects in the first year is maintained or disappears in mathematical subjects in later years. The results obtained for the case of Business Statistics seem to indicate that this advantage tends to disappear: at the Universidad Complutense de Madrid, where it is taken in the first year, there are differences at a significance level of 5%, while at the Universidad Pontificia Comillas, where it is taken in the second year, there are none. However, precisely because it is not a homogeneous comparison, this conclusion is merely indicative. It would be necessary to carry out a more in-depth study that would allow a realistic comparison both within each center and between different centers.
Arroyo-Barrigüete, J. L., Tirado, G., Mahíllo Fernández, I., & Ramirez, P. (2020a). Predictors of performance in Business Administration degrees: the effect of the high-school specialty. Revista de educación, 390, 129–154. https://doi.org/10.4438/1988-592X-RE-2020-390-468
Arroyo-Barrigüete, J. L., Carabias López, S., Curto González, T. & Borrás Palá, F. (2020b). Matemáticas en el doble grado ADE-Derecho: un análisis cuantitativo de las estrategias de estudio. Bordón: Revista de pedagogía, 72(4), 27–42. https://doi.org/10.13042/Bordon.2020.80306
Charrad, M., Ghazzali, N., Boiteau, V. & Niknafs, A. (2014). NbClust: An R Package for determining the relevant number of clusters in a data set. Journal of Statistical Software, 61(6), 1–36, https://doi.org/10.18637/jss.v061.i06
Contreras de la Fuente, Á. (2001). La enseñanza del análisis matemático en el bachillerato y primer curso de universidad: una perspectiva desde la teoría de los obstáculos epistemológicos y los actos de comprensión. En IV Simposio de la Sociedad Española de Investigación en Educación Matemática (pp. 71–85).
Corrales Serrano, M. (2020). Estudio de las motivaciones internas y externas para la elección de modalidad del alumnado de Bachillerato. Incidencia en la didáctica de las Ciencias Sociales. [Tesis Doctoral]. Universidad de Extremadura. https://dehesa.unex.es/handle/10662/11076
Dávila, N., García-Artiles, M., Pérez-Sánchez, J. M., & Gómez-Déniz, E. (2015). Un modelo de regresión logística asimétrico que puede explicar la probabilidad de éxito en el rendimiento académico. Revista de Investigación Educativa, 33(1), 27–45. https://doi.org/10.6018/rie.33.1.178481
De Guzmán, M., Hodgson, B. R., Robert, A., & Villani, V. (1998, August). Difficulties in the passage from secondary to tertiary education. In Proceedings of the International Congress of Mathematicians (Vol. 3, pp. 747–762). Berlin: Documenta Mathematica.
Ellerton, N. F., & Clements, M. A. (1998). Transforming the international mathematics education research agenda. En Mathematics education as a research domain: A search for identity (pp. 153–175). Springer.
Ernest, P. (2016). An Overview of the Philosophy of Mathematics Education. En The philosophy of mathematics education (3-8). Springer Open. https://doi.org/10.1007/978-3-319-40569-8_1
Fox J., & Weisberg, S. (2019). An {R} Companion to Applied Regression, Third Edition. Sage.
Gaure, S. (2013). OLS with multiple high dimensional category variables. Computational Statistics & Data Analysis, 66, 8–18. https://doi.org/10.1016/j.csda.2013.03.024
Giménez, M. J., Borrás, F., & Carabias, S. (2021). Sesgo matemático negativo en los alumnos del doble grado en ADE y Derecho: Un análisis cuantitativo. En Universidad, innovación e investigación ante el horizonte 2030 (p. 112). Egregius.
Godino, J. D., & Batanero, C. (1994). Significado institucional y personal de los objetos matemáticos. Recherches en didactique des Mathématiques, 14(3), 325–355.
Godino, J. D., Batanero, C., Burgos, M., & Gea, M. M. (2021). Una perspectiva ontosemiótica de los problemas y métodos de investigación en educación matemática. Revemop, 3, 1–30. https://doi.org/10.33532/revemop.e202107
Godino, J.D., Batanero, C. & Font, V. (2007). The onto-semiotic approach to research in mathematics education. ZDM Mathematics Education 39, 127–135. https://doi.org/10.1007/s11858-006-0004-1
Godino, J. D., Batanero, C., & Font, V. (2019). The onto-semiotic approach. For the learning of mathematics, 39(1), 38–43.
Gómez-Chacón, I. M. (2009). Actitudes matemáticas: propuestas para la transición del bachillerato a la universidad. Educación matemática, 21(3), 5–32.
Gonzalez Veiga, M. C., Castellanos Val, L., Gonzalez De Sela Aldaz, M. A., Manzano Pérez, & I. M. (1999). Influencia del currículo previo sobre el rendimiento en matemáticas empresariales: un estudio para la universidad de Oviedo. Revista de Educación, 319, 223–238.
Grolemund, G., & Wickham, H. (2011). Dates and times made easy with lubridate. Journal of Statistical Software, 40(3), 1–25. https://doi.org/10.18637/jss.v040.i03
Gueudet, G. (2008). Investigating the secondary–tertiary transition. Educational studies in mathematics, 67(3), 237–254. https://doi.org/10.1007/s10649-007-9100-6
Jaworski, B. (1998). Mathematics teacher research: process, practice, and the development of teaching. Journal of Mathematics Teacher Education, 1, 3–31. https://doi.org/10.1023/A:1009903013682
Kuhn, M. (2020). caret: Classification and Regression Training. R package version 6.0-86. https://CRAN.R-project.org/package=caret
Lang, D. T., & CRAN team (2019). Package ‘RCurl’. URL http://www.omegahat.net/RCurl
Martínez de Ibarreta, C., Rua, A., Redondo, R., Fabra, M. E., Nuñez, A., & Martín, M. J. (2010). Influencia del nivel educativo de los padres en el rendimiento académico de los estudiantes de la ADE. Un enfoque de género. En M. J. Mancebón Torrubia, D. Pérez Ximénez de Embún, J. M. Gómez Sancho y G. Giménez Esteban (Coords.), Investigaciones de Economía de la Educación Número 5 (pp. 1273–1296). AEDE, Asociación de Economía de la Educación.
Pizarroso, J., Portela, J., & Muñoz, A. (2022). NeuralSens: sensitivity analysis of neural networks. Journal of Statistical Software, 102(7), 1–36. https://doi.org/10.18637/jss.v102.i07
R Core Team (2020). R: A language and environment for statistical computing. R Foundation for Statistical Computing. URL: http://www.R-project.org/
Skemp, R. R. (1976). Relational understanding and instrumental understanding. Mathematics Teaching, 77, 20–26.
Vygotsky, L. S. (1996). El desarrollo de los procesos psicológicos superiores. Cole, M., John-Steiner, V., Scribner, S., Souberman, E. (eds); Crítica. (Original publicado en 1978).
Warnes, G. R., Bolker, B., Bonebakker, L., Gentleman, R., Huber, W., Liaw, A., Lumley, T., Maechler, M., Magnusson, A., Moeller, S., Schwartz, M., & Venables, B. (2020). gplots: various R programming tools for plotting data. R package version 3.1.1. https://CRAN.R-project.org/package=gplots
Wickham, H. (2016). ggplot2: Elegant graphics for data analysis. Springer-Verlag.
Wickham, H. François, R., Henry, L., & Müller, K. (2022). dplyr: a grammar of data manipulation. R package version 1.0.8. https://CRAN.R-project.org/package=dplyr
Zeileis, A., & Hothorn, T. (2002). Diagnostic Checking in Regression Relationships. R News, 2(3), 7–10. https://CRAN.R-project.org/doc/Rnews/
Contact address: José Luis Arroyo-Barriguete. Universidad Pontificia Comillas. Facultad de Ciencias Económicas y Empresariales, departamento de Métodos Cuantitativos. Calle de Alberto Aguilera, 23, 28015, Madrid, Spain. E-mail: jlarroyo@comillas.edu
In order to verify the importance of Mathematics I and II in the first-year subjects, a sample of 3,279 students of the BA degree at the Universidad Complutense de Madrid was taken as a starting point. We have considered the cohorts from the academic year 2009/2010 (the year in which the current study plan came into force) until 2021/2022. A large number of records do not have information on the high school major, whether sciences or social sciences, which is why they could not be used in the main analysis. However, in all of them, there is information on the mark obtained by each student in the first exam sitting of the 10 subjects comprising the Basic Training9. The sample of 3,279 students is summarized in Table VI. Therefore, a cluster analysis has been performed considering these marks as variables.
TABLE VI. Sample used for the cluster analysis (3,279 students on the BA degree at the Universidad Complutense de Madrid): average mark in each subject
Financial Accounting I |
Fundamentals of Business Administration |
Fundamentals of Financial Administration |
Company Law |
Introduction to Economics |
4.33 |
5.21 |
3.70 |
5.29 |
4.34 |
Microeconomics |
Business Mathematics I |
Business Mathematics II |
Business Statistics I |
Economic History |
3.95 |
2.83 |
3.24 |
3.70 |
4.53 |
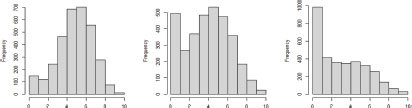
The Euclidean distance and Ward's linkage method were chosen. The grouping by subjects (vertical interpretation of Figure III), points to three different clusters, one of which is comprised of Business Mathematics I and II. The first cluster, made up of Company Law, Economic History, Introduction to Economics, and Fundamentals of Business Administration, seems to be made up of subjects of comprehension with a certain rote learning nature, whose quantitative weight is reduced or null. The second cluster is made up of Business Statistics I, Microeconomics, Fundamentals of Financial Administration, and Financial Accounting I, subjects of a quantitative nature, although not purely mathematical. The last cluster includes Business Mathematics I and II. Analysis of the average marks in each of these groups confirms considerable differences, as shown in Table VII: the average mark in Business Mathematics I and II is not only significantly lower than in other clusters, but the distribution is markedly different.
FIGURE III. Heatmap for the 10 Basic-Training subjects at Universidad Complutense de Madrid
 .
.
TABLE VII. Main statistics for the average mark in each cluster identified at Universidad Complutense de Madrid
|
Cluster 1: comprehension subjects |
Cluster 2: quantitative subjects |
Cluster 3: Business Mathematics I and II |
First quartile |
3.75 |
2.20 |
0.65 |
Median |
4.98 |
4.05 |
2.75 |
Mean |
4.84 |
3.92 |
3.04 |
Third quartile |
6.18 |
5.63 |
5.00 |
Histograms |
|
||
Table VIII shows the results of the regression model using the mark in Mathematics II as the dependent variable and the result in Mathematics I as the independent variable, including gender and the EvAU mark as control variables. In this case, we have considered the sample of students from the Universidad Complutense de Madrid, split into two groups: students from the social sciences major and students who took the science major. Table IX is identical except considering the sample of students from the Universidad Pontificia Comillas. As with the previous models, the effect of the high school major is remarkably similar in both samples. It is observed that, in the case of students from the science major, the effect of the mark in Mathematics I is higher than for students from the social sciences. This seems to confirm, at least indirectly, the hypothesis that students from the science major have a better relational understanding of mathematics.
TABLE VIII. Regression model for the variable Mathematics II (Universidad Complutense de Madrid), distinguishing by high school major
|
High school major: sciences (R2 = 0.45) |
High school major: social sciences (R2 = 0.27) |
||||
|
Coef. |
sd |
p-value |
Coef. |
sd |
p-value |
Constant |
-0.15 |
0.07 |
3.5 E-2 |
-0.08 |
0.04 |
8.0 E-2 |
Gender (Female=1) |
0.45 |
0.13 |
4.9 E-4 |
0.17 |
0.07 |
1.2 E-2 |
EvAU |
0.00 |
0.06 |
9.6 E-1 |
0.13 |
0.03 |
2.8 E-4 |
Mark Mathematics I |
0.61 |
0.06 |
< 2 E-16 |
0.44 |
0.03 |
< 2 E-16 |
TABLE IX. Regression model for the variable Mathematics II (Universidad Pontificia Comillas), distinguishing by high school major
|
High school major: sciences (R2 = 0.39) |
High school major: social sciences (R2 = 0.36) |
||||
|
Coef. |
sd |
p-value |
Coef. |
sd |
p-value |
Constant |
-0.01 |
0.07 |
8.6 E-1 |
-0.07 |
0.05 |
1.7 E-1 |
Gender (Female=1) |
0.03 |
0.10 |
7.9 E-1 |
0.14 |
0.07 |
5.8 E-2 |
EvAU |
0.13 |
0.05 |
1.5 E-2 |
0.24 |
0.04 |
1.8 E-8 |
Mark Mathematics I |
0.56 |
0.07 |
1.4 E.15 |
0.43 |
0.04 |
< 2 E-16 |
_______________________________
1 Annex 1 of this paper includes a cluster analysis, which shows that in the “Basic Training” subjects of the first year, mathematics exhibits behaviour that is clearly different from that of other subjects, while also presenting significantly higher levels of academic failure.
2 As this development is brand new, it is currently not possible to use the neural network model alone, since the authors of NeuralSens have not yet proposed hypothesis tests to determine when a variable is significant. This is why, in its current state, its main use in the social sciences is to validate the functional specification of conventional econometric models.
3 The initial sample consisted of a significantly larger number of students (see Annex 1), but many of them were eliminated from the study because there was no information available on the major studied at high school. The same happens in the sample from Universidad Pontificia Comillas, since there is no information on the high school major prior to the 2012/2013 academic year.
4 Integrated Institutional Data System (Sistema Integrado de Datos Institucionales—SIDI) of the Universidad Complutense de Madrid (UCM), and General Secretary's Office of the Universidad Pontificia Comillas.
5 The detection of these effects is very important since previous research has detected non-linear effects or interactions in mathematics performance. Thus, for example, the work of Arroyo-Barrigüete et al. (2020b) identified that among the students of BA-Law double degree, there was a group of students (around 30%), with a strong bias towards law, who used a rote learning approach to mathematics. This translated into an absence of correlation between performance in mathematics subjects, i.e. their performance in Mathematics II was not related to that obtained in Mathematics I, while, for the rest of the students the correlation was logically very strong. This type of possible interaction, which a priori are not easy to identify, are precisely those that the neural network model would allow us to detect.
6 The optimal neural network identified presents a 3-1-1 architecture, with a decay of 10-4. The fact that we only find one neuron in the hidden layer is already a first indication that there are probably no complex non-linear effects.
7 Figure I shows the results of the neural network sensitivity analysis performed with NeuralSens. It is divided into three parts: the lower window shows the distribution of the slopes (sensitivity) of each variable; in the middle window we find the mean squared sensitivity for each variable, which, as already indicated, allows us to determine the relative importance of each of the predictors; the upper part shows the mean sensitivity and the sensitivity standard deviation of each variable, which are precisely the values shown in Table II.
8 It might be appropriate to include a quadratic term for EvAU in the regression model. However, for the sake of comparability with the model of the Universidad Complutense de Madrid, it has been decided not to do so.
9 Non-attendance at the exam sitting equates to a mark of 0 for the subject.