Grants programme and tuition fees policy in the Spanish public university system: is it really effective?
La política de becas y precios públicos en el sistema universitario español, ¿es realmente eficaz?
https://doi.org/10.4438/1988-592X-RE-2022-398-555
Mónica Martí Sempere
https://orcid.org/0000-0001-6750-6530
Carmen Ródenas Calatayud
https://orcid.org/0000-0001-6134-5705
Universidad de Alicante
Abstract:
University policy plays a fundamental role in reducing social inequalities. The purpose of this paper is to assess whether the strategy of geographical expansion of universities, in addition to the financial aid and tuition fees policy in Spain guarantee that people with insufficient economic resources can access and complete university studies. To do this, we analysed the territorial proximity of the university offer to the place of residence of potential students, using the Population Register, and compared the income thresholds for access to the state grants programme with the median and poverty line of the household income distribution, using the Statistics on Income and Living Conditions. The analysis reveals that the wide geographical spread of public university campuses facilitates access to higher education for a significant percentage of young people. However, the study also shows that while the tuition fee exemption grant is available to students from any household ranging from vulnerable to those with incomes close to the median, other grants, which are essential to avoid student dropout, do not even reach all households at risk of poverty. Moreover, their average amount is insufficient to compensate for the opportunity cost of studying. This result contrasts with a tuition fees policy that subsidises the enrolment of all students, including those living in middle- and high-income households. This subsidy also presents notable differences between autonomous regions that are not justified by the divergences in the income levels of households in the region. The paper concludes by pointing out the advisability of a joint review of the current grants programme and tuition fees policy.
Key words: University policy, university grants, tuition fees, social inequalities, poverty
Resumen
La política universitaria juega un papel fundamental en la reducción de las desigualdades sociales. El propósito de este trabajo es evaluar si la estrategia de expansión geográfica de la oferta educativa, la política de becas y ayudas y el sistema de precios públicos en España garantizan que las personas con recursos económicos insuficientes puedan acceder y culminar los estudios universitarios. Para ello, se analiza la proximidad territorial de la oferta al lugar de residencia de los estudiantes potenciales de acuerdo con la distribución de la población y se comparan los umbrales de ingresos para acceder al sistema de becas estatal con la mediana y la línea de pobreza de la distribución de la renta entre los hogares a partir de la Encuesta de Condiciones de Vida. El análisis revela que el amplio despliegue geográfico de campus públicos facilita el acceso a la educación superior a un porcentaje notable de la población joven. Sin embargo, el estudio muestra que, mientras que de la beca de exención de matrícula pueden beneficiarse desde los estudiantes que residen en hogares vulnerables hasta aquellos con rentas cercanas a la mediana, el resto de ayudas, imprescindibles para evitar el abandono, no alcanza siquiera a todos los hogares en riesgo de pobreza, y su importe medio es insuficiente para compensar el coste de oportunidad de estudiar. Este resultado contrasta con una política de precios públicos que subvenciona la matrícula a todos los estudiantes, incluidos los que residen en hogares con rentas medias y altas. Una subvención que, además, presenta notables diferencias por comunidad autónoma que no se justifican por las divergencias en los niveles de renta de los hogares de la región. Se concluye señalando la conveniencia de una revisión conjunta del actual sistema de becas y precios públicos.
Palabras clave: política universitaria, becas universitarias, tasas universitarias, desigualdades sociales, pobreza
Introduction
There are many studies that support the benefits of higher education in reducing social inequalities. Firstly, they point out that higher education broadens the opportunities for better wages and working conditions (Bartscher, Kuhn & Schularick, 2020). In addition, the effort and personal achievement of completing a degree neutralises the discriminatory effects of social origin which continue to affect the rest of the population (Fachelli, Torrents y Navarro-Cendejas, 2014). Secondly, higher education reduces the likelihood of downward mobility on the social ladder, especially in adverse economic contexts. Higher educated individuals find it easier to hold on during these periods, as they typically earn higher incomes and accumulate more wealth (Pastor y Pérez, 2019; Cantó & Ruiz, 2015). In fact, people with higher education tend to be at the top of the income distribution (Pastor y Pérez, 2019). There are fewer unemployed higher educated people as, in general, they enjoy better working conditions, lower rates of precariousness and lower average periods of unemployment, since they develop a better job search strategy and have more opportunities due to their qualifications (Goerlich & Miñano, 2018). Higher education is thus submitted as a resilience factor in the face of adversity, reducing the risk of poverty and social exclusion.
Improved education also has very positive effects on other facets of wellbeing (Münich & Psacharopoulos, 2018; Pastor y Pérez, 2019) and, through intergenerational transmission, extends its effects over time, because, as Pastor and Pérez (2019, p.209) and the OECD (2018, p.14) point out, children with higher educated parents, ceteris paribus, are more likely to achieve this level of education as well. Thus, the more university graduates a society has, the higher the proportion of people who will receive higher education in future generations.
On this basis, it is reasonable that the OECD (2018) identifies actions in education, and in particular in higher education, as the first key policy to reduce inequalities. Such actions should ensure equal opportunities in access and should prevent the risk of university dropout for economic reasons. Thus, for example, a wide network of university campuses can serve to geographically approximate the educational offer to the population. In addition, an appropriate undergraduate pricing policy combined with an effective grants programme can reduce the cost of tuition fees. Finally, a programme of additional financial aid to pay the costs of pursuing studies (transport, accommodation, meals or study materials) or to compensate for the potential lack of contribution to the family economy by devoting time to studies, can prevent university dropout (Hernández y Pérez, 2019).
Despite the consensus on the desirability of these measures, there is little research quantifying whether the policies adopted are sufficient, whether they have any unintended side-effects, and even whether they are more or less efficient than others. In this regard, it is worth highlighting the following three studies. The first is the AIRef (2019) report which assesses the effectiveness of the state grants programme for equal opportunities using data from the Integrated University Information System. The second is the research by Valdés (2018) which not only synthesises the results of Spanish studies on the impact of grants on enrolment and academic performance, but also analyses the social background of students on the basis of average family income and income thresholds for receiving financial aid. Finally, the paper by Pérez-Esparrells and Jodar (2017) addresses the spatial analysis of differences in tuition fees across Spanish regions.
Our aim is to verify whether the actions designed to promote university education in Spain guarantee that people with insufficient economic resources can access and complete these studies. This requires an analysis of the Spanish Public University System, as the prices of private universities, logically, deter potential students with lower incomes. To do this, the paper attempts to answer three main questions. First, to find out whether there is a relationship between grant recipients and household income level. Second, the role of the geographical extension of the public university campus network is analysed in order to assess geographical equity in access to higher education. Finally, the study focuses on the public pricing policy and the state grants programme to evaluate the adequacy of both the former and the maximum income thresholds for accessing grants, given the current income distribution in Spain.
An exhaustive analysis would also require a review of the student grants offered by the different autonomous regions and universities, but this would take us beyond the initial purpose. Moreover, most of these institutions develop a fairly similar strategy and the amounts allocated to them are very modest in relation to the state grants programme. For this reason, we will only focus on the General State Administration (Administración General del Estado -AGE-)1 grants and, occasionally, we will refer to some of the measures developed by some regions to complement the national plan.
With respect to previous research, we contribute to understanding the association between grant beneficiaries and household income levels by using information from a single statistical source, the Spanish Statistics on Income and Living Conditions (SILC) form the National Statistics Institute (Instituto Nacional de Estadística -INE-). We also use this source to establish the conditions for an appropriate comparison of household income with both poverty thresholds and the eligibility criteria in order to be a grant-holder. We also estimate the percentage of young people who have geographical access to higher education based on their distribution by metropolitan areas according to the Population Register (Padrón Continuo de Habitantes). From a spatial perspective, we also analyse the relationship between the average cost of enrolment and regional income.
The structure of this paper is as follows. After this introduction, the first section describes the methodology used. The second section is devoted to the presentation of the results obtained in order to answer the three questions raised. Finally, the paper closes with a discussion of the results and final reflections.
Methodology
Data
The main statistical source used in the paper is the Spanish SILC. In this survey, the information on household disposable income is obtained by combining the information provided by the respondent with files from the Tax Agency (Agencia Tributaria), which is also the source used by the AGE for awarding grants. The year prior to the interview represents the reference period for this variable. As the most recent available survey at the time of this study was the SILC-2020, the analysis has been conducted for the academic year 2020/21. The income period used for the awarding of grants in that academic year is 2019, the same as the one provided by the SILC-2020.
On one occasion, we also use information from the Population Register (1 January 2020), from which population data at a municipal level has been drawn to calculate the population by metropolitan areas and to evaluate geographical equity in access to higher education.
Procedure
The procedure followed to answer each of the questions raised is as follows:
Grant recipients and household income level
To evaluate this association, the distribution of young university students, grant recipients, and amount received by household income level has been analysed graphically. The income concept used is that of Disposable Household Income (DHI) per Equivalent Consumption Unit (ECU). This is the standard way in which EUROSTAT and the OECD correct for the existence of economies of scale derived from household composition. The modified OECD scale, which gives a weight of one to the first adult, 0.5 to other adults and 0.3 to children under 14 years of age, was used to obtain the DHI per ECU.
Extension of the public university campus network
The Spanish Public University System has 50 universities (one of which is open – the UNED- and two of which are special -the UIMP and the Universidad Internacional de Andalucía-). The information on degrees offered and the list of the different university campuses has been drawn from the university websites. With this information, we first drew up a map showing the location of each one of them, as well as the campuses created in those provinces that do not have their own university. Secondly, to asses proximity in terms of population, we have used the list of metropolitan areas and provincial capitals as a starting point. As there is no official delimitation of metropolitan areas in Spain, we have used the areas estimated by Feria and Martínez2 (2016) based on 2011 census data on residence-work mobility. This is a delimitation that is consistent with our purposes as we consider the university campuses to be the students’ place of work. From this list we have selected the metropolitan areas and provincial capitals in which there is at least one campus offering bachelor’s degrees in a minimum of three branches of knowledge. The assessment was carried out by calculating the percentage of young people between 18 and 24 years of age residing in these areas out of the national total according to the Population Register.
The public pricing policy and the state grants programme
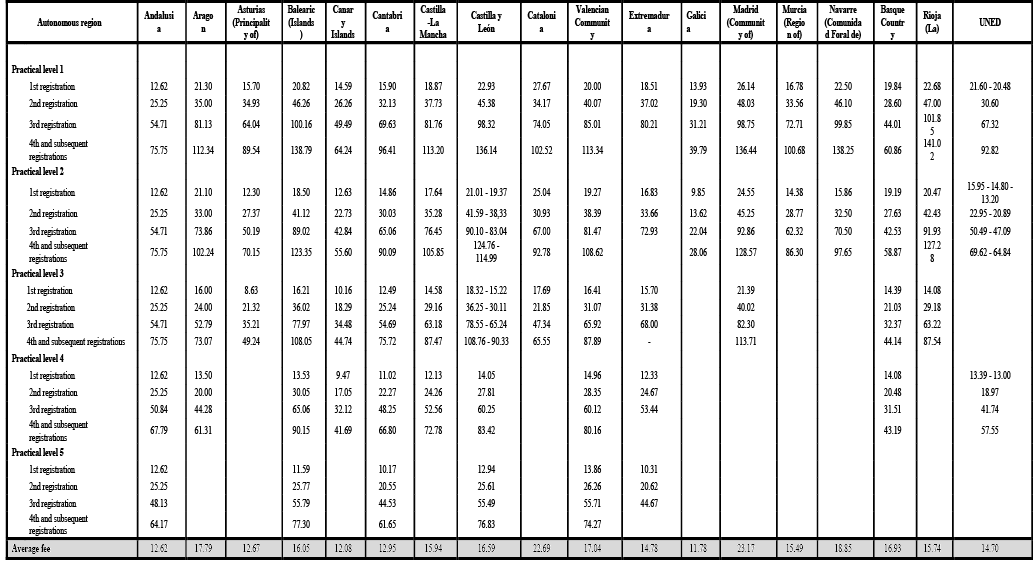
Tuition fees are considered as public prices according to Law 8/1989, of 13 April, on Fees and Public Prices (Tasas y Precios Públicos). This means that they must, at least, cover the cost of carrying out the activity. However, the Law also states that lower prices can be set when there are reasons that make it advisable to do so. In accordance with Organic Law 6/2001, of 21 December, on universities, modified by Royal Decree-Law 14/2012, of 20 April, these prices are set by each autonomous region, which, according to its criteria, also establishes the number of the different practical levels (experimentalidad), then assigns a practical level for each degree and, finally, determines the price increase between each practical level and between the first and successive registrations. The price per credit does not depend on the economic situation of the student but on the region where he/she lives, the practical level of degree and the number of times he/she has enrolled for the same subject. In order to facilitate the comparison between regions, the analysis of equity from a geographical point of view has been conducted using the average price per credit for first-time enrolment in Bachelor’s degrees calculated by the Ministry of Universities (see annex). The analysis has been completed with a comparison regarding tuition fees burden for families, calculating the proportion that this cost represents, based on the average price, out of the median DHI per ECU in each region.
In order to find out whether the maximum income thresholds for accessing grants are appropriate, their level has been compared with the median DHI per ECU. These thresholds can be found in table I with the corresponding grant modalities. If the household income is below threshold 3 (maximum), it can obtain tuition fee exemption and an amount between €50 and €125 linked to academy excellence. If it is below threshold 2 (medium), the applicant can also receive a variable amount that results from the weighting of the average academic record of his/her transcript and his/her family income (minimum €60), and if the student needs to reside far from the family home, a fixed amount of €1,600 is awarded. Finally, if the household income does not reach threshold 1 (minimum), the AGE adds a fixed amount to the tuition fee compensation, which is equal to €1,700 in the academic year 2020/21. Without going into further details, this brief description of the programme shows that it is not a simple scheme.
TABLE I. AGE need-based grants according to DHI
|
DHI thresholds, academic year t/t+1 |
Type of grants |
|
DHI (year t-1) < Threshold 1 (minimum) |
Tuition fee exemption Fixed amount associated with income Fixed amount associated with residence, if applicable Variable amount linked to income and academic record Amount linked to academic excellence |
|
Threshold 1 < DHI (year t-1) < Threshold 2 (medium) |
Tuition fee exemption Fixed amount associated with residence, if applicable Variable amount linked to income and academic record Amount linked to academic excellence |
|
Threshold 2 < DHI (year t-1) < Threshold 3 (maximum) |
Tuition fee exemption Amount linked to academic excellence |
Source: Royal Decree 1721/2017, of 21 December.
Each year, the Secretary of State for Education publishes a resolution updating the applicable amounts corresponding to each threshold, depending on the number of household members, for that academic year. The Resolution of 31 July 2020 contains the thresholds for the academic year 2020/21.
Our analysis has been undertaken for the most common household sizes, between one and four members (94.1% of households in the survey). Furthermore, for the sake of comparison, we have expressed the AGE income thresholds in terms of ECU. For this purpose, the OECD equivalence scale has again been used, assuming on this occasion that all household members are over 14 years of age. In this way, the difference obtained between the two variables will always be the minimum possible.
The analysis starts with the comparison of income thresholds 3 which give access to tuition fee exemption, followed by that of thresholds 1 and 2 which give access to the aid programme for lower-income students. In the latter case, these thresholds are also compared with the cut-off established to consider a household to be at risk of poverty, that is, when the income is less than 60% of the median DHI per ECU.
Results
Grant recipients and household income level
Figure I shows the proportion of young university students out of the total number of population aged 18 to 24, distributed by decile according to the level of DHI per ECU. It also displays the proportion of grant recipients out of the total number of university students in each decile and, finally, the median amount received. Apart from the general, academic and wealth requirements for grants eligibility from the AGE, the student’s household income must not exceed the aforementioned thresholds. Figure I also shows the decile to which these thresholds belong for the academic year 2020/213.
In this figure, we can observe a positive relationship between income and the percentage of university students. However, the association between income level and the proportion of students on a grant is very limited, and only appears from the fifth decile onwards. In fact, precisely in the left tail of the income distribution (deciles one to three) there is no clear relationship between the two variables. We can also observe that the fact that the income thresholds are in the second decile (threshold 1) or in the fifth decile (threshold 2 and threshold 3) does not seem to result in an appreciable correction in the percentage of beneficiaries, nor in the amount received.
FIGURE I. Proportion of young university students, grant recipients and median amount received by income deciles
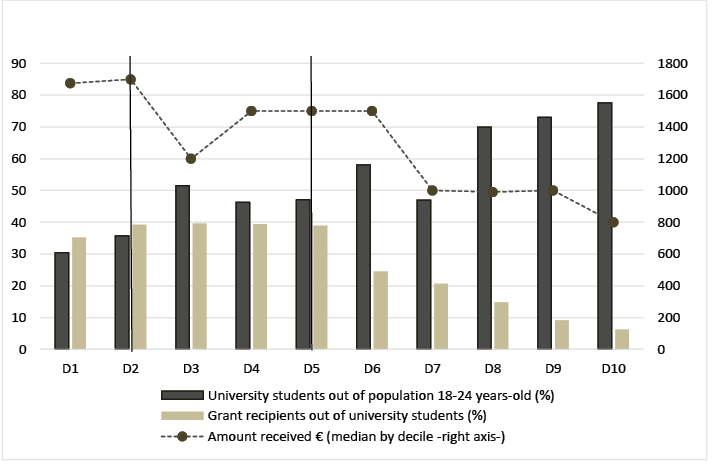
Source: Own calculations based on Spanish-SILC microdata (2020).
Extension of the public university campus network
Figure II shows the location of each of the Spanish public universities and also indicates the universities that have created a campus in those provinces that do not have their own institution. The map reveals that there is at least one campus in each province, including the two autonomous cities of Ceuta and Melilla.
FIGURE II. Spanish public universities
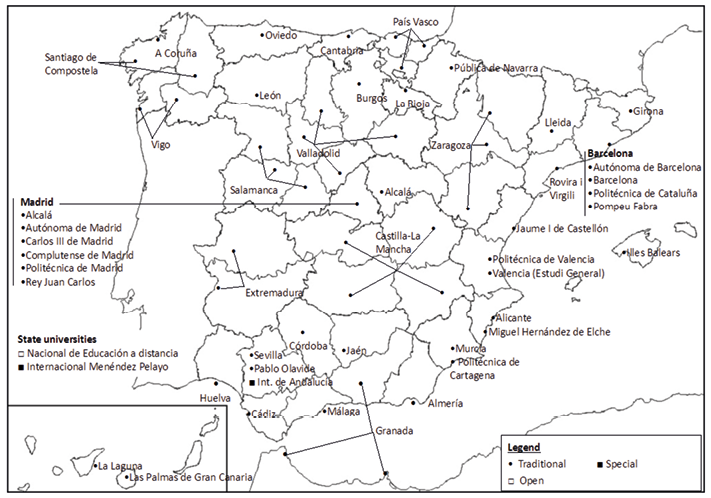
Source: Own elaboration based on infographic on the Ministry of Universities website.
As explained in the methodology, in order to estimate the real proximity of potential students to the university, we calculate an impact indicator regarding the spatial distribution of the campuses on the population by metropolitan areas. This indicator is the percentage of young people between 18 and 24 years of age living in a municipality or metropolitan area where there is at least one campus offering bachelor’s degrees in a minimum of three branches of knowledge. According to the Population Register (1 January 2020), this percentage is equal to 72.45%.
The public pricing policy and the state grants programme
The results of the equity analysis of public prices from a geographical point of view are shown in figure III. It can be seen that the tuition cost for a full academic year (60 credits) ranges from €706.8 in Galicia to €1,390.2 in Madrid, which means that studying in this region costs 97% more than in Galicia.
In the figure we can also observe an indicator of the effort involved for households in paying tuition fees, approximated as the proportion that this cost represents out of the median DHI per ECU in each region4. To adjust the estimation correctly, the medians have not been calculated on the complete income distribution of all households but only of those households that do have to pay the tuition fees because they do not meet eligibility economic criteria, i.e., households with income per ECU above threshold 3.
FIGURE III. Average price of initial enrolment fee for bachelor’s degrees and financial burden on DHI per UCE (median) in each region. Academic year 2020/21
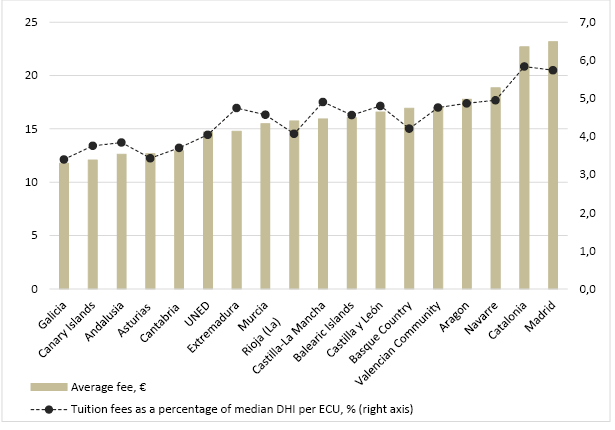
* In the case of UNED, the calculation is based on the national median.
Source: Ministry of Universities and own calculations based on Spanish-SILC microdata (2020).
Obviously, if the tuition cost were proportional to the median regional income, we would expect a straight line in figure III, which is not the case. Moreover, the positive and significant value of the Pearson correlation coefficient, which is 65%, calculated between the average credit price and the median DHI per ECU, confirms this assessment.
Regarding the adequacy of the thresholds for access to grants, figure IV presents the income thresholds 3 for obtaining tuition fee exemption by household size, from one- to four-members, established by the AGE for the academic year 2020/21, also expressed in terms of ECU. The median household income per ECU in 2019 is also presented.
FIGURE IV. AGE income threshold 3 by household size. Academic year 2020/21
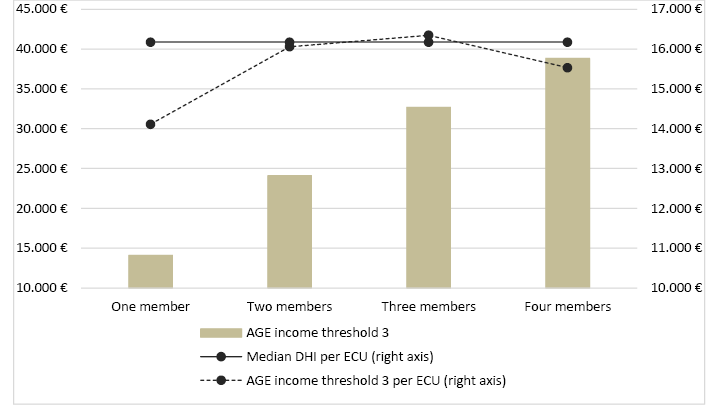
Source: Resolution of 31 July 2020 Secretary of State for Education and own calculations based on Spanish-SILC microdata (2020).
It can be observed that the AGE threshold per ECU is not stable and that, for one- and four-member households, it is below the median income, at 14 and four per cent, respectively.
The income thresholds 1 and 2 for additional grants by household size are shown in figure V. They are also displayed in terms of ECU. It can be seen that threshold 1 is stable this time, but it is always below the threshold for a household to be considered at risk of poverty, by more than 13%. Threshold 2, however, varies again. It is around the level of median income for two- and three-member households, while for one- and four-member households it is 18% and 10% lower, respectively.
FIGURE V. AGE income thresholds 1 and 2 by household size. Academic year 2020/21
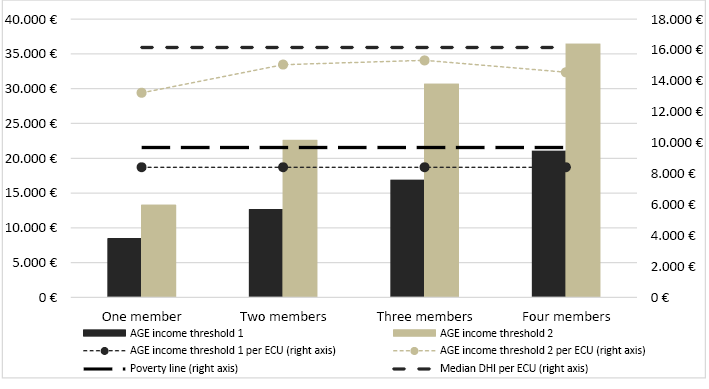
Source: Resolution of 31 July 2020 Secretary of State for Education and own calculations based on Spanish-SILC microdata (2020).
In some regions, to mitigate the shortage of resources faced by university students whose household income is below threshold 1, regional governments launch their own grants programmes. Among them, the salary grants of the Valencian Community stand out for the support amount of €6,000 for each student who meets the requirements5. The aim of these grants is to alleviate the situation of households in more precarious conditions by increasing the amounts received. For this reason, it is not incompatible with the fixed-amount grant from the AGE. In the event that the student is a beneficiary of the latter, he/she will receive any remaining amount needed to reach €6,000, as a regional supplement.
However, the income requirement for these salary grants is stricter than at the national level, as can be seen in figure VI. It can also be seen that, in terms of ECU, the threshold established for the salary grant is not independent of the size of the household, unlike the AGE thresholds 1 which is always the same. Inexplicably, the cut-off income in the Valencian Community is more severe (lower) as the number of household members decreases.
FIGURE VI. AGE income thresholds 1 and salary grant thresholds in the Valencian Community (VC) by household size. Academic year 2020/21
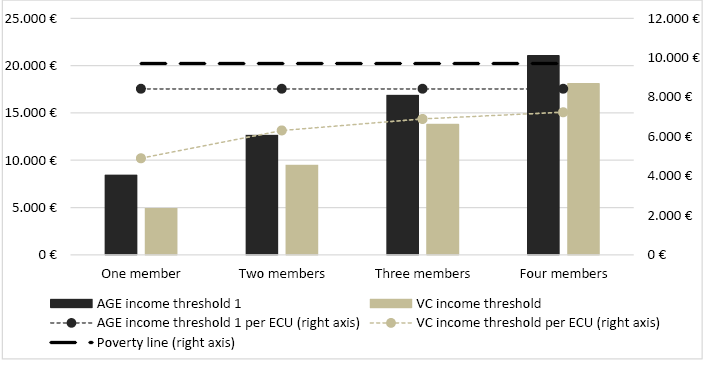
Source: Resolution of 31 July 2020 Secretary of State for Education and own calculations based on Spanish-SILC microdata (2020).
Discussion
Grant recipients and household income level
If university policy measures to promote equity were really effective, the number of students taking courses and completing higher education would be independent of the economic level of their households. However, this is not the case in Spain, even nowadays, as Pastor and Pérez (2019, p.209) recently show with data from the latest available Population Census of 2011. They use a probit model to estimate the degree of dependency, in particular in relation to the level of household wealth (basically, whether or not the household owns a dwelling). Our study, based on the SILC-2020, allows us to analyse this relationship almost ten years later using household disposable income, a variable that is more accurate than that of wealth limited to home ownership. Furthermore, we analyse young people studying at university at the time of the survey and not, like Pastor and Pérez, a population that has completed their studies. Lastly, we can distinguish whether or not they are grant beneficiaries.
Despite this, figure I still shows an increasing relationship between income and the percentage of university students. It may be surprising that from the fifth decile onwards, where no one should receive need-based grants, the SILC observes that there are still beneficiaries and that, moreover, the median amount of support does not clearly decrease in the higher income deciles. However, this can be explained by the fact that the survey has allocated all types of grants (need-based) and scholarships (merit-based) to a single variable. This means that, for example, Erasmus scholarships or collaboration scholarships, awarded independently of the household income level, have also been included here.
This would justify the existence of support beneficiaries in the right tail of the distribution in figure I, but not what happens in the left tail, in the lower income deciles. The percentage of beneficiaries does not increase appreciably as income decreases, although almost all the funds assigned to the Spanish grants and aid programme are aimed at the state need-based grants programme. According to the Ministry of Universities data for the academic year 2018/19, this type of financial aid accounts for 88% of the beneficiaries and almost 93% of the total amount awarded.
Therefore, the measures established are not fully satisfying their intended purpose. This is not necessarily due to a lack of resources. Spain’s expenditure per student in relation to GDP is somewhat below the OECD average (1.42%) but identical (1.25%) to that of the EU-23 (OECD, 2020). Thus, what we should focus on is the design of the measures implemented.
Extension of the public university campus network
The Spanish regional governments have the competence to create a public university or authorise the creation of a private one. As a result of these decisions, which have been more political than academic, the geographical expansion of higher education has developed following a provincial strategy. The regions chose to bring the universities to the students, rather than the students to the universities (Villar, 2020, p.117). Although we are not going to evaluate this here, we can see in figure II that the physical proximity of the public university offer to young people’s place of residence has been achieved with this option.
For Hernández and Pérez (2019, p.17), accessibility to university education services for the young population in Spain is guaranteed as the number of public universities ensures the presence of one university for every 24,000 potential students, and one public or private university for every 15,000. Therefore, in their opinion, Spain has a range of university institutions comparable to that of other developed countries. However, this aggregate calculation does not take into account proximity to campuses.
In contrast, the AIRef report (2019, p.57) does take proximity into account when it estimates that 62.9% of non-grant holders (57.9% of grant holders) reside within 20km of their family home. This result seems to indicate that proximity is a characteristic of our university system. However, this calculation of the distance between the family home and the university presents a possible bias, as the calculation was made on the basis of an on-line survey of students to which only 0.9% of the target population responded.
This weakness is not present in our indicator which is based on metropolitan areas and the Population Register. According to our calculations, an increase in the cost of university studies as a result of living far from a campus only affected 27.55% of young people. This percentage represents the maximum value, depending on whether or not the student decides to move. This decision will be conditioned by the communications network, the cost of transport, the existence of other smaller campuses in the province that satisfy the student’s interests or the preference for distance learning, such as that offered by the UNED. In other words, living far from the main campuses will not always mean a significant increase in the cost of university studies.
Therefore, and according to our results, we can state that Spain has a sufficiently extensive network of public university campuses to guarantee accessibility and proximity to higher education services for a significant percentage of the young population.
The public pricing policy and the state grants programme
It is reasonable to think that the benefits of university education in reducing social inequalities, outlined in the introduction, might be the justification for setting public prices well below the cost of the educational service6. This implies a subsidy that benefits all students in a linear way, regardless of their economic situation.
In addition to this first equity problem, students benefiting from tuition exemption grants face further equity issues. We have found (figure IV) that there is unjustified discretion in the determination of threshold 3 according to household size, which can be set at or above the median household income when it is expressed in terms of ECU. As a result, tuition fees are only payable for students whose household income is equal to or above the median income in two- and three-member households, while for the rest of the households the limit is below or well below. In any case, this payment is also subsidised through the public price policy, with no academic or financial requirements for the student.
This result contrasts, moreover, with that of Valdés (2018, p.106-107), for whom the low coverage rate of students on grants out of the total number of university students is not due to the presence of overly restrictive income thresholds. This idea is inferred from the fact that the average income of four-member households in 2013 was below the income threshold 3. In our opinion, that comparison has certain drawbacks that we have tried to avoid. First, like EUROSTAT and the OECD, we compare median income and not means. Second, we do not take a given household size as a reference (Valdés analyses a household of four members which only accounts for 17.2% of Spanish households in 2021, according to the INE), but the results are provided for different household sizes in terms of ECU, the standard indicator of the aforementioned organizations.
In our case, the income threshold 3 per ECU is below, not above, the median for four-member households; at almost the same level, not above, for two- and three-member households; and finally, it is well below in the case of one-member households, which means that the generosity to which Valdés (2018) refers is not present.
From the point of view of geographical equity, many regions took advantage of the Royal Decree-Law 14/2012 to significantly raise tuition fees. This rise was not justified by an increase in the cost of providing the service nor by an improvement in its quality, but only responded to the regional governments’ objective of reducing public expenditure by cutting public funding to universities and shifting a greater percentage of the costs of education onto students. Recently, Organic Law 6/2001 has been amended again7, returning it to its original wording, with the aim of reducing inter-regional differences. But, for the time being, as shown in figure III, the differences are still substantial.
While Pérez-Esparrells and Jódar (2017) quantify intra- and inter-regional differences, our research adds the analysis of the relationship between the average fee per enrolment credit and the income of the households that actually have to pay the tuition fees to this spatial perspective; that is, we focus on households with incomes per ECU above threshold 3. In that analysis, we have found that fee differences between regions are not justified by differences in income levels. As shown in figure III, the increase in the average fee is associated, in general, with a higher relative financial effort for households. In this sense, Catalonia leads the ranking of regions in terms of the level of effort, which represents 5.8% of their median income, followed by Madrid with 5.7%. Meanwhile, at the opposite end of the ranking, the lowest ratio of tuition fees to median income is experienced by Galician families with a percentage of 3.4%. However, with respect to Catalonia, it should be noted that since the academic year 2012/13, it has mitigated this effort through the so-called equity grants, which involve applying differentiated prices according to household income level.
In this way, the system of public prices not only fails to favour interpersonal equity, but it also damages equity on an inter-territorial level. Therefore, the system requires a coordinated reflection between regions to try to ensure that neither type of inequity occurs. A system of public prices that varies according to the student’s household income, such as the Catalan equity grants, is a possibility that has only timidly and occasionally been raised at the national level [e.g. in Consejo de Universidades and CGPU (2010, p.42) and in Hernández and Pérez (2019, p.32)]. As explained in Gil and Carta (2017), designing such a system is perfectly possible while at the same time respecting the autonomy of each region. In addition, the experience of the universities’ grant management units, which can have direct access to data on applicants’ household income and wealth tax returns, at present makes their implementation feasible.
Regarding the rest of the grants, when we work in terms of ECU, we can compare the position of the official poverty line in relation to income threshold 1 and 2, which are the levels at which the grants programme is most powerful. This is the novelty of figures V and VI, compared to other works. We found that, although threshold 1 does not depend on the household size, it is 13% below the line at which a household is considered to be at risk of poverty (figure V). This means that the fixed amount of €1,700 per academic year in 2020/21 does not even reach all the worst-off households.
Again, threshold 2, like threshold 3, depends on the household size in terms of ECU. It is below or well below the median (one- and four-member households), leading to the conclusion that its level is not particularly generous. In addition, entitlement to a variable amount because household income does not exceed threshold 2 will also depend on the student’s academic performance, available budget and the competitive concurrence of beneficiaries. Perhaps, demanding academic excellence in family contexts where the conditions for study are not very or not at all favourable, makes this requirement an added difficulty compared to the rest of the students.
Among the regions that establish complementary grants for those students who more vulnerable (household income below AGE threshold 1), the Valencian Community’s salary grants stand out for the amount awarded. In figure VI, we saw that, if the AGE grants do not protect all households at risk of poverty, the salary grants of the Valencian Community can only be received by students from households with even lower incomes. In fact, the regional threshold is 49% below the national poverty line for one-member households and 25% below for households with four members. Therefore, in the case of the generous Valencian Community’s salary grants, could also be significant pools of households in poverty that would not be able to access them.
Finally, the insufficient amounts awarded to the beneficiaries of the grants should be highlighted. In fact, the average annual support amount of €2,550.4 (threshold 1) and €1,050.4 (threshold 2), such as those actually awarded in the academic year 2017/2018 (Hernández and Pérez, 2019), cannot cover all the costs involved in the decision to continue studying for a degree. These support amounts represent 29.7% (threshold 1) and 12.2% (threshold 2) of the monthly inter-professional minimum salary set for 2018. It is not surprising that with this insufficient funding, grant recipients are forced to spend part of their time doing paid work to supplement their resources. Thus, it is no longer possible to speak of equality of conditions and opportunities8.
It is true that the range of grants and financial aimed at preventing students from dropping out of university does not end here, as both regions and universities can also provide some additional support to the students on an ad hoc basis. However, the complexity of the current support system, which can involve up to three different administrations, probably discourage applications. This is also caused by the uncertainty regarding the final amount received and the timing of its resolution. The deadlines are often too long, as the decision depends on the decision of the higher administrations, as they are incompatible with each other. This can mean that, in the end, the universities’ own grants can end up being awarded nearly one year later at the beginning of the following academic year, thus failing to cover the student’s needs.
Final reflections
Given these results, a joint review of the current tuition fees policy and grants programme is advisable in order to reduce the relative weight of the subsidy to households that do not need them and to increase the weight of the grants aimed at the most vulnerable households (by increasing amounts of support and reducing the financial requirements). Such a review is all the more appropriate as the recent crisis has brought about major changes in income distribution, resulting in increased inequality. The fee review should also be carried out in order to reduce the unjustifiable dispersion between regions.
In this context, the revision of income thresholds is essential and should, at least, ensure that all households with incomes below the poverty line are covered. Moreover, from the poverty line up to the median national income, the amount of the grant should be modulated inversely to household income.
When the analytical accounting of universities enables us to know the cost of the educational service, it would also be advisable to adjust tuition fees so that they are more realistic, as well as to allow fee-differentiation related to students’ economic background for fee-paying undergraduates.
With regard to future research, it would be appropriate to assess the efficiency of extending the network of public university campuses throughout the country, as opposed to the alternative of promoting a powerful grants programme to finance the costs of living far from home. This is the particularly the case in those provinces where the number of inhabitants makes it difficult to justify the cost of a new campus or university.
We would also like to stress that it is important to mitigate the problems of uncertainty and inefficiencies in the grants programme. In this respect, the AIRef (2019) proposals to create an IT tool as the single point of access to the state university grants programme. This tool could help to simplify the processing of applications and to coordinate the notification of eligibility in the income tax return with the Tax Agency. The proposal to establish a system for the automatic renewal of grants is also very interesting.
To end, our results have some limitations that have been pointed out previously. First, the SILC aggregates all types of grants and scholarships -whether or not linked to income- in a single variable, which could distort the relationship between beneficiaries and household income. Second, it would be very interesting to be able to overcome the fragmentation of information on grants from all regions and to analyse their impact.
References
AIRef (2019). Evaluación del gasto público 2018. Proyecto 4 (BECAS). Estudio. Becas de educación universitaria. Retrieved from https://www.airef.es/wp-content/uploads/2019/06/Estudio4-5SR/P4-PROTEGIDO.pdf
Bartscher, A.K., Kuhn, M., & Schularick, M. (2020). The College Wealth Divide: Education and Inequality in America, 1956-2016. Federal Reserve Bank of St. Louis Review, 102(1), 19-49. doi:10.20955/r.102.19-49.
Cantó, O., & Ruiz, D.O. (2015). The contribution of income mobility to economic insecurity in the US and Spain during the Great Recession. Research on Economic Inequality, 23, 109-152. doi: 10.1108/S1049-258520150000023004.
Consejo de Universidades y Conferencia General de Política Universitaria (2010). Documento de mejora y seguimiento de las Políticas de Financiación de las Universidades para promover la excelencia académica e incrementar el impacto socioeconómico del SUE. Retrieved from http://portal.uc3m.es/portal/page/portal/UGT/noticias/Documento_de_Financiacoin_26_04_2010.pdf
Fachelli, S., Torrents, D., y Navarro-Cendejas, J. (2014). ¿La universidad española suaviza las diferencias de clase en la inserción laboral? Revista de Educación, 364, 119-144. doi: 10.4438/1988-592X-RE-2014-364-257.
Feria, J.M., y Martínez, L. (2015). La definición y delimitación del sistema metropolitano español: permanencias y cambios entre 2001 y 2011. Ciudad y territorio. Estudios territoriales, 48(187), 9-24.
Goerlich, F.J., & Miñano, A. (2018). Unemployment, spell duration and the burden of unemployment in Spain during the XXI Century. WP-EC 2018-02. IVIE. doi: dx.medra.org/10.12842/WPASEC-2018-02.
Gil, M., y Carta, F. (2017). Precios públicos universitarios en España: incidencia distributiva y simulación experimental de una estructura progresiva a partir de la experiencia italiana. Cuadernos de Economía, 40, 42-55. doi: 10.1016/j.cesjef.2016.01.002.
Hernández, J. (2019). El efecto sobre la renta de las familias españolas del gasto del alumno universitario. Blog Universídad, 25/2/2019. Retrieved from https://www.universidadsi.es/el-efecto-sobre-la-renta-de-las-familias-espanolas-del-gasto-del-alumno-universitario/
Hernández, J., y Pérez, J.A. (2019). La Universidad Española en Cifras 2017/2018. CRUE Universidades Españolas.
INE (2005). Encuesta de Condiciones de Vida. Metodología, revisado en 2019. Retrieved from https://www.ine.es/daco/daco42/condivi/ecv_metodo.pdf
Münich, D., & Psacharopoulos, G. (2018). Education Externalities: What They Are and What We Know. Publications office. doi: 10.2766/309796.
OECD (2018). A Broken Social Elevator? How to Promote Social Mobility. Paris. OECD Publishing. doi: 10.1787/9789264301085-en.
OECD (2020). Education at Glance. doi: 10.1787/19991487.
Pastor, J.M., y Pérez, F. (2019). La contribución socioeconómica de las universidades públicas valencianas. València. Publicaciones Universitat de València. doi: dx.medra.org/10.12842/SUPV_2019.
Pérez, C., y Jódar, I. (2017). Análisis de los precios públicos de las matrículas universitarias en España a raíz de la crisis económica. La cuestión universitaria, 9, 6-27.
Valdés Fernández, M. (2018). Hacia un nuevo modelo de ayudas al estudio y financiación universitaria. Rued@. Revista Universidad, Ética y Derechos, (2). doi: 10.25267/Rueda.2017.i2.06.
Villar, A. (2020). Formación superior y mercado laboral: la universidad española frente a la cuarta revolución industrial. Papeles de economía española, 166, 105-122.
Contact address: Mónica Martí Sempere, Universidad de Alicante, Facultad de Ciencias Económicas y Empresariales, Departamento de Análisis Económico Aplicado. Campus de San Vicente del Raspeig, Apto. correos 99, C.P.,03080, Alicante, España. E-mail: mmarti@ua.es
Annex
Fee per credit in first, second, third, fourth and successive enrolments in undergraduate degrees by practical level (experimentalidad). Academic year 2020/21
Source: Ministry of Universities.
1 Common to all of Spain, except for the Basque Country, which has its own grants programme.
2 We are grateful to the authors for the information provided on the municipalities that make up each metropolitan area.
3 As income is expressed in terms of ECU, AGE income thresholds for one-member households have been selected (€8,422; €13,236 and €14,112) in order to be able to compare with income distribution in the figure.
4 The comparison of median income and tuition fees is appropriate because the majority of students have their usual residence in the same region in which they study (according to the Ministry of Universities, in the academic year 2018/19, more than 82%, except in Castilla y León, Madrid and La Rioja where the percentage is 72%).
5 They stand out because, after reviewing the websites of the regional governments, we have been able to confirm that less than 50% of regions award need-based grants, and when they do so, the amount does not exceed €3,000. For more details about salary grants, see the Resolution of 9 September 2020 of the Regional Ministry for Innovation, Universities, Science and Digital Society (Conselleria de Innovación, Universidades, Ciencia y Sociedad Digital).
6 This is only an assumption. The cost of the educational service is not rigorously calculated in Spanish public universities because the implementation of an analytical accounting system has not been completed. However, given that revenues from public prices in undergraduate education represent, on average, 15% of university budgets -estimated from the statistical annex of Hernández and Pérez (2019)-, it can be assumed that these prices are well below the real cost of the service.
7 Sixth final disposition of Royal Decree-Law 17/2020, of 5 May.
8 Hernández (2019) shares this opinion, when he estimates that the impact on family income derived from one of their members continuing with university studies is more than €18,000 for the academic year 2018/2019. The direct cost represents 8.7% of the total, indirect costs (transport, accommodation and meals) 42.5% and the opportunity cost 48.8%.