FIGURE I. Graphical representation of the typical factor matrix structure of a SWOT analysis
Source: Compiled by author based on linkedin.es
https://doi.org/10.4438/1988-592X-RE-2023-401-590
Francisco López Rupérez
https://orcid.org/0000-0003-2613-9652
Universidad Camilo José Cela
Isabel García García
https://orcid.org/0000-0002-9884-6148
Universidad Camilo José Cela
Abstract
This paper aims to contribute to the strategic analysis of the Spanish system with the ultimate goal of helping to guide the improvement of its educational policy. In the field of education, SWOT analyses have so far focused on university institutions and, to a lesser extent, on schools. However, available SWOT analyses of national education systems are scarce and deficient. Two procedures have been used: a qualitative SWOT analysis (Strengths, Weaknesses, Opportunities and Threats) and the subsequent application of the quantitative technique of the Analytic Hierarchy Process (AHP). The preparation of the SWOT matrix has been carried out at two hierarchical levels: that of the sub-factors and that of the indicators. For internal factors (WS), resources, processes/policies (governance) and results have been taken as the basis. For external factors (TO), the PESTEL model has been adopted, limited to the political, socio-economic and technological categories. The specification of the sub-factors in indicators has been supported by the results of a significant number of national and international research and statistics. The subsequent application of the AHP technique has identified relative priorities based from comparisons within the multilevel hierarchical structures. The initial 38 SWOT indicators have been reduced to 17, of which, with a global priority of more than 0.050 and a low consistency ratio, the following stand out: intergenerational transmission of the educational level of parents, new technological tools for improving performance, Next Generation funds, lack of a basic political agreement, and low level of excellence. Based on the results, the discussion focused on analysing the strategies of the maxO-minW and minT-maxO types and on formulating evidence-based recommendations aimed at implementing the resulting strategies.
Keywords: educational governance, Sstrategic planning of education, education policy, SWOT analysis, analytic hierarchy process
Resumen
El presente trabajo pretende contribuir al análisis estratégico del sistema español con la finalidad última de servir de ayuda para orientar hacia la mejora su política educativa. En el ámbito educativo, los análisis DAFO se han centrado, hasta ahora, en las instituciones universitarias y, en menor medida, en los centros escolares. Pero son escasos y deficientes los análisis DAFO disponibles sobre sistemas educativos nacionales. Se ha recurrido a dos procedimientos concatenados: un análisis DAFO (Debilidades, Amenazas, Fortalezas y Oportunidades) de carácter cualitativo y la aplicación posterior de la técnica cuantitativa del proceso de jerarquía analítica (AHP). La elaboración de la matriz DAFO se ha efectuado en dos niveles jerárquicos: el de los subfactores y el de los indicadores. Para los factores internos (D, F), se ha tomado como base las categorías de recursos, procesos/políticas (gobernanza) y resultados. Para los factores externos (A, O), se ha adoptado el modelo PESTEL, limitado a las categorías de lo político, lo socioeconómico y lo tecnológico. La concreción de los subfactores en indicadores ha estado avalada por los resultados de un número apreciable de investigaciones y de estadísticas, tanto nacionales como internacionales. La aplicación subsiguiente de la técnica AHP ha determinado prioridades relativas a partir de comparaciones dentro de las estructuras jerárquicas multinivel. Se han reducido los 38 indicadores DAFO iniciales a 17, de los cuales, con una prioridad global mayor de 0,050 y una baja ratio de consistencia, destacan: transmisión intergeneracional del nivel educativo de los padres, nuevas herramientas tecnológicas para la mejora del rendimiento, fondos Next Generation, falta de un acuerdo político básico, y bajo nivel de excelencia. A partir de los resultados, la discusión se ha centrado en analizar las estrategias de los tipos maxO-minD y minA-maxO y en formular recomendaciones inspiradas en evidencias y destinadas a implementar las estrategias resultantes.
Palabras clave: administración de la educación, planificación educativa, política educativa, análisis DAFO, proceso de jerarquía analítica
Comparative analyses, based on international indicators, have revealed a worrying stagnation of the Spanish education system over the last two decades, in comparison with other neighbouring countries which, starting from similar or even inferior situations, have been able to react with determination and success (OECD, 2019; European Commission, 2020; López Rupérez & García García, 2020; OECD, 2021).
One of the facts that needs to be incorporated into the new global equation is that, as a result of an underlying complexity in which interdependencies proliferate and unexpected phenomena emerge (López Rupérez, 2021), education has become an indisputable part of the interactions between the global economy and society, and it is essential to manage it well in policy terms.
In this context, the use of so-called strategic thinking is a necessary condition for qualitative improvement. According to the Center for Management & Organization Effectiveness (2019):
Strategic thinking is simply an intentional and rational thought process that focuses on the analysis of critical factors and variables that will influence the long-term success of a business, a team or an individual (…) Strategic thinking requires research, analytical thinking, innovation, problem-solving skills, communication and leadership skills, and decisiveness (p. 1).
The aim of this paper is to contribute to the strategic analysis of the Spanish education system with the ultimate aim of helping to guide its educational policy towards improvement. To this end, two concatenated procedures have been used: a qualitative SWOT (Strengths, Weaknesses, Opportunities and Threats) analysis and the subsequent application of the quantitative technique of the analytical hierarchy process (AHP).
Since its origins in the last century (Codina Jiménez, 2011; Santos-Caballero & Gil-LaSource, 2017; Benzaghta et al., 2021), the number of articles published on SWOT analysis has been accelerating, particularly since the beginning of this century (Santos-Caballero & Gil-LaSource, 2017). In education, the focus has been on university institutions and, to a lesser extent, on schools (Benzaghta et al., 2021). Khalid et al. (2017) have conducted a SWOT study on higher education in Pakistan, and Velmonte (2020) has applied this technique to the education system in the Philippines, albeit with a very limited analytical focus. In Spain, the Autonomous Community of Castile and León has conducted a qualitative SWOT analysis of its education system as part of its II Plan de atención a la diversidad en la educación [II Care plan for Diversity in Education] (BOCYL, 2017). However, we have not found quantitative SWOT analyses of national education systems that are sufficiently rigorous and complete. For this reason, and despite the exploratory nature of our study, it opens up a way to introduce this type of analysis into the highly difficult task of strategic governance of education systems (López Rupérez & García García, 2022).
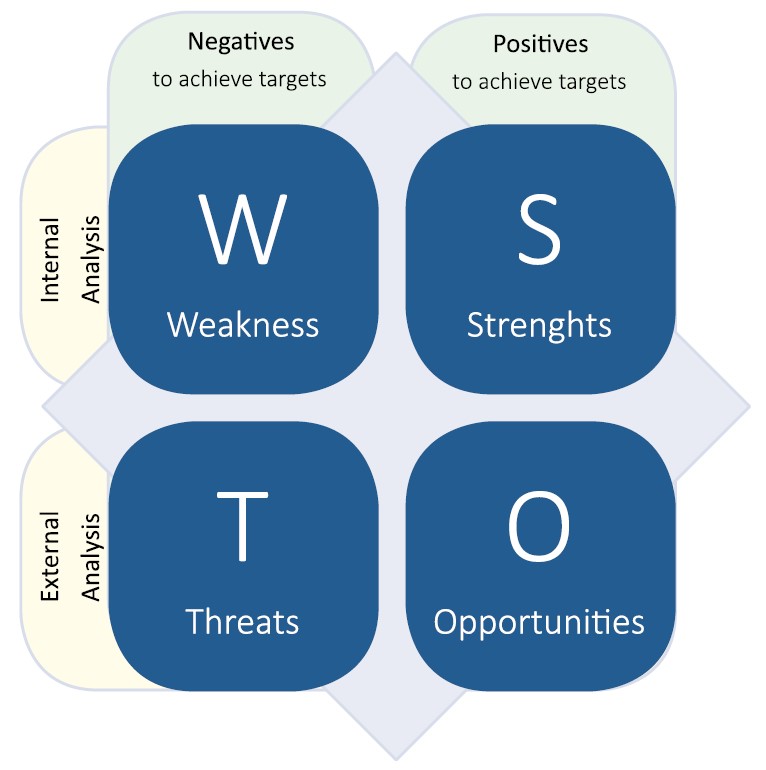
Within what is understood as strategic management (Koontz et al., 2012), SWOT analyses are regarded, in the world of organizations, as a considerably useful means for the subsequent formulation of strategies and their eventual implementation. Figure I show the main conceptual elements of a SWOT analysis.
FIGURE I. Graphical representation of the typical factor matrix structure of a SWOT analysis
Source: Compiled by author based on linkedin.es
In the present study, the application to the Spanish education system of the procedural scheme represented in figure II has been carried out at two levels of concreteness in addition to that of the factors: that of the sub-factors and that of the indicators. As far as internal factors are concerned, their expression at the level of sub-factors has been based on the systemic approach, as is characteristic of the world of international education indicators (CERI-OECD, 1992), albeit centred on the three categories: resources, processes/policies (governance) and results. Regarding the external factors, we have based ourselves on the PESTEL model (Shilei &Yong, 2009; Yüksel, 2012; Jadan, 2020), but limiting this to the political, socio-economic, and technological categories. The general criterion for selecting the sub-factors in terms of indicators was relevance, which is supported by the results of a considerable amount of research and statistics, both national and international.
FIGURE II. Outline of the procedure for the elaboration of a SWOT matrix
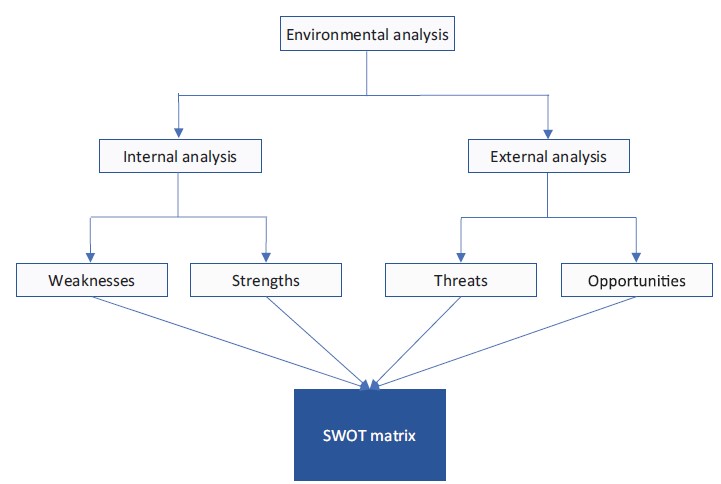
Source: Compiled by author
The Analytic Hierarchy Process (AHP) is a mathematical procedure created by Saaty (1980) and applicable in multi-criteria decision making, which allows a complicated problem to be broken down into a multi-level hierarchical structure of objectives, criteria, and alternatives (Sharma et al., 2008).
The transformation of the qualitative SWOT strategic analysis into a quantitative analysis using AHP (Kurttila et al., 2000) overcomes two limitations of the former: that it does not allow determining the relative importance of factors and sub-factors, and that it does not consider the combinations of the numerous criteria that can be considered, as well as their potential interdependencies (Pesonen, et al., 2001).
The absolute scales of factors and sub-factors are transformed by the AHP procedure into relative priorities based on comparisons within multilevel hierarchical structures (Saaty &Vargas, 1996). This is done based on a comparative scale –developed by Saaty to represent the relative importance of criteria, factors, or sub-factors– which is shown in Table I.
TABLE I. AHP scale for a pairwise comparison of criteria, factors or attributes
Degree of importance |
Description |
1 |
Both criteria contribute equally to the objective. |
3 |
Experience and judgement lean slightly in favour of one over the other. |
5 |
Experience and judgement lean strongly in favour of one over the other. |
7 |
Judgement is strongly favoured and its predominance is demonstrated in practice. |
9 |
Extreme or absolute importance of one attribute over the other. |
2, 4, 6 and 8 |
Used to represent trade-offs between the assessments described above. |
Source: Saaty, 1980; Görener, Toker and Uluçay, 2012.
The pairwise comparison, whose elements represent alternatives, is arranged in a matrix that subsequently makes it possible to calculate the relative importance of the criteria, factors or sub-factors (Görener et al., 2012), and to determine the consistency ratios (Saaty &Vargas, 1996) that make it possible to assess the degree of consistency of the judgements with respect to that which would be provided by a large sample of purely random judgements1.
In accordance with the structure of factors and sub-factors described in the Methods Section, and based on empirical information derived from research and national and international statistics, the SWOT matrix described below has been developed.
■ Weaknesses
– Inputs (resources)
○ WI1. Low public education expenditure relative to GDP (López Rupérez & García García, 2020; OECD, 2021; Montes-Pineda & López Rupérez, 2022).
○ WI2. Low cumulative expenditure per pupil (6 years to 15 years) (OECD, 2021).
○ WI3. Notable territorial inequality (López Rupérez et al., 2018a; 2018b)
– Governance (policies)
○ WG1. Insufficient attention to evidence in the formulation and implementation of education policies (López Rupérez et al., 2017; López Rupérez et al., 2020 a; López Rupérez, 2022).
○ WG2. Insufficient attention to accountability (López Rupérez et al., 2017).
○ WG3. Deficient initial and in-service teacher training systems (López Rupérez et al., 2021).
○ WG4. Deficient systems for access to school leadership and professional development (Leithwood et al., 2006; Hanushek et al., 2016; Pont Ferrer, 2017).
– Results (outputs)
○ WR1. Underachievement in basic skills (European Commission, 2020).
○ WR2. Low level of excellence (OECD, 2016; OECD, 2019).
○ WR3. High early educational dropout (European Commission, 2020).
■ Strengths
– Inputs (resources)
○ SI1. Scholarships and study grants system2 (OECD, 2021).
○ SI2. Level of teachers’ salaries (Eurydice, 2021; OECD, 2021).
○ SI3. Educational expenditure in private institutions (OECD, 2021).
– Governance (policies)
○ SG1. A consolidated educational bureaucracy.
○ SG2. Formal mechanisms for cooperation between education administrations3
○ SG3. A plural educational offer (Sainz & Sanz, 2021).
– Results (outputs)
○ SR1. High rates of early childhood education (European Commission, 2021).
○ SR2. High enrolment rates in primary and secondary education.
○ SR3. High rates of tertiary education graduates (ISCED 5-8) (European Commission, 2021).
■ Threats
– Political
○ TP1. The lack of a basic political agreement.
○ TP2. Weak political opposition on education.
○ TP3. The comparative advantage, in terms of education policy, of competing countries (Council of Europe, 2021; OECD, 2010; López Rupérez & García García, 2020).
– Socio-economic
○ TS1. A clear change in the economic and financial policy of the EU and the ECB.
○ TS2. The increase in social spending due to population ageing (INE, 2020).
○ TS3. The failure to integrate young people into the labour market4,5
○ TS4. The effects of pandemics (Alimi et al., 2021; Sanz et al., 2020).
– Technological
○ TT1. A pressure on the system as an indirect effect of the reduction of jobs (Berggruen &Gardels, 2012; Baldwin, 2019).
○ TT2. Risk of depersonalization of the teacher-student relationship.
○ TT3. Interferences, due to improper use of technologies, with basic learning processes (OMS, 2022).
■ Opportunities
– Political
○ OP1. Expectations of political change (López Rupérez, 2021).
○ OP2. EU pressure on education (Consejo de la Unión Europea, 2002; Consejo Europeo, 2021).
○ OP3. The growing international information on successful educational policies (López Rupérez & García García, 2021).
– Socioeconomic
○ OS1. The Next Generation EU funds6.
○ OS2. The demographic reduction in the number of pupils (INE, 2020).
○ OS3. Intergenerational transmission of parents’ educational attainment (INE, 2019; OECD, 2021).
– Technological
○ OT1. Remote and global interactions between education actors.
○ OT2. New technological tools for improving student performance (Patrick et al., 2013; Luckin & Issroff, 2018; López Rupérez, 2020).
○ OT3. Operational development of learning analytics (Ferguson et al., 2016).
Applying the AHP procedure, with the determination of each matrix of weights ─ which have been independently assessed by the two authors, based on the pairwise comparisons carried out on the basic Saaty scale (table I) ─ has yielded the coinciding results shown in the tables in the annex, which refer to the three groups of variables corresponding to the respective hierarchical levels (see figure III).
FIGURE III. Structure in hierarchical levels of the SWOT matrix
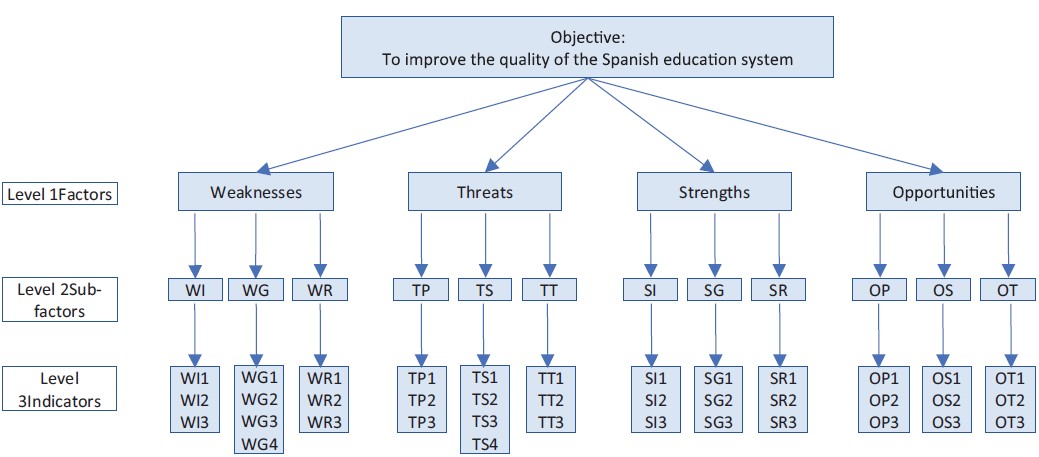
Source: Compiled by author
The following three figures (IV, V and VI) show the results of the multilevel quantitative analysis. Thus, figure IV shows the SWOT factors and their sub-factors (levels 1 and 2), together with the figures representing the partial and global – or composite– priorities resulting from taking into consideration the different levels analysed. The highest relative values for each stage of analysis are highlighted in bold.
FIGURE IV. Overall scores for factors, sub-factors and SWOT indicators. Factors and sub-factors
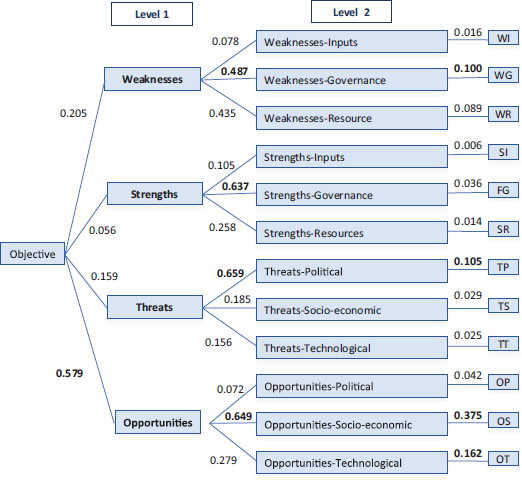
Source: Compiled by author
FIGURE V. Overall scores of factors, sub-factors and SWOT indicators. Internal factors, sub-factors and indicators
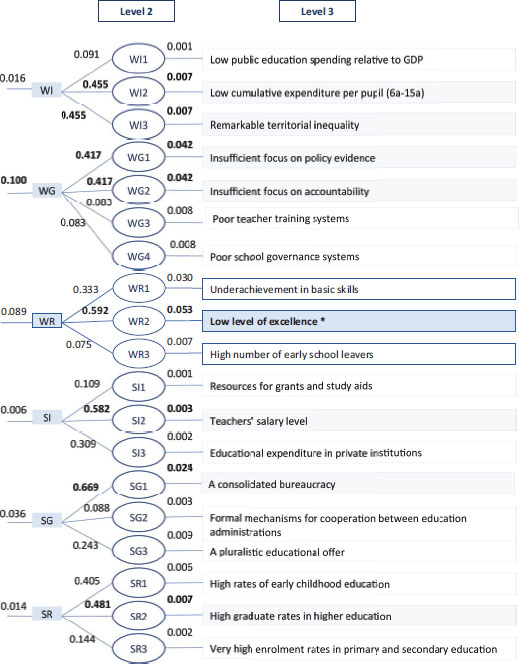
Source: Compiled by author
Figures V and VI show the sub-factors (level 2), their expression in indicators (level 3) as well as the corresponding figures for partial and global priorities, calculated in a similar way to that used in the previous phase. The complexity of the level 3 display required the use of two charts, one for the display of internal factors (W and S) and the other for external factors (T and O).
FIGURE VI. Overall scores for factors, sub-factors and SWOT indicators. External factors, sub-factors and indicators
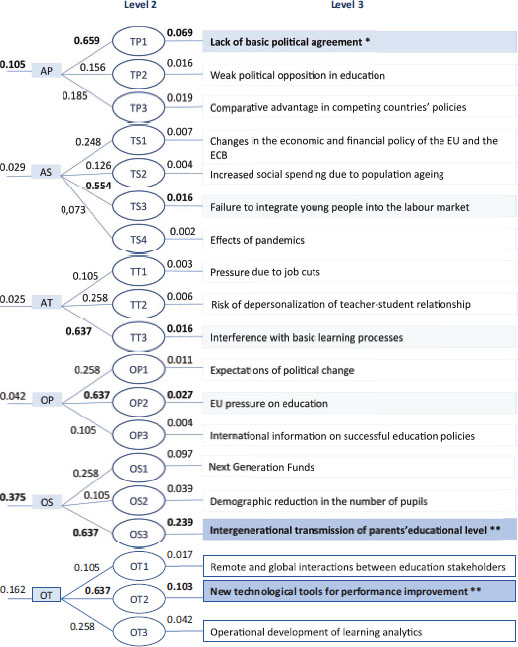
Source: Compiled by author
On the other hand, Table II provides a synthetic view of those indicators whose global priorities are equal to or higher than 0.010, together with their corresponding figures, as well as the CR consistency ratios, which will be useful in the discussion of strategic elements to be addressed later.
TABLE II. Summary, in terms of priorities, of the quantitative analyses carried out on the SWOT matrix and its different hierarchical levels7
Factor |
Level 1 Priority |
Sub-factor |
Indicator |
Global priority |
Weaknesses RC = 0.011 |
0.205 |
Governance RC = 0.000 |
Insufficient attention to evidence on policies |
0.042 |
Insufficient focus on accountability |
0.042 |
|||
Results RC = 0.007 |
Low level of excellence |
0.053 (*) |
||
Strengths RC = 0.033 |
0.056 |
Governance RC = 0.006 |
A consolidated bureaucracy |
0.024 |
Threats RC = 0.025 |
0.159 |
Political RC = 0.025 |
Lack of basic political agreement |
0.069 (*) |
Weak political opposition in education |
0.016 |
|||
Comparative advantage in political advantage of competitor countries |
0.019 |
|||
Socio-economic RC = 0.073 |
Failure of young people to enter the labour market |
0.016 |
||
Technological RC = 0.033 |
Interferences in basic learning processes |
0.016 |
||
Opportunities RC = 0.039 |
0.579 |
Political RC = 0.033 |
Expectations of political change |
0.011 |
EU pressure on education |
0.027 |
|||
Socio-economic RC = 0.033 |
Next Generation EU funds |
0.097 (*) |
||
Demographic decline in pupil numbers |
0.039 |
|||
Intergenerational transmission of parental education level |
0.239 (**) |
|||
Technological RC = 0.033 |
Remote and global interactions between educational actors |
0.017 |
||
New Technological tools for performance improvement |
0.103 (**) |
|||
Operational development of learning analytics |
0.042 |
Source: Compiled by author
Applying the AHP technique allows SWOT analyses to be completed on a quantitative basis. These quantitative analyses aim to facilitate the adoption of strategic decisions informed by a multiplicity of criteria of different nature and relevance with varying degrees of interdependence. This SWOT enriched by AHP is a way of shedding light on a complex forest of relevant factors.
Table II highlights the prominent role of the Opportunities and provides a first reduction in complexity when suggesting strategies, since the systematic application of the AHP technique has reduced the initial thirty-eight relevant variables to less than half. Nevertheless, a series of heuristics –or guidelines based on experience– should be enunciated in order to advance in the problem of selecting relevant strategies resulting from the quantitative SWOT. What follows is a list, albeit not a full one, of those guidelines or orientations that we will apply:
Based on the overview provided by Table II (orientation a), we now proceed to apply orientation b). Figure VII shows the figures for the priorities of level 1, the level corresponding to the SWOT factors. In accordance with the relative priority values of this first level, the strategies that revolve around opportunities, namely maxO-maxS (offensive strategy) and maxO-minW (adaptive strategy), are chosen (Koontz et al., 2012). The consideration of orientations c), d) and e) recommends focusing on the maxO-minW adaptive strategies, in accordance with the following approach:
FIGURE VII. Graphical representation of the priority scores obtained for the different level 1 SWOT factors.
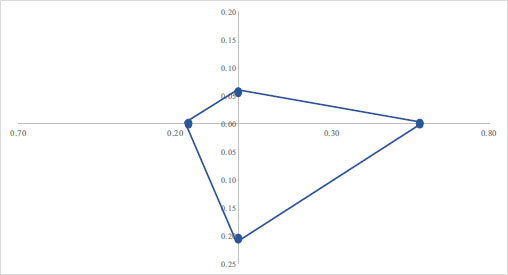
Source: Compiled by author
■ On the side of Opportunities:
– Intergenerational transmission of parents’ educational attainment.
– New Technological tools for performance improvement.
– Next Generation Funds.
■ On the side of Weaknesses:
– Low level of excellence.
– Insufficient attention to evidence on policies.
– Insufficient attention to accountability.
The inclusion of the selected governance indicators in the weaknesses group (see Table II) is justified, on the one hand, by the proximity of their priority scores to those of the results indicators and, on the other hand, by the advantage of this first group of indicators in terms of consistency (orientation e).
Finally, in view of the different scores in Table II, the application of orientation f) leads to an alternative and atypical strategic approach along the following lines: minT-maxO. In other words, minimizing the impact of the threats and maximizing the use of the opportunities, which means addingfrom the side of the Threats: Lack of basic political agreement.
It is now a matter of complementing this approach towards what should be done with an approach towards how to achieve it, and of formulating recommendations, as evidence-based as possible, to the public authorities, which help to implement the strategies that emerge from the orderly application of the heuristics.
It is clear that all internal factors that contribute to this educational transmission from families will contribute to seizing this opportunity. According to the available empirical evidence, improving the quality of teachers and improving the quality of school leadership are the two most critical factors (Hattie, 2003; Leithwood et al., 2006; Hanushek et al., 2016; López Rupérez, 2021) for school success. In addition, a third factor, which lies at the heart of the process of intergenerational cultural transmission itself, is parental involvement (Castro et al., 2015), which is facilitated by successful cooperation between family and school.
Two orientations would make it possible to take advantage of this opportunity. The first is to use digital technologies for the effective development of personalized –or learner-centred– teaching that reaches all students and addresses their needs and the particular characteristics of their learning process (López Rupérez, 2020). The second, closely related to the previous one, is to take advantage of what we know about the effectiveness of Mastery Learning with its precise and rigorous teaching sequences that ensure that all students master what they learn (López López, 2006).
If a Paretian approach to priority setting is adopted, then teacher-centred and school leadership-centred policies should be inexcusably part of the objectives of Lever VII. Education and knowledge, lifelong learning, and capacity development.8
Two empirically grounded recommendations can be made to achieve this goal: the first is to raise the level of teaching demands; the second is to strengthen non-cognitive skills, particularly those related to perseverance, resilience and a sense of effort (López Rupérez &García, 2017). It is clear that both recommendations are interlinked, because while raising the level of teaching demands must go hand in hand with raising the level of teacher competence, this will be insufficient if students are not simultaneously encouraged to develop these skills, which are generally associated with character development (Lickona &Davidson, 2005; Bernal et al., 2015).
Two recommendations emerge from the decisive role of knowledge and evidence in defining policies and educational reforms in high-performing countries (López Rupérez, 2022). Firstly, an epistemological shift towards a critical rationalism that considers the principle of reality and respect for facts. It is a matter of introducing educational policies into the territory of rational-scientific approaches.
The second recommendation is of an instrumental nature, and consists of recovering the practice of ‘white papers’, which has been abandoned in Spain since the last century. No educational reform should be able to be included in the Official State Gazette without the prior drafting of a white paper which, together with the objectives, would provide a justification for the reforms based on facts and not on mere rhetorical formulations; an effort should be made to explain –at least by means of plausible conceptual models with some empirical basis and, if possible, by means of causal models – the mechanisms through which the reform is expected to achieve its objectives; and an impact assessment plan should also be included in order to check whether or not these forecasts are being fulfilled.
Two recommendations for strengthening accountability are essential. The first is to include the overall assessment model of the education system among the elements of a basic political consensus that blocks piecemeal changes. This will guarantee the stability of the model, facilitate the comparability of time series and ensure that useful and minimally reliable inferences can be made.
The second recommendation is to make the institution responsible for the evaluation of the education system independent of the government, with high academic prestige and technical solvency, and accountable to Parliament. This is what the Portuguese government did with the creation of an Institute for Educational Evaluation as an autonomous and independent body (Crato, 2020).
From the analysis of experience, two recommendations arise and are justified below. The first is to introduce the aforementioned rationality in the formulation of the policies. This essential attribute makes it possible to get it right; but it also makes the stability of educational reforms more likely, which is a necessary condition for their success. The second is to progress towards a social pact rather than a political pact. Social expectations in Spain regarding the need to articulate an educational pact are in the majority and, therefore, the obstacles may well be of a lower calibre than in the strictly political sphere.
Both strategies are interrelated. Spanish society as a whole is more sensitive to rational arguments than its political class and, of course, much less sensitive to those that respond to a logic of power. The fact that the social agreement comes before the political pact will be a stimulus for the latter not to become disengaged and will generate a certain opportunity for its materialization.
The margin of subjectivity inherent in the method used in this study could be reduced by increasing the number of experts involved either in the selection processes of sub-factors and indicators, or in the processes of assigning weights by pairs, or in both. The application of the Delphi procedure of expert consultation (Landeta, 1999) could be one such possibility for methodological consolidation.
Alimi, Y. D., Bernstein, A., Epstein, J., Espinal, M., Kakkar, M., Kochevar, D., & Werneck. G. (2021). Report of the Scientific Task Force on Preventing Pandemics. Harvard Global Health Institute. https://cdn1.sph.harvard.edu/wp-content/uploads/sites/2343/2021/08/PreventingPandemicsAug2021.pdf
Baldwin, D. (2019). La convulsión globótica. Globalización, robótica y el futuro del trabajo. Antoni Bosch editor.
Benzaghta, M. A., Elwalda, A., Mousa, M. M., Erkan, I., & Rahman, M. (2021). SWOT analysis applications: An integrative literature review. Journal of Global Business Insights, 6(1), pp. 55–73. https://doi.org/10.5038/2640-6489.6.1.1148
Berggruen, N., & Gardels, N. (2012). Governance inteligente para el siglo XXI. Una vía intermedia entre occidente y oriente. Taurus.
Bernal, A., González Torres, M. C., & Naval, C. (2015). La educación del carácter. Perspectivas internacionales. Participación educativa. Segunda Época/Vol.4, n.º 6, pp. 35–45.
BOCYL (2017). II Plan de Atención a la Diversidad en la Educación de Castilla y León 2017–2022. Boletin Oficial de Castilla y León, núm. 115, pp. 23109–23176.
Castro, M., Expósito-Casas, E., López-Martín, E.; Lizasoain, L.; Navarro-Asencio. E., & Gaviria, J. L. (2015). Parental involvement on student academic achievement: A meta-analysis. Educational Research Review, 14, pp. 33–46.
Center for Management & Organization Effectiveness (2019). What is Strategic Thinking? CMOE. https://cmoe.com/
CERI-OECD (1992). The OECD International Education Indicators. A Framework for analyses. OECD Publishing.
Codina Jiménez, A. (2011). Deficiencias en el uso del FODA. Causas y sugerencias. Revista Ciencias Estratégicas, vol. 19, núm. 25, enero-junio, pp. 89–100. https://www.redalyc.org/articulo.oa?id=151322413006
Consejo de la Unión Europea (2002). Programa de trabajo detallado para el seguimiento de los objetivos concretos de los sistemas de educación y formación en Europa. Documento 2002/C142/01.
Consejo Europeo (2021). Resolución del Consejo relativa a un marco estratégico para la cooperación europea en el ámbito de la educación y la formación con miras al Espacio Europeo de Educación y más allá (2021-2030).
Coyle, G. (2004). The Analytic Hierarchy Process (AHP). En Practical Strategy. Open Access Material. AHP 1 © Pearson Education Limited.
Crato, N. (2020). Curriculum and Educational Reforms in Portugal: An Analysis on Why and How Students’ Knowledge and Skills Improved. In Audacious Education Purposes. How Governments Transform the Goals of Education Systems. Reimers, F. M. (Ed.). Springer. https://bit.ly/36frag
European Commission (2020). Monitor de la Educación y la Formación de 2020. https://education.ec.europa.eu/es/monitor-de-la-educacion-y-la-formacion
Eurydice/European Commission/EACEA (2021). Teachers’ and School Heads’ Salaries and Allowances in Europe – 2019/20. Eurydice Facts and Figures. Publications Office of the European Union. https://eacea.ec.europa.eu/national-policies/eurydice/content/teacherssalaries-2021_en
Ferguson, R., Brasher, A., Clow, D., Cooper, A., Hillaire, G., Mittelmeier, J., Rienties, B., Ullmann, T., & Vuorikari, R. (2016). Research Evidence on the Use of Learning Analytics: Implications for Education Policy. R. Vuorikari, J. Castaño Muñoz (Eds.). Joint Research Centre Science for Policy Report, EUR 28294 EN. https://doi.org/10.2791/955210
Gallego-Ayala, J., & Juízo, D. (2011). Strategic implementation of integrated water resources management in Mozambique: An A’WOT analysis. Physics and Chemistry of the Earth, 36, pp. 1103–1111.
Görenger, A., Toker, K., & Uluçay, K. (2012). Application of Combined SWOT and AHP: A Case Study for a Manufacturing Firm. Procedia-Social and Behavioral Sciences 58, pp. 1525–1534. https://doi.org/10.1016/j.sbspro.2012.09.1139. 8th International Strategic Management Conference.
Hanushek, E. A., Rivkin, S. G., & Schiman, J. C. (2016). Dynamic effects of teacher turnover on the quality of instruction. Economics of Education Review, 55, pp. 132–148.
Hattie, J. (2003). Teachers Make a Difference: What is the research evidence? Australian Council for Educational Research Annual Conference on: Building Teacher Quality. October 2003, pp. 1–17.
INE (2019). INEbase. Encuesta de condiciones de vida. Módulo año 2019. https://www.ine.es/jaxi/Table.htm?path=/t25/p453/modulo/2019/l0/&file=07001a.px&L=0
INE (2020). INEbase. Proyecciones de población. Proyección de la población de España. 2020–2070. https://www.ine.es/jaxiT3/Table.htm?t=36643&L=0
Jadan, D. (2020). PESTEL analysis as a Baseline to support decision-making in the local textile industry. International Conference on Systems and Information Sciences, Manta, Ecuador.
Khalid, J. Alia, A.J., Khaleela, M., Islama, M.S., & Shua, Q.F. (2017). Towards Global Knowledge Society: A SWOT Analysis of Higher Education of Pakistan in Context of Internationalization. Journal of Business, 02(02), pp. 08–15. https://dx.doi.org/10.18533/job.v2i2.65
Koontz, H., Weihrich, H., & Cannice M. (2012). Administración. Una perspectiva global y empresarial. 14ª edición. McGrawHill.
Kurttila, M., Pesonen, M., Kangas, J., & Kajanus, M. (2000). Utilizing the analytic hierarchy process (AHP) in SWOT analysis—A hybrid method and its application to a forest-certification case. Forest Policy and Economics, 1(1), pp. 41–52.
Landeta, J. (1999). El método Delphi. Una técnica de previsión para la incertidumbre. Editorial Ariel.
Leithwood, K., Day, C., Sammons, P., Harris, A., & Hopkins, D. (2006). Seven strong claims about successful school Leadership. Nottingham, England: National College of School leadership. https://dx.doi.org/10.1080/13632430701800060
Lickona, T., & Davidson, M. (2005). Smart & Good High Schools. Integrating excellence and ethics for success in school, work, and beyond. Center for the 4th and 5th Rs (Respect & Responsibility). Character.
López López, E. (2006). El mastery learning a la luz de la investigación educativa., 340. Mayo-agosto 2006, pp. 625–665.
López Rupérez, F. (2020). El currículo y la educación en el siglo XXI. La preparación del futuro y el enfoque por competencias. Narcea Ediciones.
López Rupérez, F. (2021). La gobernanza de los sistemas educativos. Fundamentos y orientaciones. Narcea-Stamp UCJC.
López Rupérez, F. (2022). La calidad de la gobernanza del sistema educativo. El caso de la LOMLOE. Revista Española de Pedagogía, 80 (281), 55–74. https://doi.org/10.22550/REP80-1-2022-02.
López Rupérez, F., & García García, I. (2017). Valores y éxito escolar. ¿Qué nos dice PISA 2015? Universidad Camilo José Cela. https://www.ucjc.edu/wp-content/uploads/valoresyexi-to_171116.pdf
López Rupérez, F., & García García, I. (2020). España vs. Portugal en educación. Una aproximación sistémica. Revista Iberoamericana de Educación, 84 (1), pp.193–215. https://rieoei.org/RIE/article/view/4042
López Rupérez, F., & García García, I. (2021). El profesorado de educación secundaria a la luz de PISA 2018. Implicaciones para la política educativa española. Universidad Camilo José Cela. http://repositorio.ucjc.edu/handle/20.500.12020/925
López Rupérez, F., & García García, I. (2022). Hacia una Gobernanza Estratégica. Un análisis DAFO cuantitativo para la educación española. Universidad Camilo José Cela. hacia_una_gobernanza_estrategica.pdf (ucjc.edu)
López Rupérez, F., García García, I., & Expósito Casas, E. (2017). La calidad de la gobernanza del sistema educativo español. Un estudio empírico. Universidad Camilo José Cela. http://hdl.handle.net/20.500.12020/825
López Rupérez, F., García García, I., & Expósito Casas, E. (2018 a). PISA 2015 y las Comunidades Autónomas españolas. Diagnósticos empíricos y Políticas de mejora. Universidad Camilo José Cela. http://hdl.handle.net/20.500.12020/826
López Rupérez, F., García García, I. and Expósito Casas, E. (2018 b). Educational Effectiveness, Efficiency, and Equity in Spanish Regions: What Does PISA 2015 Reveal? Orbis Scholae, 2018, 12 (2), pp. 9–36. https://doi.org/0.14712/23363177.2018.291
López Rupérez, F., García García, I., & Expósito Casas, E. (2020). Un marco analítico para la evaluación de la calidad de la gobernance de los sistemas educativos. Revista Iberoamericana de Educación, 83 (1), pp. 53–76. https://doi.org/10.35362/rie831367
López Rupérez, F., García García, I., & Expósito Casas, E. (2021). Formación inicial y formación permanente del profesorado de educación secundaria en España. Un análisis territorial. Bordón. Revista de Pedagogía, 73 (4), 2021, pp. 65–84. https://doi.org/10.13042/Bordon.2021.91081
Luckin, R., & Issroff, K. (2018). Future of Education and Skills 2030: Conceptual Learning. EDU/EDPC(2018)45/ANN2. OECD. https://www.oecd.org/education/2030-project/curriculum-analysis
Montes-Pineda, O., & López Rupérez, F. (2022). Gasto y Political educativas en España. La relevancia de la asignación económica para el rendimiento académico. EduPsykhé. Revista de Psicología y Educación, Vol. 19(1), pp.1–34.
OECD (2010). The high cost of low educational performance. The long-run economic impact of improving PISA outcomes. OECD. https://www.oecd.org/pisa/44417824.pdf
OECD (2016). PISA 2015. Results (Volume II): Policies and Practices for Successful Schools. OECD Publishing. https://doi.org/10.1787/9789264267510-en
OECD (2019). PISA 2018 Results (Volume I): What Students Know and Can Do, PISA, OECD Publishing. https://doi.org/10.1787/5f07c754-en
OECD (2021). Education at a Glance 2021: OECD Indicators. OECD Publishing. https://doi.org/10.1787/b35a14e5-en
OMS (2022). CIE-11 para estadísticas de mortalidad y morbilidad. 6C51 Trastorno por uso de videojuegos. https://icd.who.int/browse11/l-m/es
Patrick, S., Kennedy, K., & Powell, A. (2013). Mean What You Say: Defining and Integrating Personalized, Blended and Competency Education. iNACOL. The International Association for K-12 Online Learning. https://aurora-institute.org/resource/mean-what-you-say-defining-and-integrating-personalized-blended-and-competency-education
Pesonen, M., Ahola, J., Kurttila M., Kajanus, M., & Kangas, J. (2001). Applying A’WOT to Forest Industry Investment Strategies: Case Study of a Finnish Company in North America. In: Schmoldt, D. L., Kangas, J., Mendoza, G. A., Pesonen, M. (eds) The Analytic Hierarchy Process in Natural Resource and Environmental Decision Making. Managing Forest Ecosystems, vol 3. Springer. https://doi.org/10.1007/978-94-015-9799-9_12
Pont Ferrer, B. (2017). Reformas educativas: el caso del liderazgo escolar en perspectiva comparada. (Tesis doctoral). Universidad Complutense de Madrid.
Saaty, T. L. (1980). The Analytic Hierarchy Process. McGraw-Hill.
Saaty, T. L., & Vargas, L. G. (1996). Decision Making with The Analytic Network Process. Springer.
Sainz, J., & Sanz, I. (2021). Los centros públicos y concertados se refuerzan mutuamente. Revisión de la Literatura. Cuadernos de Pedagogía, nº 516, pp. 16–20.
Santos-Caballero, A., & Gil-LaSource, J. (2017). La nueva Fuzzy-SWOT: Aplicación empírica con expertones. Esic Market Economics and Business Journal, Vol. 48, N.º 1, Enero-Abril, pp. 143–164.
Sanz, I., Sainz, J & Capilla, A. (2020). Efectos de la crisis del coronavirus en la educación. Informe, OEI.
Sharma, M. J., Moon, I., & Bae, H. (2008). Analytic hierarchy process to assess and optimize distribution network. Applied Mathematics and Computation, Vol. 202, pp. 256–265.
Shilei, L., & Yong, W. (2009). Target-oriented obstacle analysis by PESTEL modeling of energy efficiency retrofit for existing residential buildings in China’s northern heating region. Energy Policy, 37, pp. 2098–2101. https://doi.org/10.1016/j.enpol.2008.11.039
Velmonte, G. L. (2020). SWOT Analysis Philippine Educational System. International Journal of Intelligent Computing and Technology (IJICT), Vol. 4, Iss.1, pp. 18–24.
Weihrich, H. (1989). Excelencia Administrativa. Productividad mediante administración por objetivos. Mc Graw Hill México.
Yüksel, I. (2012). Developing a Multi-Criteria Decision Making Model for PESTEL Analysis. International Journal of Business and Management. Vol. 7, No. 24 pp. 52–66.
TABLE A.1. Pairwise comparison matrix, degrees of importance and Consistency Ratio of the SWOT factor group
SWOT Group |
W |
S |
T |
O |
Degree of importance |
Weaknesses (W) |
1 |
5 |
1 |
1/3 |
0.205 |
Strengths (S) |
1/5 |
1 |
1/3 |
1/7 |
0.056 |
Threats (T) |
1 |
3 |
1 |
1/5 |
0.159 |
Opportunities (O) |
3 |
7 |
5 |
1 |
0.579 |
RC = 0.039 |
|||||
Source: Compiled by author
TABLE A.2. Pairwise comparison matrix, degrees of importance and Consistency Ratio of the subgroup for the Weakness (W) factor.
WEAKNESSES Group |
I |
G |
R |
Degree of importance |
Inputs (I) |
1 |
1/7 |
1/5 |
0.078 |
Governance (G) |
7 |
1 |
1 |
0.487 |
Results (A) |
5 |
1 |
1 |
0.435 |
RC =0.011 |
||||
Source: Compiled by author
TABLE A.3. Pairwise comparison matrix, degrees of importance and Consistency Ratio of the subgroup corresponding to the Strength (S) factor.
STRENGTHS Group |
I |
G |
R |
Degree of importance |
Inputs (I) |
1 |
1/5 |
1/3 |
0.105 |
Governance (G) |
5 |
1 |
3 |
0.637 |
Results (A) |
3 |
1/3 |
1 |
0.258 |
RC = 0.033 |
||||
Source: Compiled by author
TABLE A.4. Pairwise comparison matrix, degrees of importance and Consistency Ratio for the Threats (T) factor subgroup.
THREATS Group |
P |
S |
T |
Degree of importance |
Political (P) |
1 |
3 |
5 |
0.659 |
Socio-economic (S) |
1/3 |
1 |
1 |
0.185 |
Technological (T) |
1/5 |
1 |
1 |
0.156 |
RC = 0.025 |
||||
Source: Compiled by author
TABLE A.5. Pairwise comparison matrix, degrees of importance and Consistency Ratio of the set of indicators corresponding to the Weaknesses-Inputs (WI) sub-factor.
WEAKNESSES-INPUTS Subgroup |
WI1 |
WI2 |
WI3 |
Degree of importance |
Low public education expenditure relative to GDP (WI1) |
1 |
1/5 |
1/5 |
0.091 |
Low cumulative expenditure per pupil (WI2) |
5 |
1 |
1 |
0.455 |
Notable territorial inequality (WI3) |
5 |
1 |
1 |
0.455 |
RC = 0.000 |
||||
Source: Compiled by author
TABLE A.6. Pairwise comparison matrix, degrees of importanace and Consistency Ratio of the set of indicators for the Weaknesses-Governance (WG) sub-factor
WEAKNESSES-GOVERNANCE Subgroup |
DG1 |
DG2 |
DG3 |
DG4 |
Degree of importance |
Insufficient attention to evidence on policies (WG1) |
1 |
1 |
5 |
5 |
0.417 |
Insufficient attention to accountability (WG2) |
1 |
1 |
5 |
5 |
0.417 |
Weak teacher education systems (WG3) |
1/5 |
1/5 |
1 |
1 |
0.083 |
Weak school leadership systems (WG4) |
1/5 |
1/5 |
1 |
1 |
0.083 |
RC = 0.000 |
|||||
Source: Compiled by author
TABLE A.7. Pairwise comparison matrix, degrees of importance and Consistency Ratio of the set of indicators corresponding to the Weaknesses-Results (WR) sub-factor.
WEAKNESSES-RESULTS Subgroup |
WR1 |
WR2 |
WR3 |
Degree of importance |
Low performance in basic skills (WR1) |
1 |
1/2 |
5 |
0.333 |
Low level of excellence (WR2) |
2 |
1 |
7 |
0.592 |
High level of early school leavers (WR3) |
1/5 |
1/7 |
1 |
0.075 |
RC = 0.007 |
||||
Source: Compiled by author.
Note: The clear preponderance in the assessment of indicator WR2 over WR3 is mainly justified by the different nature of the underlying data source: the former are derived from objective evidence, the latter are of purely administrative origin and therefore modulable.
TABLE A.8. Pairwise comparison matrix, degrees of importance and Consistency Ratio of the indicator set for the Strengths-Inputs (SI) sub-factor.
STRENGTHS-INPUTS Subgroup |
SI1 |
SI2 |
SI3 |
Degree of importance |
Resources for Scholarships and Grants (SI1) |
1 |
1/5 |
1/3 |
0.109 |
Level of teachers’ salaries (SI2) |
5 |
1 |
2 |
0.582 |
Educational expenditure on private institutions (SI3) |
3 |
1/2 |
1 |
0.309 |
RC = 0.003 |
||||
Source: Compiled by author
Note: The lower relative strength of the SI1 indicator in the allocation of weights is a reflection of the evidence in the international comparison.
TABLE A.9. Pairwise comparison matrix, degrees of importance and Consistency Ratio of the indicator set for the Strengths-Governance (SG) sub-factor.
STRENGTHS-GOVERNANCE Subgroup |
SG1 |
SG2 |
SG3 |
Degree of importance |
A consolidated bureaucracy (SG1) |
1 |
7 |
3 |
0.669 |
Formal mechanisms of cooperation between educational administrations (SG2) |
1/7 |
1 |
1/3 |
0.088 |
A plural educational offer (SG3) |
1/3 |
3 |
1 |
0.243 |
RC = 0.006 |
||||
Source: Compiled by author
TABLE A.10. Pairwise comparison matrix, degrees of importance and Consistency Ratio of the indicator set for the Strengths-Results (SR) sub-factor.
STRENGTHS-RESULTS Subgroup |
SR1 |
SR2 |
SR3 |
Degree of importance |
High rates of early childhood education (FR1) |
1 |
1 |
3 |
0.405 |
High rates of tertiary education graduates (FR2) |
1 |
1 |
5 |
0.481 |
Very high enrolment rates in primary and ESO (FR3) |
1/3 |
1/5 |
1 |
0.114 |
RC = 0.025 |
||||
Source: Compiled by author
Note: The lower relative weight of the SR3 indicator is justified because, although it represents an intrinsic strength of the system, in comparative terms it is widespread in developed countries.
TABLE A.11. Pairwise comparison matrix, degrees of importance and Consistency Ratio of the set of indicators for the Threats-Political (TP) sub-factor.
THREATS-POLITICAL Subgroup |
TP1 |
TP2 |
TP3 |
Degree of importance |
Lack of basic political agreement (TP1) |
1 |
5 |
3 |
0.659 |
Weak political opposition in education (TP2) |
1/5 |
1 |
1 |
0.156 |
Comparative advantage in political advantage of competing countries (TP3) |
1/3 |
1 |
1 |
0.185 |
RC = 0.025 |
||||
Source: Compiled by author
Note: Evidence shows how often the lack of political agreement leads to instability in education reforms in Spain.
TABLE A.12. Pairwise comparison matrix, degrees of importance and Consistency Ratio of the set of indicators for the SocioEconomic Threats (SE) sub-factor.
THREATS-SOCIOECONOMIC Subgroup |
TS1 |
TS2 |
TS3 |
TS4 |
Degree of importance |
Changes in the economic and financial policy of the EU and the ECB (TS1) |
1 |
3 |
1/3 |
3 |
0.248 |
Increased social spending due to ageing of the population (TS2) |
1/3 |
1 |
1/5 |
3 |
0.126 |
Failure of young people to enter the labour market (TS3) |
3 |
5 |
1 |
5 |
0.554 |
Effects of pandemics (TS4) |
1/3 |
1/3 |
1/5 |
1 |
0.073 |
RC = 0.073 |
|||||
Source: Compiled by author
TABLE A.13. Pairwise comparison matrix, degrees of importance and Consistency Ratio of the set of indicators for the Threats-Technological (TT) sub-factor.
THREATS-TECHNOLOGICAL Subgroup |
TT1 |
TT2 |
TT3 |
Degree of importance |
Pressure due to job cuts (TT1) |
1 |
1/3 |
1/5 |
0.105 |
Risk of depersonalization of the teacher-student relationship (TT2) |
3 |
1 |
1/3 |
0.258 |
Interferences with basic learning processes (TT3) |
5 |
3 |
1 |
0.637 |
RC = 0.033 |
||||
Source: Compiled by author
Note: The attribution of pairwise weights has taken into account the indirect nature of the effects of TT1 versus the direct and extensive nature of TT3.
TABLE A.14. Pairwise comparison matrix, degrees of importance and Consistency Ratio of the set of indicators corresponding to the Opportunities-Political (OP) sub-factor.
OPPORTUNITIES-POLITICAL Subgroup |
OP1 |
OP2 |
OP3 |
Degree of importance |
Expectations of policy change (OP1) |
1 |
1/3 |
3 |
0.258 |
EU pressure on education (OP2) |
3 |
1 |
5 |
0.637 |
International information Successful education policies (OP3) |
1/3 |
1/5 |
1 |
0.105 |
RC = 0.033 |
||||
Source: Compiled by author
Note: The attribution of peer weights has taken into account the increasing EU pressure on education as a consequence of the parallel importance given to education and training, according to the policy approaches of the European Council.
TABLE A.15. Pairwise comparison matrix, degrees of importance and Consistency Ratio of the set of indicators for the Socio-Economic Opportunities (OS) sub-factor.
OPPORTUNITIES- SOCIOECONOMIC Subgroup |
OS1 |
OS2 |
OS3 |
Degree of importance |
Next Generation Funds (OS1) |
1 |
3 |
1/3 |
0.258 |
Demographic reduction of pupil numbers (OS2) |
1/3 |
1 |
1/5 |
0.105 |
Intergenerational transmission of parents’ educational level (OS3) |
3 |
5 |
1 |
0.637 |
RC = 0.033 |
||||
Source: Compiled by author
Note: The attribution of pairwise weights has taken into consideration the robust predictability of the OS3 indicator.
TABLE A.16. Pairwise comparison matrix, degrees of importance and Consistency Ratio of the set of indicators corresponding to the Opportunities-Technological (OT) sub-factor.
OPPORTUNITIES-TECHNOLOGICAL Subgroup |
OT1 |
OT2 |
OT3 |
Degree of importance |
Remote and global interactions between educational actors (OT1) |
1 |
1/5 |
1/3 |
0.105 |
New Technological tools for performance improvement (OT2) |
5 |
1 |
3 |
0.637 |
Operational development of learning analytics (OT3) |
3 |
1/3 |
1 |
0.258 |
RC = 0.033 |
||||
Source: Compiled by author
Contact address: Francisco López Rupérez. Universidad Camilo José Cela, Facultad de Educación, Cátedra de Políticas Educativas. Castillo de Alarcón, 49. Urb. Villafranca del Castillo, Villanueva de la Cañada, 28692. Madrid. Spain. E-mail: flopezr@ucjc.edu
_______________________________
1 For a detailed description of the mathematical procedure and its calculation algorithms, see Coyle (2004)
2 Statistics on Grants and Study Aids. General Subdirectorate of Statistics and Studies of the Ministry of Education and Vocational Training.
3 https://www.educacionyfp.gob.es/mc/conferencia-sectorial-educacion/funcionamiento.html
4 http://estadisticas.mecd.gob.es/EducaDynPx/educabase/index.htm?type=pcaxis&path=/laborales/insercion/afil&file=pcaxis&l=s0
5 https://www.universidades.gob.es/portal/site/universidades/menuitem.78fe777017742d34e0acc310026041a0/?vgnextoid=b747122d36680710VgnVCM1000001d04140aRCRD
6 https://www.lamoncloa.gob.es/temas/fondos-recuperacion
7 Note: (**) Global priority above 0.100; (*) Global priority between 0.050 and 0.100. Indicators with global priorities below 0.010 have been ignored in this Table.