Educational trajectories, traceability, and self-perception of grades in post-compulsory transitions1
Itinerarios educativos, trazabilidad y autopercepción de notas en las transiciones postobligatorias
DOI: 10.4438/1988-592X-RE-2022-396-531
Maribel Garcia Gracia
Albert Sánchez-Gelabert
Universidad Autónoma de Barcelona
Ona Valls Casas
Universidad de Viena
Abstract
The aim of this article is to describe and analyze the continuities and ruptures in students’ educational trajectories in the transition to post-compulsory education. The incidence of social inequalities and the mediation of the self-perception of school grades in their educational choices are investigated. Using a path analysis model, we analyze data from a follow-up panel of a cohort of young Barcelona students born in 1998. The final sample is 868 young people, out of the initial 2,056, given the attrition. The sample is stratified according to the ownership of the schools (private/public) and the social complexity of the school context. The results show that “non-traditional” educational trajectories are increasingly common among students, with a greater presence of discontinuities, ruptures, and changes of studies in vocational training itineraries and second chance pathways. They also evidence the dichotomy between the de-standardization of young people’s trajectories and the rigidities of the educational system and the unequal incidence of social origin and self-perceived grades on educational choices. This places the discussion about results in the sphere of academic and vocational guidance policies and the role of educational agents, particularly secondary schools. The results also highlight the relevance of incorporating longitudinal analysis and its traceability dimension into the study of post-compulsory transitions.
Keywords: Secondary education, dropout, social inequality, longitudinal studies. (Self-perception)
Resumen
El presente artículo tiene por objetivo describir y analizar las continuidades y rupturas en los itinerarios formativos de los jóvenes en sus transiciones tras finalizar de la enseñanza secundaria obligatoria. Se ha analizado la incidencia de las desigualdades sociales y la mediación de la autopercepción de las notas en sus elecciones educativas. A partir de un modelo de Path analysis se han explotado los datos de un panel de seguimiento, de una cohorte de jóvenes de la ciudad de Barcelona nacidos en 1998. La muestra final fue de 868 jóvenes, sobre una muestra inicial de 2056, dada la atrición de la misma. La muestra fue estratificada en función de la titularidad de los centros) y la complejidad social del entorno. Los resultados muestran que las trayectorias educativas “no tradicionales” son cada vez más comunes entre los estudiantes, con una mayor presencia de discontinuidades, rupturas y cambios de estudios en los itinerarios de formación profesional y en las vías de segunda oportunidad. También ilustran el dilema existente entre la des- estandarización de los itinerarios de los/las jóvenes y las rigideces del sistema educativo y la desigual incidencia del origen social y la autopercepción de notas sobre las elecciones educativas. Ello sitúa la discusión de los resultados en el plano de las políticas de orientación académica y profesional y en el papel de los agentes educativos, en particular de los centros de secundaria. Los resultados ponen también de manifiesto la relevancia de incorporar el análisis longitudinal y su dimensión de trazabilidad en el estudio de las transiciones postobligatorias
Palabras clave: Educación secundaria; abandono escolar; desigualdad social; estudio longitudinal. (auto) percepción
Introduction
The transition from compulsory to post-compulsory education is a critical event in the life course of young people and in the study of the inequality of educational opportunities (Jackson, 2013; Martínez, 2007; Triventi et al., 2016). The transition to upper secondary education is an advantageous decision point for the analysis of trajectories and social inequalities (Breen & Goldthorpe, 1997; Gambetta, 1987; Mare, 1980). These decisions largely shape young people’s professional trajectories and the societal position hey will occupy in the future. The “choice” made by students and/or their families is not made in a vacuum but is rather a decision born of a complex process in which social inequalities operate with an unequal impact on the results obtained and on students’ choices. When analysing transitions, it is especially important to consider the meeting point of students’ educational opportunities and decisions, where in educational trajectories are the expression of an unequal social space in which choices are mediated by social origin. This is partly due to the inequality of educational performance due to primary effects (PE), or more precisely the influence of social origin on unequal academic success, a widely studied phenomenon in the sociology of education from the theories of cultural reproduction (Bourdieu & Passeron, 1981). Many studies have shown that there is a greater representation of young people from humble socioeconomic backgrounds and with low cultural capital in dropout trajectories (García, Casal, Merino, & Sánchez-Gelabert, 2013; Julià, 2018; Valdés, 2019). Other analyses point to the diversity and vulnerability of young people from families with low economic and cultural capital and of immigrant origin and their greater likelihood of developing dropout or intermediate vocational training trajectories (Olmos, Mas, & Salvà, 2020). While these variables are fundamental to explain the inequality of educational performance, they are not sufficient to explain the choices in the transition to upper secondary education (Jackson, 2013) since the influence of social class also operates as a secondary effect (SE) in the decision-making processes.
Following Boudon (1974), choices depend, on the one hand, on effects of social origin on students’ performance (primary effects), and, on the other hand, on secondary effects influencing the cost-risk-benefit calculation (Erikson & Jonsson, 1996) an individual makes beyond their objective capacities. SEs include unequal individual and family aspirations and expectations (socially constructed), with the perception of risk and success of a specific educational option and the economic and opportunity costs of each (Boudon, 1974; Breen & Goldthorpe, 1997). These effects have been widely studied from the rational choice theory paradigm, in its sociological version, (Boudon, 1983) and in particular from the educational decisions model (Breen & Goldthorpe, 1997; Gambetta, 1987).
We include self-perception of grades in its SE dimension, following studies like those of Sullivan (2001) and Torrents (2016), who identify the effects of social origin on the over- and under-estimation of educational abilities. In line with Torrents (2016), the social origin bias in the self-perception of grades confers the SE dimension. Following the analytical DBO scheme (Desires, Beliefs, and Opportunities), self-perception of grades is a factor that forms part of students’ beliefs, and as such can have an obvious effect on educational choices by indirectly defining the perceived chances of success in each educational option. The analysis model proposed aims to contribute with new evidence of the relationship between social origin and educational choices, taking self-perception of ability as proxy for probability of perceived success (secondary effect), which mediates in the transitions to post-compulsory education.
Pathways, trajectories, and traceability
Since the last decades of the twentieth century (Casal, García, Merino, & Quesada, 2006; Serracant, 2015), we have been witnessing increasing diversification in terms of young people’s trajectories, in part due to the educational expansion that took place in Spain in the 1980s and 1990s, giving rise to an increased social heterogeneity of students and pathways.
The ongoing educational reforms and counter reforms starting in the 1980s (LOGSE, 1990; LOCE, 2002; LOE, 2006; LOMCE, 2013 y LOMLOE, 2020), have also intervened in pathway diversity, especially since the LOE (2006) was approved, introducing forms of diversification in the last year of lower secondary school (directed towards vocational training or baccalaureate) and extended in subsequent reforms such as LOMCE. This period also witnessed the official regulation of tests and courses, making access to intermediate vocational training, leading on to higher vocational training (LOE, 2006), more flexible while simultaneously making post-compulsory transitions more complex, with “non-traditional” educational trajectories now increasingly commonplace among students (Milesi, 2010). These processes have contributed to the growing individualization and diversification of trajectories, reducing the presence of the former linear pathways and consolidating the new central role played by the ways in which young people conduct their transitions and the effects of the inequality of educational opportunities on post-compulsory education (Denice, 2019; Valdés, 2019).
The trajectories constructed by young people from the pathways established by education systems need to be distinguished both conceptually and analytically. The secondary education pathways available are a product of curricular and normative design, or in other words of the organisation of the education system into levels with access and connectivity regulations between them. Contrarily, educational trajectories have a basic biographical component in the sense that they are the outcome of the combined educational decisions made by students in a social and normative context. While the educational pathways are a structuring element, the analysis of young people’s trajectories has a dynamic and agentic dimension. They are social constructs based on an individual’s educational decisions, expressing a complex relationship between structure and agency among the structural determinants of inequality and individuals’ margins of freedom in decision making.
Educational inequality, however, does not only crystallise in the educational levels reached by young people, but also in different process indicators from which their trajectories are defined, or in other words educational traceability. Traceability defines educational trajectories depending on the ways in which young people make the transition to post-compulsory education. Introducing traceability into the analysis of educational itineraries is essential to detect qualitative differences in post-compulsory transitions (Lucas, 2001).
Studies like the one by Milesi (2010) show that deviations from a traditional trajectory (linear) are very usual and occur more frequently among the most socioeconomically and academically challenged students. The possible impact of the ways of making the transition on the final grades obtained should also be considered. Some research has analysed students’ experiences of repeating a year as a factor that impacts on academic performance, demonstrating that students who have repeated a year are more likely to have disastrous results in the PISA tests (Calero et al., 2010). Other studies identify problems of attitude and school disengagement among students who repeat a year (Méndez & Cerezo, 2017). Ikeda and García (2014) also point out an effect of social origin on school performance in countries where there are more repeat students.
Other indicators that allow us to measure educational traceability are interruptions and discontinuities. Studies like the one by Andrews (2018) show the effects of these trajectories on engagement (emotional, behavioural, and cognitive) and dropout. The results reveal a lower level of involvement among students with discontinuity and those held back a year, in addition to higher dropout rates than among students with linear pathways in the case of upper secondary education (Bozick & DeLuca, 2005; Milesi, 2010).
González-Rodríguez (2019), among others, report the incidence of individual variables, associated with the behaviour and family variables regarding dropout, while other studies point to a school and teacher expectations effect (Tarabini, 2016). Furthermore, situations of educational rupture and interruption impact on definitive dropout and are especially important if we consider the low rate of re-entry into the education system and the negative outcomes this predicts for young people’s future educational progress (Pfeffer & Goldrick-Rab, 2011).
The longitudinal and biographic perspective allows the identification of the new ways in which educational inequality can operate. The analysis of the traceability of educational trajectories requires a longitudinal and biographical methodology approach.
Method
The objective of this paper is to analyse how self-perception of grades intervenes in educational choices in the transition to post-compulsory education. To this end, the incidence of educational inequalities (students’ sociodemographic characteristics) on self-perception of results is analysed and the trajectories characterised according to the unequal presence of linear and “non-linear” trajectories. First, a typology of educational trajectory was developed from a longitudinal perspective, incorporating the final level reached by young people and different dimensions of educational traceability (repetitions, discontinuities, and transfers to other educational options). A Path Analysis model was developed based on this typology to study the incidence of the sociodemographic variables on the trajectories and the mediating effect introduced by students’ self-perception of the grades they expected to obtain at the end of the year on this relationship.
DIAGRAM I. Analysis model
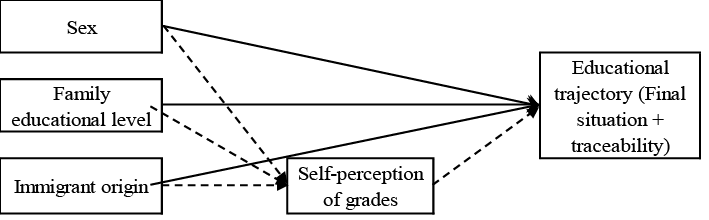
Following this model, four working hypotheses are formed:
1. Linear and non-linear trajectories (repetition, changes of course of study, and discontinuities) have an unequal presence in the final pathways taken by students. More linear trajectories are expected in the academic pathways (baccalaureate) due to a greater presence of young people from families with higher cultural capital (parents with a university education) and the associated academic requirements. Repeating a year will be more present in the intermediate level vocational training pathways due to the percentage of young people who have accumulated some academic difficulties throughout their schooling (García & Sánchez-Gelabert, 2020). Discontinuous trajectories (dropout and return to the education system) will be more present in the pathways shaped by students with a more socioeconomically and academically disadvantages profile, in line with Milesi (2010).
2. Sociodemographic variables like family cultural capital, sex and immigrant origin will affect self-perception of grades. More specifically, it is expected that the young people from families with high cultural capital (a university level education) have a high self-perception of grades which, irrespective of their objective capacities, can be acting as an aversion to risk mechanism (Breen & Goldthorpe, 1997). Contrarily, sex and immigrant origin will tend to intervene less, although lower self-perception among girls is expected, in line with the findings of Torrents (2016), who report that the underestimation of abilities among advanced students from a lower social background mainly occurs among girls and the native population, as opposed to among those with an immigrant background.
3. The sociodemographic variables and self-perception of grades will have a direct effect on educational itineraries due to the unequal effect of migrant origin, sex, and family cultural capital on educational choices. To this effect, self-perception of grades will also have a direct effect on the itineraries given that these expectations guide the choices made. It will be young people with higher expectations of good grades, those with a higher family educational level, native Spanish students, and women who will have a greater presence in the academic and linear itineraries, and it will be men, students of immigrant origin, students from families with low cultural capital, and those with low expectations in terms of academic results who will have a greater presence in the other itineraries.
4. The combination of sociodemographic variables and self-perception of grades will have a differential impact on the educational trajectories (indirect effects, mediated by self-perception of grades). There will be a greater presence of young people from families with a high educational level in linear post-compulsory itineraries even when self-perception of grades is low, while the students from families with an intermediate or low educational level, or post-compulsory and compulsory, respectively, will have less presence in the linear academic itineraries, even when self-perception of grades is high.
Sample
The data presented is part of a panel study, which itself is part of an international study (ISCY Project2), the general objective of which was to analyse the educational choices in the post-compulsory transitions of young people who live in urban contexts and the associated inequality phenomena. The sample was decided by each participating team, using a city criterion (urban context) and a cohort criterion (born in 1998), irrespective of the educational level or academic year they were in. In our case, the city of Barcelona was chosen, given the opportunities it provided for the research team, selecting a stratified, two stage sample of 27 schools and 2,056 students (T0) with 95% confidence interval and a sample error of 5%. The sample was structured according to school ownership, state-owned or state-subsidised and privately owned (“concertados”), and the social complexity of the school, based on an index compiled by the Inspector of Education from the Department of Education of the Government of Catalonia.
The project was designed using a panel methodology. In the case of Barcelona, the field work was carried out in four periods (TO, in 2014, which was the first year of surveying, and three subsequent waves: T1 in 2015, T2 in 2016, and T3 in 2017)3. The inevitable sample attrition in longitudinal studies of this type reduced the total number of students to 1,794 in the second survey, 1,482 in the third survey, and 868 in the last survey. To correct the effects of attrition we proceeded to weight the database (Inverse Probability Weighting). Based on the first survey (cohort sample), the probability of the non-missing information was calculated using a logistic regression model, in successive waves with the covariables as their possible predictors. The variables shown to be significant were family educational level and expected grades. Based on these three variables, the probability of a “yes” response from each individual (using logistic regression) and the corresponding weight were calculated. Last, we applied the weighting and selected the “yes” response cases in the last wave analysed, obtaining a weighted sample of 1,670 cases (T3).
Instruments, origin, and analysis
A specific questionnaire was design for the data collection. In a first block of questions (T0), basic sociodemographic information including age, sex, immigrant status, family structure, family cultural capital, parents’ employment situation, and previous school trajectory was collected. The second block of questions collected information about student engagement (cognitive, behavioural, and emotional), and the third block focused on academic and professional expectations and choice of studies. The subsequent, briefer questionnaires ((T1, T2 i T3) collected information about the current situation of the student in relation to their studies, work, and other situations. They also collected information about school achievement, reasons for their choice or for dropping out, and their expectations for the following academic year.
The questionnaire was constructed and discussed by the international research teams and tested in different cities. In the case of Barcelona, it was previously piloted in two secondary schools with a similar social composition (130 answers) to validate its internal consistency. An Ethics Research Committee (made up of the national research team, the Barcelona Education Consortium, and the CSASEC authorised the questionnaire, ensuring compliance with the ethical principles concerning human dignity, confidentiality, and non-discrimination. The questionnaires were administered with the involvement and support of the above-mentioned entities, education inspectors, and the 27 participating centres.
The method of administering the questionnaire in schools in the first phase of the project (T0) was face-to-face, through an online application. In some cases, the students gave their responses on paper, always with a member of the research team present. In the second wave of the project, most of the questionnaires were administered face-to-face in the schools, except for students that had already left the school, who were interviewed by telephone. In the third wave of the study, only a third of the questionnaires could be administered face-to-face, with the rest completed by telephone interview since most of the students had already left the school. All the questionnaires were administered by telephone in the fourth wave of the project.
Procedure
The analysis was carried out using the path analysis technique based on the statistical software MPlus 8. This type of analysis is used to model the structural relationships between observed variables, allowing the analysis of how one or more variables mediate in the relationships among other variables. Path analysis allows the fit of theoretical models to be evaluated where a set of relationships of dependency among variables are proposed. To this effect, each arrow presents a standardized coefficient which indicates the magnitude and sign of the effect (positive or negative) of a variable on another endogenous variable. In other words, these coefficients are partial regression coefficients, representing the effect of one variable on another while controlling the rest of the variables. To interpret the coefficients of the model, βs > .05 is considered a small effect, βs > .10 a moderate effect, and βs > .25 a large effect (Keith, 2015). Furthermore, the “Weighted Least Squares with Robust Means and Variances” (WLSMV) method was used to estimate the model because it is a suitable method for dichotomous and categorical dependent variables.
This type of analysis allowed the entire theoretical model to be analysed, incorporating the six resultant trajectories as dependent variables, and controlling the regressions by the sociodemographic variables. Furthermore, it allowed the analysis of the indirect effects of the sociodemographic variables on the educational pathways, mediated by the self-perception of grades. In other words, we were able to analyse whether the fact of having a high or low self-perception of grades modified the inequalities when they occurred according to the social profile of the students in the choice of studies. Our aim was to produce a model that related the variables sex, generation of immigration, family educational level, and self-perception of grades in 4th ESO to the later educational pathways.
Independent variables
The independent variables considered in the analysis are shown in Table 1 below.
TABLE I. Values of the independent variables
|
Variable |
Response options |
N (%) |
|
Family educational level4 |
Compulsory education Post-compulsory education University education |
667 (33.4 %) 516 (25.8%) 816 (40.8%) |
|
Sex |
Men Women |
1,087 (52.9%) 969 (47.1%) |
|
Immigrant origin |
Born in Spain from native parents |
1,470 (76.7%) |
|
Born in Spain from foreign parents |
86 (4.5%) |
|
|
Arrived aged11 or under |
260 (13.6%) |
|
|
Arrived over age |
100 (5.2%) |
|
|
Perception of Grades |
Very good grades |
314 (15.4%) |
|
Good results |
749 (36.7%) |
|
|
I will pass |
729 (35.8%) |
|
|
Bad grades |
208 (10.2%) |
|
|
Very bad grades – lots of fails |
39 (1.9%) |
Following the analytical scheme proposed by Hedström (2005), we considered the self-perception of expected grades at the end of ESO as a factor that would form part of the students’ beliefs, potentially having a clear effect on educational choices by indirectly defining the perceived probability of success for each educational option. The following question was used in the survey: “How do you think your schooling will go this year”, with the following response options: “I think I will get very good grades, A’s and B’s”; “I think I will get good grades, B’s and C’s”; “I think I will pass”; I think I will get bad grades, including some fails”; “I think I will get very bad grades, including a lot of fails”. This variable expresses the different expectations of success among the students, depending on their appraisal of previous academic performance. A correlation analysis was carried out to check for possible self-appraisal bias, using the question, “How do you think your schooling will go this year” from the first panel survey in 2015 and the grades they finally obtained in the 2016 survey. A high correlation between the two was demonstrated. To this effect, despite the element of subjectivity, self-perception of grades was incorporated as “proxy” for the perception of the probability of success and its mediating effect on the educational choices made. The mediation of self-perception on choices is analysed for the main sociodemographic variables, i.e., family educational level, immigrant origin, and gender.
Dependent variable: educational trajectories
A sequences analysis was performed to construct the educational trajectories over the three years analysed and to identify their traceability. This analysis showed a high complexity (more than 130 itineraries were identified), which was simplified by means of a cluster analysis that introduced the education situation at the end of the period and the events related to educational traceability (repetition, reorientations, and discontinuities (dropouts and re-entries into the education system). To do so, the Euclidean distance to the square was used as a measure of similarity and the Ward’s hierarchical clustering method, and six types of grades were selected based on the dendrogram, conserving the groups that maintained a strong internal homogeneity. The typology resulting from the hierarchical cluster is described in the results section that follows.
Results
Educational trajectories and traceability
The cluster analysis identified six trajectories resulting from the conjugation of educational level and traceability (Table II). There was one clearly linear trajectory, Linear Academic; two itineraries predominated by repetition, Academic with Repetition and Intermediate Level Vocational (CFGM) with Repetition; one Higher Vocational Training (CFGS), characterised by option changes resulting largely from re-orientation processes; and two vulnerable educational itineraries, Dropout after lower secondary education (ESO), and Second chance Opportunities with discontinuity”).5
TABLE II. Educational itinerary and traceability
|
Educational Itineraries |
n |
% |
|
Itinerary. 1. CFGM with predominance of repetition |
258 |
14.2 |
|
Itinerary 2. Linear Academic |
1032 |
57.0 |
|
Itinerary 3. Second chance opportunities with discontinuities |
121 |
6.7 |
|
Itinerary 4. Dropout after ESO |
79 |
4.4 |
|
Itinerary 5. CFGS with predominance of re-orientation |
188 |
10.4 |
|
Itinerary 6. Academic with repetition |
134 |
7.4 |
|
Total |
1812 |
100 |
As Table 2 shows, the linear academic itinerary (ESO-Baccalaureate-University) is the one that presents the highest percentage, including more than half the young people in the sample (57%). To this we can add a small percentage of young people (7.4%) that also describe an academic itinerary, but with repetition.
The next most important itinerary in terms of percentages of the total were CFGM with predominance of repetition and CFGS with predominance of orientation. The first (14.2%) brings together students that had gone from compulsory (or lower) secondary education to CFGM intermediate level vocational training, with the presence of repetition particularly relevant, while the second (10.4%) brings together young people with diverse access pathways (baccalaureate, CFGM, or the tests and courses to access this level).
Last, the most educationally vulnerable itineraries were the second chance itineraries (6.7%), which included young people in adult education centres who take tests and courses to access vocational training (second chance with discontinuity), and the school dropout itinerary (4.4%), characterised by multiple experiences of repetition or by educational discontinuity that culminates in dropout.
In line, therefore, with the first hypothesis, these results evidence the unequal presence of repetition, changes of option, and discontinuities in the final itinerary reached, and the strong presence of non-linear itineraries.
Characterisation of the educational itineraries
The characterisation of the different itineraries (Diagram II) was carried out based on the theoretical model. In the evaluation of the fit of the model it was considered that the goodness of fit was adequate if the coefficient CFI and TLI was greater than .90 (Byrne, 2001) and if the coefficient RMSEA was less than .08 (Kline, 1998). To this effect, it was observed that the parameters CFI and TLI were greater than .95 (CFI = .974; TLI = .965) and the parameter RMSEA was less than .05 (RMSEA = .046), confirming that the final fit of the model was good.
Regarding the second hypothesis, the results showed that students’ perception of the grades they would obtain at the end of ESO has a direct relation with the sociodemographic variables analysed (sex, family educational level, and generation of immigration). The results shown in Diagram II can be interpreted as the influence of self-perception of grades and the sociodemographic variables on the final itineraries.
DIAGRAM II. Influence of sociodemographic variables and self-perception of grades on itineraries
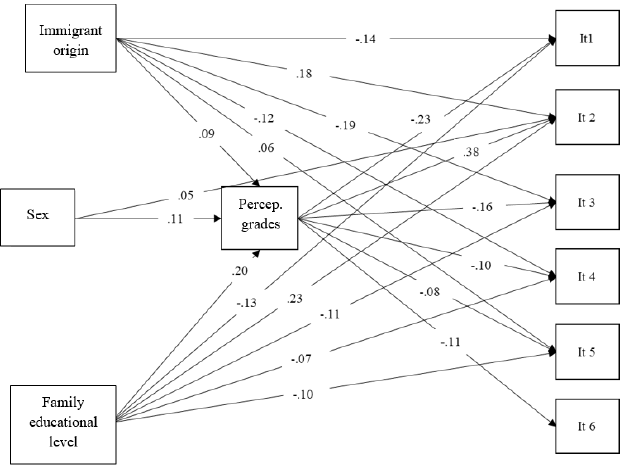
Bearing in mind the hypothesis formulated, the results show how family educational level is the variable that intervenes most in the final itineraries. The young people from families with a high family educational level presented a significant positive correlation (.23) in the linear academic itinerary and a negative correlation in the other itineraries. The same applied to the young people from native Spanish families in the linear academic (.18) and the CFGS (.06) itineraries, and a negative correlation in the rest. Meanwhile, sex (woman) only presents a positive correlation (.05) in the linear academic itinerary and a negative correlation in the rest.
Regarding self-perception of good grades, the young people from families with a university education stand out (.20), with the girls above the boys (.11) and the native Spanish population (.09), in the order shown.
The incidence of the sociodemographic variables and self-perception of grades on the itineraries (direct effects).
The results obtained allowed us to show the direct effects of the sociodemographic variables and the self-perception of grades on the itineraries. Regarding the CFGM itinerary with a predominance of repetition, the young people whose parents had finished compulsory or post-compulsory education presented a stronger relationship and a higher probability of being in this professional itinerary, with a strong (.30) and a moderate (.14) relationship, respectively. Meanwhile, the young people of native Spanish origin had a lower probability of being in this itinerary, given that a strong negative relationship was observed (-.29), and likewise for the young people with a high self-perception of grades (-.23)
Regarding the second itinerary, linear academic, the young people of native Spanish origin, those from families with a university education, and the young people that expect to get good grades had a greater probability of being in this itinerary, which as already pointed out was characterised by linearity.
The third itinerary (second chance with discontinuity), characterised by dropping out of and re-entering the education system, had a strong relationship (.26) with the young people whose families had a compulsory education, while the young native Spanish people and those that had a perception of good grades presented a lower probability of being in this itinerary given the negative sign of the coefficient (-.41 and -.16, respectively). The young native Spanish people were the group that was most distant from itineraries of this type, with a very high coefficient. Similar results were observed in the dropout after ESO itinerary.
The young people of native Spanish origin stood out in the CFGS with experiences of reorientation itinerary, with a moderate coefficient (.16), those with a post-compulsory family educational level, with a high coefficient (.27), and those with a compulsory educational level, with a moderate coefficient (.19). Last, in the academic with repetition itinerary, the only observation was how self-perception of grades (low) had a direct relationship with this itinerary.
The differential impact of self-perception of grades according to the sociodemographic variables on the itineraries (indirect effects)
Regarding hypothesis 4, the joint impact of the sociodemographic variables and self-perception of grades on the educational itineraries described was analysed (Table IV). This represents the differential impact or the unequal mediation of self-perception of grades on the itineraries depending on the family educational level, sex, and immigrant origin of the students.
The results showed that like for the CFGM with predominance of repetition itineraries, young men had a higher probability of being in this itinerary even when they had a perception of good grades. The same applied to the young people of immigrant origin and those from families with a low (compulsory) and a medium (post-compulsory) educational level. To this effect, the perception of grades would not play a decisive role in the educational transitions of these students.
Unlike the previous itinerary described, the linear academic itinerary was more probable among young people of native Spanish origin and women, as opposed to young people of immigrant origin with good grades and men with good grades. This itinerary was less probable in the case of young people whose parents had a low educational level, even when self-perception of grades was high. These results can be interpreted as a consequence of an unequal effect of economic costs and young people’s opportunities depending on their social condition, and of an unequal perception of the risk (difficulty) associated with a longer academic itinerary. There was the “ceiling effect” of the social groups with more cultural capital at play, given the greater academic requirements involved in maintaining their social position (Boudon, 1974; Breen & Goldthorpe, 1997).
In the second chance with discontinuities itinerary, the students with the highest probabilities were the young people from families with a compulsory educational level or of immigrant origin, even when they had a self-perception of good grades. Notably, sex was a determinant factor in this itinerary. When all social conditions and grades were equal, the girls were underrepresented in the second chance options. The characteristics in terms of traceability were dropping out of and re-entering the education system.
The dropout after ESO itinerary had important parallels with the previous itinerary. The young people of immigrant origin, men, and the students from families with a compulsory level education presented higher probabilities of being in this itinerary, even when they had a self-perception of good grades. This did not occur, as we have already seen, with young people whose parents had a medium level or university education.
In the CFGS with predominance of reorientation and the academic with repetition itineraries, self-perception of good grades also had an unequal impact. In these two itineraries, there was a greater presence of young people from families with a low cultural capital, men, and students of immigrant origin, even when they had a self-perception of good grades.
Conclusions and discussion
The results presented contribute with some relevant information, both in terms of the relationships of the model and the main characteristics of each itinerary, and in terms of their contribution to the debate about education and transition policies, and particularly those directed at students who are socially vulnerable to dropout. We want to highlight four contributions to the scientific and political debate.
First, following Milesi (2010), the results show how the “non-traditional” educational trajectories are becoming increasingly common among students. This “de-standardisation” of trajectories in post-compulsory transitions is unequally distributed among the academic and professional trajectories, affecting the latter more profoundly, and among the “second chance” pathways. Students’ academic difficulties is one of the factors that explain the presence of non-linear trajectories, although it is not the only one since the sociodemographic variables also intervene. The question arises as to whether and to what degree the “non-linear” trajectories are failed trajectories, or whether they are choices that respond to a practical rationality. The non-linearity of the post-compulsory transitions requires specific study to identify the factors that condition these trajectories, and to see if they are also associated with a low quality of academic and professional guidance, with the economic and opportunity costs of the choices, or with critical events that impact on the biographies of the young people. These “non-linear” trajectories clash with the rigid organisational and curricular norms and period of learning set out by the education system, paving the way to the debate on the subjectivity of educational policies. As Ulrich Beck states, “to give reflexive modernisation shape, the institutions need to provide opportunities – spaces and resources- that allow the individual to learn, act, and take decisions. This implies going beyond the normative planes and their rational of causality” (Beck, 1992).
Second, the results evidence the unequal interaction of the relationship between social origin and self-perception of grades in terms of the educational decisions made in post-compulsory transitions, concurring with other studies (Bernardi & Cebolla, 2014). The relationship between family educational level and the educational itineraries reached are unequally mediated by self-perception of grades: there is a greater presence of offspring of families with higher educational levels (parents with a university education) in the academic itinerary when grades are lower (compensation effect mediating capital reconversion strategies), while students from families with a medium and low level education, post-compulsory and compulsory, respectively, have less probabilities, even when self-perception of grades is high. Even when they have good grades, young people of immigrant origin have less presence in the academic itinerary. These results have important implications for educational guidance policies and practices in high schools, where the expectations of young people from families with low capital cultural and of immigrant origin could be raised with the aim of achieving good school results.
A possible effect of unequal perception of risk (economic and/or academic) was also identified among the young male students of immigrant origin and those with low family cultural capital with a self-perception of good grades, who “do not dare” to choose the university option. This dissonance could be explained by factors associated with the increased costs of a university education (direct, indirect, the opportunity costs associated with immediate loss of income and time), inaccurate information received, or a strategy to minimise the perceived risk by pursuing higher vocational education in the decision to obtain a higher vocational training qualification.
The academic with repetition itinerary, which as discussed is characterised by self-perception of low grades, can be interpreted as the result of the social value of the academic trajectory, particularly among young people from families with higher level vocational qualifications or a university education, giving way to possible inertia and compensation effects, as discussed previously. Other inequality processes were also observed in the most vulnerable itineraries regarding the relationship between the sociodemographic variables and self-perception of grades, representing important challenges for educational policy in terms of improving the success rate (in both the first- and second chance options by diversifying the offer, personalised support, etc.), and for grants policies, which is especially pertinent for the young people who would like to stay in the education system (self-perception of high grades) but end up dropping out or are “relegated” to the less socially prestigious vocational training trajectories. In brief, there is a need to advance towards comprehensive transition policies, especially regarding education and training policies, and support and guidance policies.
Third, the results show how the academic itineraries predominate over the vocational ones, with a clear gender bias. This inequality is also evident in terms of girls’ reduced opportunities in the second chance trajectories, which could be interpreted as a consequence of their reduced presence in these itineraries, which furthermore have a very “masculinised” offer. This generates greater polarisation between the girls that take a dropout trajectory, which is often associated with the premature assumption of gender roles, and those that develop long academic itineraries.
Fourth, the results reflect the importance of incorporating longitudinal analysis and its traceability dimension into the study of post-compulsory transitions, allowing the dialectical analysis of the relationships between structure and agency, and shedding more light on the trajectories and the possible effects of the accumulation of inequalities. The high presence of non-linear trajectories points to the need to continue investigating biographical events and school experiences, and their incidence on the pathways and their traceability.
Educational traceability thus becomes an important element in the analysis of educational pathways and transitions and the associated inequality phenomena since sociodemographic variables not only impact on the level of studies young people reach, but they also influence the ways in which they make the transition to post-compulsory education. In this regard, it is important to complement the analysis with a qualitative methodological approach that enables us to investigate in greater depth the reasons for dropout and re-entry into the education system. One of the main difficulties of this study was the weighting of the sample to avoid the usual attrition in panel studies. For this reason and given the high economic cost and substantial effort involved in studies of this kind, keeping annual student records from the year they start in the system, containing personal, academic, and sociodemographic information, is recommended to be able to follow and analyse their educational trajectories throughout their schooling as has been done in some CCAA. This would provide us with an information observatory about educational transitions, the examination of which would provide an evidential basis for new careers guidance and educational policies.
Referencias bibliográficas
Andrews, B. D. (2018). Delayed Enrollment and Student Involvement: Linkages to College Degree Attainment. The Journal of Higher Education, 89(3), 368–396. https://doi.org/10.1080/00221546.2017.1390972
Beck, U. (1992). Risk society. Towards a new modernity. London: SAGE Publications.
Bernardi, F., & Cebolla, H. (2014). Clase social de origen y rendimiento escolar como predictores de las trayectorias educativas. Revista Española de Investigaciones Sociológicas, 146, 3–22. https://doi.org/10.5477/cis/reis.146.3
Boudon, R. (1974). Education, Opportunity, and Social Inequality: Changing Prospects in Western Society. New York: John Wiley & Sons Canada, Limited.
Boudon, R. (1983). La desigualdad de oportunidades: la movilidad social en las sociedades industriales. Barcelona: Laia.
Bourdieu, P., & Passeron, J. C. (1981). La reproducción. Elementos para una teoría del sistema de enseñanza. Barcelona: Laia.
Bozick, R., & DeLuca, S. (2005). Better Late Than Never? Delayed Enrollment in the High School to College Transition. Social Forces, 84(1), 531–554. https://doi.org/10.1353/sof.2005.0089
Breen, R., & Goldthorpe, J. H. (1997). Explaining educational differentials. Towards a formal rational action theory. Rationality and Society, 9(3), 275–305. https://doi.org/10.1177/104346397009003002
Calero, J., Choi, Á., & Waisgrais, S. (2010). Determinantes del riesgo de fracaso escolar en España: una aproximación a través de un análisis logístico multinivel aplicado a PISA-2006. Revista de Educación, Número Extra 1, 225–256.
Casal, J., García, M., Merino, R., & Quesada, M. (2006). Itinerarios y trayectorias. Una perspectiva de la transición de la escuela al trabajo. Trayectorias, VIII(22), 9–20.
Denice, P. (2019). Trajectories through postsecondary education and students’ life course transitions. Social Science Research, 80(January), 1–18. https://doi.org/10.1016/j.ssresearch.2019.02.005
Erikson, R., & Jonsson, J. O. (1996). Can Education be Equalized? The Swedish Case in Comparative Perspective. Boulder: Westview Press.
Gambetta, D. (1987). Were They Pushed or Did They Jump? Individual Decision Mechanisms in Education. Cambridge University Press.
García, M., Casal, J., Merino, R., & Sánchez-Gelabert, A. (2013). Itinerarios de abandono escolar y transiciones tras la enseñanza secundaria obligatoria. Revista de Educación, 361, 65–94. https://doi.org/https://doi.org/10.4438/1988-592X-RE-2011-361-135
García, M., & Valls, O. (2018). Trayectorias de permanencia y abandono educativo temprano: Análisis de secuencias y efectos de la crisis económica. Metamorfosis: Revista Del Centro Reina Sofía Sobre Adolescencia y Juventud, 8, 129–143.
García, M., & Sánchez-Gelabert, A. (2020). La heterogeneidad del abandono educativo en las transiciones posobligatorias. Itinerarios y subjetividad de la experiencia escolar. Papers. Revista de Sociologia, 105(2), 235 257. https://doi.org/10.5565/rev/papers.2775
González-Rodríguez, D., Vieira, M. J., & Vidal, J. (2019). The perception of Primary and Secondary School teachers about the variables that influence Early School Leaving. Revista de Investigacion Educativa, 37(1), 181–200. https://doi.org/10.6018/rie.37.1.343751
Hedström, P. (2005). Dissecting the social: On the principles of analytical sociology. Cambridge: Cambridge University Press.
Ikeda, M., & García, E. (2014). Grade Repetition. OECD Journal: Economic Studies, 1, 269–315. https://doi.org/10.1787/eco_studies-2013-5k3w65mx3hnx
Jackson, M. (2013). Determined to Succeed?: Performance versus Choice in Educational Attainment. California: Stanford University Press. https://doi.org/10.11126/stanford/9780804783026.003.0009
Julià, A. (2018). Las trayectorias educativas de hombres y mujeres jóvenes. Una aproximación desde el análisis de secuencias. Papers. Revista de Sociología, 9004(1), 5–28. https://doi.org/10.5565/rev/papers.2290
Keith, T. Z. (2015). Multiple regression and beyond: An introduction to multiple regression and structural equation modeling. New York: Routledge.
Krüger, N., Formichella, M. M., & Lekuona, A. (2015). Más allá de los logros cognitivos: La actitud hacia la escuela y sus determinantes en españa según pisa 2009. Revista de Educacion, (367), 10–35. https://doi.org/10.4438/1988-592X-RE-2015-367-281
LOCE. (2002). Ley Orgánica 10/2002, de 23 de diciembre, de calidad de la Educación. Boletín Oficial del Estado, 307, de 24 de diciembre, de 45188 a 45220. Recuperado de https://www.boe.es/eli/es/lo/2002/12/23/10
LOE. (2006). Ley Orgánica 2/2006, de 3 de mayo, de Educación. Boletín Oficial del Estado, 106, de 04 de Mayo, de 17158 a 17207. Recuperado de https://www.boe.es/eli/es/lo/2006/05/03/2
LOGSE. (1990). Ley Orgánica 1/1990, de 3 de octubre de 1990, de Ordenación General del Sistema Educativo. Boletín Oficial del Estado, 238, de 4 octubre, de 28927 a 28942. Recuperado de https://www.boe.es/eli/es/lo/1990/10/03/1
LOMCE. (2013). Ley Orgánica 8/2013, de 9 de diciembre, para la mejora de la calidad educativa. Boletín Oficial del Estado, 295, de 10 diciembre, de 97858 a 97921. Recuperado de https://www.boe.es/eli/es/lo/2013/12/09/8
LOMLOE. (2020). Ley Orgánica 3/2020, de 29 de diciembre, por la que se modifica la Ley Orgánica 2/2006, de 3 de mayo, de Educación. Boletín Oficial del Estado, 340, de 30 de diciembre, de 122868 a 122953. Recuperado de https://www.boe.es/eli/es/lo/2020/12/29/3
Lucas, S. R. (2001). Effectively Maintained Inequality: Education Transitions, Track Mobility, and Social Background Effects. American Journal of Sociology, 106(6), 1642–1690. https://doi.org/10.1086/321300
Mare, R. D. (1980). Social background and school continuation decisions. Journal of the American Statistical Association, 75(370), 295–305. https://doi.org/10.1080/01621459.1980.10477466
Martínez, J. S. (2007). Clase social, género y desigualdad de oportunidades educativas. Revista de Educación, (342), 287–306.
Méndez, I., & Cerezo, F. (2017). La repetición escolar en educación secundaria y factores de riesgo asociados. Educación XX1, 21(1), 41–62. https://doi.org/10.5944/educxx1.20172
Milesi, C. (2010). Do all roads lead to Rome? Effect of educational trajectories on educational transitions. Research in Social Stratification and Mobility, 28(1), 23–44. https://doi.org/10.1016/j.rssm.2009.12.002
Olmos, P., Mas, Ó., & Salvà, F. (2020). Perfiles de desconexión educativa: una aproximación multidimensional en la Formación Profesional Básica. Revista de Educación, 2020(389), 69–94. https://doi.org/10.4438/1988-592X-RE-2020-389-455
Pfeffer, F. T., & Goldrick-Rab, S. (2011). Unequal pathways through American Universities (No. Discussion Paper no. 1391-11). Recuperado de http://www.irp.wisc.edu/publications/dps/pdfs/dp139111.pdf
Serracant, P. (2015). The Impact of the Economic Crisis on Youth Trajectories: a Case Study from Southern Europe. YOUNG, 23(1), 39–58. https://doi.org/10.1177/1103308814557398
Sullivan, A. (2001). Cultural Capital and Educational Attainment. Sociology, 35(4), 893–912. https://doi.org/10.1177/0038038501035004006
Tarabini, A. (2016). La exclusión desde dentro: o la persistencia de los factores push en la explicación del Abandono Escolar Prematuro. Organización y Gestión Educativa. Revista Del Fórum Europeo de Administradores de La Educación, 3, 8–12.
Torrents, D. (2016). La autopercepción de las capacidades: origen social y elecciones educativas. Revista de la Asociación de Sociología de la Educación, 9(1), 78–93.
Triventi, M., Skopek, J., Kulic, N., Buchholz, S., & Blossfeld, H.-P. (2016). Varieties of secondary education models and social inequality: conclusions from a large-scale international comparison. In H. P. Blossfeld, S. Buchholz, J. Skopek, & M. Triventi (Eds.), Models of Secondary Education and Social Inequality. An International Comparison (pp. 377–400). Massachusetts | Glos: Edward Elgar Publishing.
Valdés, M. T. (2019). La construcción del itinerario formativo postobligatorio: Efectos de la atención al bajo rendimiento sobre la expectativa académica. Tendencias Sociales. Revista de Sociología, 3, 77–104. https://doi.org/10.5944/ts.3.2019.23589
Contact address: Maribel Garcia Gracia. Universidad Autónoma de Barcelona. Facultad de Ciencias Políticas y Sociología. Departamento de Sociología, Campus de Bellaterra. C.P. 08193. Bellaterra, Barcelona. E-mail: Maribel.Garcia@uab.cat
Appendices
1. Influence of sociodemographic variables and self-perception of grades on pathways (direct effects)
|
DIRECT EFFECTS |
||||
|
|
Estimate |
S.E. |
Est./S.E. |
P-Value |
|
Pathway 1. CFGM with predominance of repetition |
||||
|
Man > Pathway 1. CFGM with repetition |
Ref. |
|||
|
Woman > Pathway 1. CFGM with repetition |
-.08 |
.05 |
-1.79 |
.079 |
|
Immigrant origin > Pathway 1. CFGM with repetition |
Ref. |
|||
|
Native Spanish > Pathway 1. CFGM with repetition |
-.29 |
.05 |
-6.31 |
.00*** |
|
University level education > Pathway 1. CFGM with repetition |
Ref. |
|||
|
Compulsory education > Pathway 1. CFGM with repetition |
.30 |
.06 |
5.38 |
.00*** |
|
Est. post-compulsory > Pathway 1. CFGM with repetition |
.14 |
.06 |
2.19 |
.03* |
|
Self-percep. good grades > Pathway 1. CFGM with repetition |
-.23 |
.03 |
-8.88 |
.00*** |
|
Pathway 2. Linear academic |
||||
|
Man > Pathway 2. Linear academic |
Ref. |
|||
|
Woman > Pathway 2. Linear academic |
.11 |
.04 |
2.80 |
.005** |
|
Immigrant origin > Pathway 2. Linear academic |
Ref. |
|||
|
Native Spanish > Pathway 2. Linear academic |
.40 |
.056 |
7.13 |
.00*** |
|
University level education > Pathway 2. Linear academic |
Ref. |
|||
|
Compulsory education > Pathway 2. Linear academic |
-.48 |
.066 |
-7.38 |
.00*** |
|
Post-compulsory education > Pathway 2. Linear academic |
-.32 |
.058 |
-5.49 |
.00*** |
|
Self-percep. good grades > Pathway 2. Linear academic |
.38 |
.036 |
10.63 |
.00*** |
|
Pathway 3. Second chance with discontinuity |
||||
|
Man > Pathway 3. Second chance with discontinuities |
Ref. |
|||
|
Woman > Pathway 3. Second chance with discontinuities |
-.01 |
.05 |
-.28 |
.78 |
|
Immigrant origin > Pathway 3. Second chance with discontinuities |
Ref. |
|||
|
Native Spanish > Pathway 3. Second chance with discontinuities |
-.41 |
.05 |
-9.04 |
.00*** |
|
University level education > Pathway 3. Second chance with discontinuities |
Ref. |
|||
|
Compulsory education > Pathway 3. Second chance with discontinuities |
.26 |
.07 |
3.80 |
.00*** |
|
Post-compulsory education > Pathway 3. Second chance with discontinuities |
.10 |
.08 |
1.27 |
.20 |
|
Self-percep. good grades > Pathway 3. Second chance with discontinuities |
-.16 |
.02 |
-7.43 |
.00*** |
|
Pathway 4. Dropout after ESO |
||||
|
Man > Pathway 4. Dropout after ESO |
Ref. |
|||
|
Woman > Pathway 4. Dropout after ESO |
-.03 |
.05 |
-.73 |
.46 |
|
Immigrant origin > Pathway 4. Dropout after ESO |
Ref. |
|||
|
Native Spanish > Pathway 4. Dropout after ESO |
-.27 |
.05 |
-5.63 |
.00*** |
|
University level education > Pathway 4. Dropout after ESO |
Ref. |
|||
|
Compulsory education > Pathway 4. Dropout after ESO |
.18 |
.06 |
2.81 |
.005** |
|
Post-compulsory education > Pathway 4. Dropout after ESO |
.06 |
.07 |
.85 |
.395 |
|
Self-percep. good grades > Pathway 4. Dropout after ESO |
-.09 |
.02 |
-3.70 |
.00*** |
|
Pathway 5. CFGS with predominance of reorientation |
||||
|
Man > Pathway 5. CFGS with reorientation |
Ref. |
|||
|
Woman > Pathway 5. CFGS with reorientation |
-.01 |
.05 |
-.14 |
.89 |
|
Immigrant origin > Pathway 5. CFGS with reorientation |
Ref. |
|||
|
Native Spanish > Pathway 5. CFGS with reorientation |
.16 |
.06 |
2.84 |
.005** |
|
University level education > Pathway 5. CFGS with reorientation |
Ref. |
|||
|
Compulsory education > Pathway 5. CFGS with reorientation |
.19 |
.06 |
3.20 |
.001** |
|
Post-compulsory education > Pathway 5. CFGS with reorientation |
.27 |
.06 |
4.43 |
.00*** |
|
Self-percep. good grades > Pathway 5. CFGS with reorientation |
-.08 |
.03 |
-2.71 |
.007** |
|
Pathway 6. Academic with repetition |
||||
|
Man > Pathway 6. Academic with repetition |
Ref. |
|||
|
Woman > Pathway 6. Academic with repetition |
-.07 |
.05 |
-1.4 |
.16 |
|
Immigrant origin > Pathway 6. Academic with repetition |
Ref. |
|||
|
Native Spanish > Pathway 6. Academic with repetition |
.04 |
.05 |
.78 |
.43 |
|
University level education > Pathway 6. Academic with repetition |
Ref. |
|||
|
Compulsory education > Pathway 6. Academic with repetition |
-.07 |
.06 |
-1.27 |
.21 |
|
Est. post-compulsory > Pathway 6. Academic with repetition |
.004 |
.06 |
.06 |
.95 |
|
Self-percep. good grades > Pathway 6. Academic with repetition |
-.11 |
.03 |
-3.190 |
.001*** |
|
Self-perception of grades |
||||
|
Man > Self-percep. good grades |
Ref. |
|||
|
Woman > Self-percep. good grades |
.21 |
.05 |
4.42 |
.00*** |
|
Immigrant origin > Self-percep. good grades |
Ref. |
|||
|
Native Spanish > Self-percep. good grades |
.20 |
.05 |
3.67 |
.00*** |
|
University level education > Self-percep. good grades |
Ref. |
|||
|
Compulsory education > Self-percep. good grades |
-.42 |
.06 |
-7.49 |
.00*** |
|
Est. post-compulsory > Self-percep. good grades |
-.28 |
.06 |
-4.53 |
.00*** |
2. Influence of the sociodemographic variables and self-perception of grades on pathways (indirect effects)
|
INDIRECT EFFECTS |
||||
|
|
Estimat |
S.E. |
Est./S.E. |
P-Value |
|
Pathway 1. CFGM with predominance of repetition |
||||
|
Woman > Self-percep. good grades > Pathway 1. CFGM with repetition |
-.05 |
.01 |
-3.96 |
.00*** |
|
Native Spanish > Self-percep. good grades > Pathway 1. CFGM with repetition |
-.05 |
.01 |
-3.39 |
.001** |
|
Compulsory education > Self-percep. good grades > Pathway 1. CFGM with repetition |
.10 |
.02 |
5.73 |
.00*** |
|
Post-compulsory education > Self-percep. good grades > Pathway 1. CFGM with repetition |
.06 |
.02 |
4.04 |
.00*** |
|
Pathway 2. Linear academic |
||||
|
Woman > Self-percep. good grades > Pathway 2. Linear academic |
.08 |
.02 |
4.10 |
.00*** |
|
Native Spanish > Self-percep. good grades > Pathway 2. Linear academic |
.08 |
.02 |
3.45 |
.001** |
|
Compulsory education > Self-percep. good grades > Pathway 2. Linear academic |
-.16 |
.03 |
-6.09 |
.00*** |
|
Post-compulsory education > Self-percep. good grades > Pathway 2. Linear academic |
-.11 |
.03 |
-4.20 |
.00*** |
|
Pathway 3. Second chance with discontinuities |
||||
|
Woman > Self-percep. good grades > Pathway 3. Second chance with discontinuities |
-.04 |
.01 |
-3.80 |
.00*** |
|
Native Spanish >Self-percep. good grades>Pathway 3.Second chance with discontinuities |
-.03 |
.01 |
-3.29 |
.001** |
|
Compulsory education >Self-percep. good grades> Pathway3. Second chance with discontinuities |
.07 |
.01 |
5.23 |
.00*** |
|
Post-compulsory education > Self-percep. good grades > Pathway 3. Second chance with discontinuities |
.05 |
.01 |
3.85 |
.00*** |
|
Pathway 4. Dropout after ESO |
||||
|
Woman > Self-percep. good grades > Pathway 4. Dropout after ESO |
-.02 |
.01 |
-2.83 |
.005** |
|
Native Spanish > Self-percep. good grades > Pathway 4. Dropout after ESO |
-.02 |
.01 |
-2.62 |
.009** |
|
Compulsory education > Self-percep. good grades > Pathway 4. Dropout after ESO |
.04 |
.01 |
3.33 |
.001** |
|
Est. Post-compulsory > Self-percep. good grades >Pathway 4. Dropout after ESO |
.03 |
.01 |
2.86 |
.004** |
|
Pathway 5. CFGS with predominance of reorientation |
||||
|
Woman > Self-percep. good grades > Pathway 5. CFGS with reorientation |
-.02 |
.01 |
-2.32 |
.02** |
|
Native Spanish > Self-percep. good grades > Pathway 5. CFGS with reorientation |
-.02 |
.01 |
-2.20 |
.03** |
|
Compulsory education > Self-percep. good grades > Pathway 5. CFGS with reorientation |
.03 |
.01 |
2.54 |
.01** |
|
Post-compulsory education >Self-percep. good grades >Pathway 5. CFGS with reorientation |
.02 |
.01 |
2.32 |
.02** |
|
Pathway 6. Academic with repetition |
||||
|
Woman > Self-percep. good grades > Pathway 6. Academic with repetition |
-.021 |
.01 |
-2.58 |
.010** |
|
Native Spanish > Self-percep. good grades > Pathway 6. Academic with repetition |
-.020 |
.01 |
-2.37 |
.018** |
|
Compulsory education >Self-percep. good grades > Pathway 6. Academic with repetition |
.041 |
.014 |
2.93 |
.003** |
|
Post-compulsory education > Self-percep. good grades > Pathway 6. Academic with repetition |
.027 |
.010 |
2.60 |
.009** |
1 This article is part of the results of the project: “Educational choices and social inequalities in youth biographies: university access, vocational training pathways and educational dropout” (Reference CSO2016-79945-P), financed by the Ministry of Economy, Industry and Competitiveness. We would also like to thank the Evaluation Council of the Education System of Catalonia for their support, and the secondary schools that took part in the study for their collaboration.
2 This is a completed study co-directed by the professors Stephen Lamb (CIRES, University of Vitoria, Melbourne) and Eifred Markussen (NIFU, Oslo). More information in https://www.vu.edu.au/centre-for-international-research-on-education-systems-cires/our-research/international-comparisons-of-policy-practice y https://www.nifu.no/projects/international-study-of-city-youth-iscy.
3 The database of this study was delivered to the CIS and is currently in the process of being published in the ARCE repository. http://www.arces.cis.es/arces.jsp.
4 Maximum parental educational level.
5 Second chance opportunities are understood as the educational programmes directed at people who have not successfully completed obligatory secondary education, aimed at obtaining credentials, schooling certificates and professional skills acquisition.