Primary and secondary students’ views of learning personalisation: construction and validation of a scale1
Posicionamiento del alumnado de Educación Primaria y Secundaria ante la personalización del aprendizaje: construcción y validación de una escala
DOI: 10.4438/1988-592X-RE-2022-395-514
César Coll
Jaime Fauré
Universidad de Barcelona
Rubén Arriazu
Universidad de Extremadura
Abstract
In this work we present the formulation and psychometric validation of a scale for the exploration of primary and secondary students’ views of school learning personalisation strategies (EPAE-A from the Spanish Escala de Personalisación del Aprendizaje Escolar – Alumnado, School Learning Personalisation Scale – Students). The instrument was developed as part of a broader research project which analyses educational innovation involving personalisation. The starting point for the formulation process was to establish a typology of teaching practices and strategies which, according to the scientific literature, promote school learning that has personal meaning and significance for students. In order to construct the EPAE-A, two preliminary pilot studies were conducted, the first involving 507 students and the second 1,411 students. The process enabled us to reduce the initial set of items to a total of 34. These were grouped into two sub-scales: one of frequency (10 items) and the other of agreement (24 items). Factor analysis revealed a four-factor structure of the agreement sub-scale corresponding to four dimensions of learning personalisation: 1) learner’s control and decision-making regarding the learning process; 2) experiential and emotional basis; 3) connections between learning experiences; and 4) reflection upon oneself as a learner and upon the learning process itself. A unidimensional structure was identified for the frequency sub-scale, grouping items according to specific teacher and student actions related to learning personalisation strategies. In order to obtain evidence of the validity and reliability of the scale, the final version was applied to a sample of 4,909 students aged between 10 and 18 years from educational institutions located in Catalonia, Extremadura and Madrid, Spain. The results provide strong evidence of the internal structural validity and reliability of the scale.
Keywords: primary education, secondary education, student views scale, personalisation strategies, learning personalisation, validation of a scale.
Resumen
Este trabajo presenta el proceso de construcción y validación psicométrica de una escala para explorar los posicionamientos del alumnado de educación primaria y secundaria ante las estrategias de personalización del aprendizaje escolar (EPAE-A). El instrumento forma parte de una investigación más amplia dirigida al análisis de prácticas de innovación educativa basadas en la personalización del aprendizaje. El punto de partida de la construcción de la escala fue una tipología de actuaciones y estrategias pedagógicas que, de acuerdo con la revisión de la literatura, promueven la realización de aprendizajes escolares con sentido y valor personal para el alumnado. Para la validación de la EPAE-A se realizaron dos pruebas piloto preliminares, con 507 y 1411 estudiantes respectivamente, que permitieron reducir el número inicial de ítems a 34 agrupados en dos sub-escalas, una de frecuencia (10 ítems) y otra de acuerdo (24 ítems). El análisis factorial permitió, además, identificar una estructura de cuatro factores en la sub-escala de acuerdo que se relacionan con las siguientes dimensiones de la personalización del aprendizaje: 1) decisión y control del aprendiz sobre el proceso de aprendizaje; 2) base experiencial y vivencial; 3) conexión entre experiencias de aprendizaje; y 4) reflexión sobre uno mismo como aprendiz y sobre el propio proceso de aprendizaje. En la sub-escala de frecuencia, por su parte, se identificó una estructura unidimensional que agrupa ítems sobre acciones específicas de profesores y alumnos vinculadas a las estrategias de personalización del aprendizaje. Con el fin de obtener evidencias de la validez y fiabilidad de la escala construida se llevó a cabo una aplicación de la versión definitiva a una muestra de 4909 estudiantes con edades comprendidas entre los 10 y los 18 años de 12 centros educativos españoles situados en Catalunya, Extremadura y Madrid. Los resultados obtenidos muestran que la escala cuenta con evidencias sólidas de validez de estructura interna y fiabilidad.
Palabras clave: educación primaria; educación secundaria; escala de percepción del alumnado; estrategias de personalización; personalización del aprendizaje; validación de una escala.
Introduction
In this work we provide a description of the formulation, development and assessment of the psychometric properties of a scale with which to explore the views of primary and secondary students regarding a range of school learning personalisation practices and strategies (henceforth EPAE-A from the Spanish Escala de Personalisación del Aprendizaje Escolar – Alumnado, School Learning Personalisation Scale – Students). Students from 12 Spanish educational institutions located in Catalonia, Extremadura and Madrid, Spain, were involved in the process. In order to ensure the successful implementation of school learning personalisation practices and strategies, it is vital that the views of the students themselves be known.
Proposals seeking to promote the personalisation of school learning have proliferated over the course of the last twenty years. The initiative has involved national or state education authorities (ACARA, 2013; DfES, 2006; NETP, 2010), foundations, private corporations and other entities (e.g., Christensen Institute, Digital Promise, Education Elements, KnowledgeWorks, LEAP Innovations, Students at the Center), and supranational entities (OECD, 2006, 2017; UNESCO-IBE, 2017). At the heart of these initiatives lies the argument that, in order to confront the challenges presented by the modern economic, social, employment, technological and cultural reality of the Information Society, profound changes to the organisation and operation of education systems are needed (Marope, 2017a). Particular emphasis is put on the notion that learning should focus on and be tailored to the student.
However, there are markedly contrasting interpretations of what is meant by learning personalisation and how it can be achieved. Although an in-depth review of existing characterisations, definitions, and implementations of personalised learning is beyond the scope of the present work, a brief overview of those approaches to which we have referred will help to clarify the context in which the EPAE-A was developed.
Personalised learning has at times been compared with competency-based learning (Hammonds & Moyer, 2018; Levine & Patrick, 2019). The comparison is, in our view, inadequate, as it addresses only one element of personalisation, leaving aside others that are of equal importance and not strictly part of competency-based education. Such omissions include the identification and consideration of students’ interests and objectives, and the exploration and establishment of connections between learning experiences that occur inside and outside school (see the next section). In other words, learning personalisation practices and strategies are, in general, inclusive of but by no means limited to the principles of competency-based education (Jonnaert, 2019; Marope, 2017b; Perrenoud, 2000).
Another comparison often made with personalised learning is the use of digital information and communication technology (ICT) in its various forms: online learning, as an element of blended learning, or in support of classroom-based teaching and learning (Grant & Basye, 2014; Johnson et al., 2014). Arguments are diverse (e.g., Fitzgerald et al., 2017, 2018; Xie et al., 2019). We also consider that special mention should be made of comparisons between personalised learning and the use of learning analytics to tailor teaching to students’ learning processes, an approach which involves technology-assisted analysis of large datasets (Chrysafiadi et al., 2020; Kabassi & Alepis, 2020).
Again, we consider this comparison to be inappropriate. The possibilities of learning personalisation afforded to teachers and students by ICT are unparalleled. Implementation of certain personalisation practices and strategies would be highly challenging, if not impossible without appropriate ICT infrastructure. The majority of these tools can, with the support of ICT, be readily implemented and optimised. However, use of ICT is not in itself enough to personalise learning, even if we include Learning Analytics. In fact, there are numerous learning personalisation proposals, initiatives and experiences that make very limited use of ICT, and some avoid it completely without suffering any degree of disadvantage.
In an attempt to capture the specific nature of learning personalisation proposals, Bray and McClaskey (2013, 2015) propose that these be distinguished from the notions of differentiation and individualisation, focusing on the roles played by the student and the teacher. Although the idea of student-centred learning is common to all three approaches, in the cases of differentiation and individualisation, the learning process is led and directed by the teacher, who tailors instruction according to his or her perception of students’ needs and selects the resources that he or she deems most appropriate at the time. Only in the case of personalisation is there acknowledgement of and respect for students’ capacity to drive their own learning, encouragement to express their choices and interests, and progressive involvement as active co-designers and decision makers in the development and application of learning activities.
Personal significance and personalisation in learning
It is vital that we keep in mind what it is that we ultimately seek to achieve through learning personalisation, as well as the means of achieving it. The aim is for school learning to be relevant and to have personal meaning and significance for students. The means to this end are a set of practices and strategies which teachers adopt as they plan and conduct activities in conjunction with their students. Both aspects must be borne in mind and reflected in the dimensions and items of the scale and constitute the primary point of reference for its formulation.
Research conducted in the field of Learning Sciences offers a number of points concerning the types of situation that are conducive to achieving learning that is personally relevant, meaningful, and significant for the student. Reviews and summaries of these results (e.g., American Psychological Association, 2015; National Academies of Sciences, Engineering, and Medicine, 2018; OECD, 2017; Sawyer, 2014) reveal strong agreement regarding certain principles common to situations and activities that tend to yield relevant, profound, and personally meaningful and significant student learning. The results indicate that the likelihood of success is greater when: (i) what is learned and how it is learned draws on learners’ interests, objectives and choices; (ii) the capacity of learners to control and make decisions regarding their learning process is respected; (iii) learning contents and activities are linked to learners’ day-to-day affairs and to the culture of which they are a part; (iv) learning situations have an experiential and emotional component; (v) exercises and activities constitute “learning by doing” and involve the achievement of a final result or the creation of a product; (vi) connections are made between learning experiences obtained at different times and in different contexts; and (vii) learners are encouraged to reflect upon their own learning process and their approach to confronting and addressing learning situations and activities. Taken individually, each of these principles is insufficient to guarantee that learning situations or activities will result in learning charged with personal meaning and significance for the student. However, when considered together in the design of learning situations and activities, the likelihood of this occurring is substantially increased.
In general, works on the subject of learning personalisation tend to reflect some or all of these principles in the form of practices and strategies for the design and application of school teaching and learning activities. Certain principles are present in the majority of proposals, reflecting a fairly common view of learning personalisation. This is the case with regard to consideration of learners’ interests, objectives and choices, which tends to be manifested in strategies that seek to incorporate “the choice and the voice” of learners into the design and application of learning activities (e.g., Bray & McClaskey, 2015; Schmid & Petko, 2019; Underwood et al., 2009; Waldrip et al., 2014, 2016). The same is true of acknowledgement and acceptance of learners’ capacity to control and make decisions regarding some or all learning activity elements, often presented in terms of “pupil’s control” over their learning process (e.g., DeMink-Carthew & Netcoh, 2019; FitzGerald et al., 2018; Netcoh, 2017; Prain et al., 2013).
Other principles appear less frequently, however. This is the case with the notion of connecting learning experiences obtained at different times and in different contexts, which tends to be manifested in strategies that seek to identify student learning experiences in their various activity contexts and establish relationships between them (Holmes et al., 2018; Jones & McLean, 2018). The same is true of encouraging learners to reflect upon their own learning process and their approach to confronting and addressing learning activities (Olofson & Downes, 2018; Watson & Watson, 2017).
Finally, principles relating to “learning by doing” and to experiential and emotional components tend to be reflected indirectly in personalisation proposals involving so-called inquiry methodologies – learning based on projects, problems, cases, design, phenomena, etc. – or cooperative learning proposals with which they are often linked in didactic terms (Jones et al., 2013; Lee, 2014; Schmid & Petko, 2019).
This heterogeneity is also evident in the limited number of works that concern the validation and application of questionnaires to expose student views of learning personalisation. Underwood and Banyard (2008) used questionnaires to identify and compare managers’, teachers’ and learners’ views of personalised learning in England. The student questionnaire consists of 11 sub-scales designed to explore students’ perceptions of a wide variety of aspects ranging from computers to certain behaviours on the part of teachers.
Equally diverse are the numerous aspects covered by the 19 sub-scales of the Personalised Learning Questionnaire (PLQ) developed by Waldrip et al. (2014). The idea behind the PLQ is that personalised learning occurs when there is “a productive interplay between (a) teacher expertise in identifying and addressing students’ ongoing individual curricular needs and (b) student capacity to develop, over an extended time-frame, increasing independence as learners” (op. cit., p. 358).
The perspective adopted for the formulation and validation of the EPAE-A is significantly more focused than the two questionnaires mentioned above. Firstly, we have limited its scope to students’ views of teaching practices and strategies that are specifically oriented towards promoting and reinforcing personal meaning and significance in school learning. Secondly, we have selected practices and strategies that are referenced, with varying frequency, in the learning personalisation proposals and approaches identified as part of our review of relevant literature published in the last 15 years. Finally, they are practices and strategies which are directly reflected in the design and application of classroom teaching and learning activities and, as such, are easily detected and perceived by students.
With this in mind, we have opted not to include questions which, while doubtless relevant from an overall perspective of learning personalisation, are often difficult for students to detect and perceive. Similarly, we will not explore students’ views of methodologies, teaching proposals, or tools such as inquiry methodologies, cooperative learning, competency-based assessment, or use of ICT, which, notwithstanding their presence in school learning personalisation proposals and initiatives, are not exclusive to this context and may take different forms in other teaching scenarios.
Construction of the EPAE-A scale
The aim of the present work is to describe the process involved in the formulation and development of a Likert-type scale with which to explore primary and secondary students’ views of school learning personalisation and to provide psychometric evidence of its quality. It is part of a broader research project to analyse education innovation practices based on personalisation of learning in primary and secondary education centres in Catalonia, Extremadura and Madrid, Spain.
Initial design of the scale
Formulation of the scale began with a typology of teaching practices and strategies which, according to our review of the literature, promote learning that is personally meaningful and significant for the student. The categories of this typology defined the initial dimensions of the scale. The research team devised each category based on a series of statements relating to students’ views of: (a) the frequency with which a given personalisation practice or strategy is used in their place of learning (Frequency); (b) the importance that they ascribe to it (Agreement); (c) their inclination to participate in it (Preference); and (d) its impact on the learning process (Impact). The typology of practices and strategies is presented in Annexe I along with examples of statements relating to the four aspects explored.
The complete list of statements was subjected to an iterative process of review, discussion and reformulation in order to eliminate repetitions, improve composition, and ensure that all categories of the typology presented in Annexe I were covered, along with the four aspects of frequency, importance, preference, and impact. As part of this process, the statements were presented at two different points in time to students aged between 10 and 18 years in order to ensure ease of comprehension.
The first version of the scale consisted of 77 statements, 22 of which were frequency items and 55 were opinion items. Initial inclusion of a large number of items enabled us to select those with higher factor loadings and communalities in each dimension during the development process. This allowed us to reinforce evidence of the validity and reliability of the scale and ensure that the instrument would be of a reasonable and practical length. We then assigned five response categories to the statements. For the frequency items, these categories were: 1 = Never; 2 = Rarely; 3 = Sometimes; 4 = Frequently; and 5 = Always. For the opinion items, the categories were: 1 = Strongly disagree; 2 = Disagree; 3 = Neither agree nor disagree; 4 = Agree; and 5 = Strongly agree.
Development of the scale
Once the first version of the scale was complete, two consecutive pilot studies were organised in order to optimise it. The first pilot study enabled us to identify a conceptual structure of the dimensions of school learning personalisation that would be compatible with both our initial proposal – at least in part – and the responses that we received from participants. The second pilot study allowed us to test this structure. As a result of the two pilot studies, we were able to reduce considerably the number of items included in the scale.
First pilot study
The first pilot study involved 507 students from the education centres involved in the Aprender con Sentido research project. The scale was applied on a group basis and in a classroom context using the e-encuesta online platform. Direct supervision was provided at all times by the teacher in charge. At the beginning of each session, a member of the research team explained the purpose of the scale and provided instructions for responding to it. The researcher remained in attendance throughout the whole session, answering questions and resolving students’ queries.
We conducted a series of tests to assess the suitability of the data for factor analysis (KMO = 0.87955; Bartlett’s test for sphericity, χ2 = 3053.0, df = 276, p = 0.01). We then divided the sample (N = 507) into three independent sub-samples (N1 = 169; N2 = 169; N3 = 169). We began by using the data from the first sub-sample of participants (N1 = 169) to test the goodness of fit between our initial proposal of a typology of school learning personalisation practices and strategies (see Annexe 1) and the responses obtained from application of the questionnaire. To do so, we conducted a confirmatory factor analysis (CFA; Batista-Foguet et al., 2004) using the unweighted least squares estimation method (Manzano & Zamora, 2009). We then assessed the results according to the goodness of fit criteria presented in Table I.
TABLE I. Goodness of fit criteria2
|
Index |
Hypothesis |
|
Chi-Square (χ2) |
p > 0.05 |
|
Comparative Fit Index (CFI) |
CFI ≥ 0.95 |
|
Tucker-Lewis Index (TLI) |
TLI ≥ 0.95 |
|
Standardized Root Mean Squared Residual (SRMR) |
SRMR < 0.05 |
|
Root Mean Square Error of Approximation (RMSEA) |
RMSEA < 0.08 |
The results of the CFA showed a clear lack of fit between the data obtained from the application of the scale and the model proposed initially (χ2 = 3452.45, p < 0.01; CFI = 0.610; TLI = 565; SRMR = 0.112). In light of this, we began a search for an alternative theoretical model that would fit the participants’ responses.
To do so, we conducted two procedures using the data obtained from the second sub-sample of participants (N2 = 169). We began by conducting a parallel analysis (Timmerman & Lorenzo-Seva, 2011) in the context of an exploratory factor analysis (Bandalos & Finney, 2018), which suggested a nested factor structure. In fact, the distribution of the factor loadings and communalities convinced us of a clear division of the scale into two sub-scales: one that encompassed all of the items relating to importance, preference, and impact, which we designated the agreement sub-scale; and another that encompassed all of the frequency-related items, which we designated the frequency sub-scale.
We then conducted a series of exploratory factor analyses. For this, we decided to calculate polychoric correlation matrices using the unweighted least squares estimation method, applying a Promin rotation (Howard, 2016). The exploratory factor analyses enabled us to eliminate from the scale those items which either: (a) presented lower than expected factor loadings and communalities; or (b) loaded on a theoretically incompatible dimension (Izquierdo et al., 2014).
Once the two procedures were complete, we were left with a scale of 37 items organised into two sub-scales. More specifically, we obtained a frequency sub-scale of 10 items organised into a single dimension, and an agreement sub-scale of 27 items organised into four dimensions.
In order to confirm this factor structure, we conducted another CFA with the data from the third sub-sample of participants (N3 = 169). In general, we found evidence of the suitability of a theoretical model with one dimension within a sub-scale of frequency (χ2 = 495.828, p < 0.01; CFI = 0.960; TLI = 933; SRMR = 0.048) and four dimensions within a sub-scale of agreement (χ2 = 2479.93, p < 0.01; CFI = 0.968; TLI = 958; SRMR = 0.051).
Following an assessment of the items grouped in each sub-scale, we decided to name the five dimensions as follows: (a) frequency; (b) control and decision-making regarding the learning process; (c) experiential and emotional basis; (d) connections between learning experiences; and (e) reflection upon oneself as a learner and upon the learning process itself.
Second pilot study
Given the relatively small size of the sample used in the first pilot study, we decided to conduct a second. The aim of this second study was to test the factor structure obtained previously with a larger sample of 1,411 students from primary and secondary education centres involved in the PERSONAE research project. As in the first pilot study, the scale was applied on a group basis and in a classroom context, this time using the Qualtrics online platform. Direct supervision was provided at all times by the teacher in charge and, as before, a member of the research team was present throughout.
This time, CFA was conducted for both sub-scales. Initially, the theoretical model fit the data less well than in the first pilot study. However, after several iterations during which certain items were eliminated, we were able to substantially improve the fit indicators for both the frequency sub-scale (χ2 = 1423.2, p < 0.01; CFI = 0.995; TLI = 0.990; SRMR = 0.017; RMSEA = 0.029) and the agreement sub-scale (χ2 = 203.33, p > 0.01; CFI = 0.965; TLI = 0.831; SRMR = 0.032; RMSEA = 0.065). Specifically, we eliminated three items from the latter.
In summary, the second pilot study provided us with evidence of a factor structure of two sub-scales, one with one dimension and the other with four dimensions. We were also able to reduce the size of the agreement sub-scale to produce a final version of the scale with a total of 34 items. This completed the development stage of the EPAE-A. Key data covering the entire development process are presented in Table II.
TABLE II. Development of the scale
|
EPAE-A (from the Spanish Escala de Personalisación |
Initial formulation |
First pilot study |
Second pilot study |
|
|
Student participants (N) |
--- |
507 |
1411 |
|
|
Frequency sub-scale |
Number of items |
22 |
10 |
10 |
|
Theoretical dimensions/Factors |
8 |
1 |
1 |
|
|
Cronbach’s alpha |
- |
0.906 |
0.895 |
|
|
McDonald’s omega |
- |
0.907 |
0.916 |
|
|
Agreement sub-scale |
Number of items |
55 |
27 |
24 |
|
Theoretical dimensions/Factors |
8 |
4 |
4 |
|
|
Cronbach’s alpha |
- |
0.866 |
0.854 |
|
|
McDonald’s omega |
- |
0.852 |
0.897 |
|
Note: During the initial formulation of the scale, statistical tests were not conducted.
Psychometric properties of the EPAE-A scale
Participants
In order to determine the validity and reliability of the scale, the final version was applied to a sample of 4,909 students from primary and secondary education centres involved in the PERSONAE research project. Of these, 2,543 (51.8%) identified themselves as male, 2,327 (47.4%) identified themselves as female, and 39 (0.8%) did not declare their identification with either gender. Primary students (1,296) accounted for 26.4% of the total, lower secondary students (3,000) for 61.1%, and bachillerato (upper secondary) students (613) for 12.5%. Average age was 13.3 years (SD = 2.23). A search for differences between groups revealed no substantial variance in any of the models. The platform and application conditions were the same as those used for the second pilot study.
Analysis
We explored two psychometric properties agreed by various researchers to be of particular relevance to the assessment of the quality of a scale (Aiken, 2003; Carmines & Zeller, 1988; Prieto & Delgado, 2010). We began by exploring the validity of the scale. Validity is the degree to which evidence concerning the use of a scale supports the desired interpretation of its results for the purposes of a given objective (American Educational Research Association, American Psychological Association & National Council on Measurement in Education, 1999). In our case, we focused on evidence of construct validity (Kane, 2012). This type of evidence enables us to verify the degree of fit between the test participants’ scores and the theoretical factor structure predicted by the developers of the scale (Kane, 2016). With a view to assessing the degree of construct validity of our scale, we conducted CFA on the data (Batista-Foguet et al., 2004). As with the formulation and development phases, we used the unweighted least squares estimation method (Manzano & Zamora, 2009) to contrast the results with the goodness of fit criteria presented in Table I.
We then explored the reliability of the scale. Reliability is the consistency or stability of the results obtained from multiple repetitions of a measurement process (Cohen et al., 1996). From a practical point of view, the degree of reliability of a scale is established by calculating a coefficient of internal consistency, such as Cronbach’s alpha coefficient, which is currently one of the most widely used methods of assessing the reliability of questionnaires (Zumbo & Rupp, 2004). However, Cronbach’s alpha can pose issues with ordinal response categories, as is the case with our scale. For this reason, we included an additional indicator that seems more appropriate to our circumstances: McDonald’s omega coefficient (McDonald, 1999). A summary of the statistical criteria recommended by the specialised literature (e.g., Elosúa & Zumbo, 2008) and which we used to assess the indicators of internal consistency are presented in Table III.
TABLE III. Assessment criteria for indicators of internal consistency
|
Indicator |
Acceptable values |
|
Cronbach’s alpha |
0.75 < α < 0.95 |
|
McDonald’s omega |
0.85 < ɷ |
All of the data analysis was conducted using the Stata v.16 software package.
Results
Before conducting the psychometric tests, we made a preliminary exploration of the data. We found neither atypical nor lost data, but we did find non-linear distributions in several items. We therefore applied the Satorra-Bentler correction for non-normal data to all subsequent analyses (Asparouhov & Muthén, 2010).
We then assessed the appropriateness of using CFA on the data matrix. Both the Kaiser-Meyer-Olkin (KMO) test (KMO = 0.886) and Bartlett’s test of sphericity (χ2 = 3015.2, df = 190, p < 0.01) suggested the suitability of the data.
From the results we can conclude that, in general terms, there is strong evidence of the internal structural validity and reliability of our scale. In terms of evidence of internal structural validity, the analyses produced positive results for both sub-scales (see Table IV). On the agreement sub-scale, participant scores were grouped according to the proposed four-dimensional theoretical structure (χ2 = 247.76, p > 0.01; CFI = 0.971; TLI = 0.945; SRMR = 0.031; RMSEA = 0.037). On the frequency sub-scale, participant scores were grouped according to the proposed unidimensional structure (χ2 = 553.05, p > 0.01; CFI = 0.981; TLI = 0.990; SRMR = 0.020; RMSEA = 0.06). These results are consistent with the preliminary results obtained during the formulation and development phases.
TABLE IV. Fit indices of the factor structure proposed for each sub-scale
|
Test |
Criteria |
Frequency sub-scale |
Agreement sub-scale |
|
Chi-Square (χ2) |
p > 0.05 |
0.177 |
0.257 |
|
Comparative Fit Index (CFI) |
CFI ≥ 0.95 |
0.981 |
0.971 |
|
Tucker-Lewis Index (TLI) |
TLI ≥ 0.95 |
0.990 |
0.945 |
|
Standardized Root Mean Squared Residual (SRMR) |
SRMR < 0.05 |
0.02 |
0.031 |
|
Root Mean Square Error of Approximation (RMSEA) |
RMSEA < 0.08 |
0.06 |
0.037 |
Once the fit indices had been determined, we calculated the internal consistency indices for each sub-scale (see Table V). As shown, the values of these indices were acceptable. However, it should be noted that the values for the agreement sub-scale are somewhat lower (α = 0.861; ω = 0.872) than those for the frequency sub-scale (α = 0.874; ω = 0.894).
TABLE V. Internal consistency indices for each sub-scale
|
Test |
Criteria |
Frequency sub-scale |
Agreement sub-scale |
|
Cronbach’s alpha |
α ≥ 0.85 |
0.874 |
0.861 |
|
McDonald’s omega |
ω ≥ 0.85 |
0.894 |
0.872 |
In short, we found strong evidence of the internal structural validity and reliability of the EPAE-A and this is summarised in Figure I.
FIGURE I. Evidence of EPAE-A validity and reliability
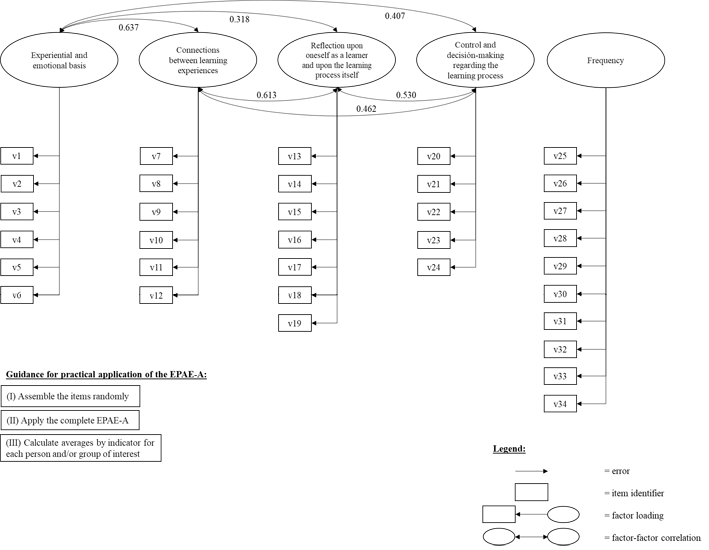
Note: The items (vn) can be found in full in Annexe II.
Application and assessment of the scale
The scale can be administered by any teacher who requires information concerning their students’ opinions of school learning personalisation strategies. In order to analyse the data obtained, we recommend the use of the averages obtained for each person or group in each of the factors. In other words, the EPAE-A is designed to calculate not a global indicator but five different indicators, one for each of the factors.
Discussion
The EPAE-A complies with quality and validation standards and is in line with the sequential statistical analysis procedures designed for the exploration of relationships between variables using factors (Boateng et al., 2018). Formulation and optimisation of the scale involved two successive pilot studies (N = 507; N = 1,411). Our validation of the scale using a large number of responses (N = 4,909) reflects the strength of the instrument for gauging students’ views of the practices and strategies adopted by teachers in order to personalise school learning. It is worth mentioning that the sample used to establish the validity and reliability of the EPAE-A was considerably larger than those generally used for the formulation and validation of this type of scale (e.g., Underwood & Banyard, 2014; Waldrip et al., 2014).
The items belonging to the eight categories of teacher practices and strategies upon which we initially based the scale were eventually grouped into four factors as a result of the psychometric analyses. Although the number of items (see Annexes I and II) has been reduced, it is clear that the final scale accounts for all of the principal dimensions of learning personalisation proposals and initiatives. The grouping of the items into factors corresponds, for the most part, with the initial practice and strategy categories.
Two sets of items were not grouped as factors in their own right, but instead were distributed across the four factors that resulted from the factor analysis. These are the items from the initial categories concerning consideration of students’ interests and objectives and incorporation or utilisation of resources and learning opportunities that are available within community surroundings and the activity contexts to which students have access outside school. The importance of this lies in the fact that, as mentioned in the introduction, both types of practice, especially those concerning the consideration of students’ interests and objectives, are present in a generalised manner within the proposals and initiatives aimed at learning personalisation. Far from casting doubt on their importance, we believe that this result reinforces the centrality of considering students’ interests and objectives in the personalisation of learning, and of linking them with other practices and strategies. To work based on and in accordance with students’ interests is closely related with acknowledgement and acceptance of their capacity to drive their own learning process, with identification and interconnection of their learning experiences both in and outside school, and with individual and collective reflection on the origin and scope of these interests. As such, it is reasonable to interpret the fact that the items relating to interests are distributed across the four factors as a reflection of the centrality of these interests in approaches to learning personalisation.
Let us now address the unidimensional structure of the frequency sub-scale. Although this result is contrary to our expectations of a factor structure similar to that of the agreement sub-scale, it does coincide with a contribution from the work of Underwood & Banyard (2008) who, when comparing students’ and teachers’ views of personalised learning, conclude that students “tended to strongly see personalisation as individualisation” and to ask themselves what degree of freedom and initiative they have (p 245). This tendency may equally contribute to the unidimensional structure of the frequency sub-scale in that the majority of its constituent items involve, in one way or another and with greater or lesser degrees of clarity in each case, a reference to the degree of initiative and freedom available to the student.
In sum, based on our results we are able to assert that there is strong evidence of the validity and reliability of the EPAE-A for use in education centres in Spain. However, the work we have conducted leaves a number of open questions, two of which we feel merit particular attention. The first concerns the age group for which the scale is intended – namely students aged between 10 and 18 years – and the composition of the sample of 4,909 students used for the final validation. Our sample presents two possibilities. On one hand, given the breadth of the age interval and the differences between the three levels of education within the Spanish education system, we believe that it would make sense to explore a potential division of the EPAE-A into three versions – primary education, lower secondary education, and bachillerato or upper secondary education. On the other, we consider that a re-validation of the scale using a student sample that is more evenly distributed across the three age groups would serve to bolster evidence of the scale’s validity and reliability, especially if the sample size were similar to that used in the present study.
The second open question that we think should be highlighted concerns the specific context of the Spanish education system for which the scale was developed and in which it was validated. The views of students – and, of course, of teachers – regarding personalised learning practices and strategies are undeniably influenced by the pedagogical culture and traditions of Spain’s education system and the institutions that have received and moulded them as students. As such, it would be interesting to test whether the factor structure of the EPAE-A holds true with samples of students from education systems and institutions with different pedagogical cultures and traditions.
References
Aiken, L. R. (2003). Tests psicológicos y evaluación. Pearson Educación.
American Psychological Association (2015). Top 20 principles from psychology for preK-12 teaching and learning. http://www.apa.org/ed/schools/teaching-learning/top-twenty-principles.pdf]
American Educational Research Association [AERA], American Psychological Association [APA] & National Council on Measurement in Education [NCME]. (1999). Standards for Educational and Psychological Testing. American Psychological Association.
Asparouhov, T., & Muthén, B. (2010). Computing the strictly positive Satorra-Bentler chi-square test in Mplus. Mplus Web Notes, 1-12.
Australian Curriculum, Assessment and Reporting Authority (ACARA) (2013). Student Diversity and the Australian Curriculum. Advice for principals, schools and teachers. Sydney: ACARA. https://docplayer.net/5749166-Student-diversity-and-the-australian-curriculum.html.
Bandalos, D. L., & Finney, S. J. (2018). Factor analysis: Exploratory and confirmatory. In The reviewer’s guide to quantitative methods in the social sciences (pp. 98-122). Routledge.
Batista-Foguet, J. M., Coenders, G., & Alonso, J. (2004). Análisis factorial confirmatorio. Su utilidad en la validación de cuestionarios relacionados con la salud. Medicina clínica, 122(1), 21-27.
Boateng, G.O., Neilands, T.B., Frongillo, E.A., Melgar-Quiñonez, H.R. & Sera L. Young, S.L. (2018). Best Practices for Developing and Validating Scales for Health, Social, and Behavioral Research: A Primer. Frontiers in Public Health, 6(149), 1-18. https://doi.org/10.3389/fpubh.2018.00149
Bray, B., & McClaskey, K. (2013). A step-by-step guide to personalize learning. Learning & Leading with Technology, 40(7), 12–19.
Bray, B., & McClaskey, K. (2015). Make learning personal: The what, who, WOW, where, and why. Corwin Press.
Carmines, E.G. & Zeller, R.A. (1988). Reliability and Validity Assessment. Sage.
Cohen, R. J., Swerdlik, M. E., & Phillips, S. M. (1996). Psychological testing and assessment: An introduction to tests and measurement. Mayfield Publishing Co.
Chrysafiadi, K., Virvou, M. & Sakkopoulos, E. (2020). Optimizing Programming Language Learning Through Student Modeling in an Adaptive Web-Based Educational Environment. In M. Virvou, E. Alepis, G.A. Tsihrintzis & L.C. (Eds.), Machine Learning Paradigms. Advances in Learning Analytics (pp. 205-223). Springer.
DeMink-Carthew, J. & Netcoh, S. (2019) Mixed Feelings about Choice: Exploring Variation in Middle School Student Experiences with Making Choices in a Personalized Learning Project. RMLE Online, 42(10), 1-20. https://doi.org/10.1080/19404476.2019.1693480.
Department for Education and Skills (DfES). (2004) A national conversation about personalised learning. DfES. https://www.education.gov.uk/publications/eOrderingDownload/DfES%200919%20200MIG186.pdf.
Elosúa Oliden, P., & Zumbo, B. D. (2008). Coeficientes de fiabilidad para escalas de respuesta categórica ordenada. Psicothema, 20(4), 896-901.
FitzGerald, E., Jones, A., Kucirkova, N. & Scanlon, E. (2018). A literature synthesis of personalised technology-enhanced learning: what works and why. Research in Learning Technology, 26: 2095, 1-16. http://dx.doi.org/10.25304/rlt.v26.2095
Grant, P. & Basye, D. (2014). Personalised Learning. A Guide for Engaging Students with Technology. International Society for Technology in Education -ISTE.
Hammonds, V. & Moyer, J. (2018). From Vision to Reality. Personalized, Competency-Based Education for All Kids. https://knowledgeworks.org/resources/vision-reality-personalized-cbe/.
Holmes, W., Anastopoulou, S., Schaumburg, H. and Mavrikis, M. (2018). Technology-enhanced Personalised Learning: Untangling the Evidence. Open Research Online. The Open University. http://www.studie-personalisiertes-lernen.de/en/.
Howard, M. C. (2016). A review of exploratory factor analysis decisions and overview of current practices: What we are doing and how can we improve?. International Journal of Human-Computer Interaction, 32(1), 51-62. https://doi.org/10.1080/10447318.2015.1087664
Izquierdo, I., Olea, J., & Abad, F. J. (2014). El análisis factorial exploratorio en estudios de validación: usos y recomendaciones. Psicothema, 26(3), 395-400. https://doi.org/10.7334/psicothema2013.349
Johnson, L., Adams Becker, S., Estrada V., Freeman, A., Kampylis, P., Vuorikari, R. & Punie, Y. (2014). NMC Horizon Report Europe - 2014 Schools Edition. The New Media Consortium. http://publications.europa.eu/resource/cellar/1eda751c-a440-4b5e-8b53-04243d3ff8b3.0001.02/DOC_1
Jonnaert, Ph. (2019). Action située – Agir compétent. BACSE International. Paper online: http://bacseinternational.com.
Jones, M. & McLean, K. (2018). Chapter 2. Personalising Learning: An Overview. In M. Jones & K, McLean, Personalising Learning in Teacher Education (pp. 9-23). Springer Nature Singapore Pte Ltd. https://doi.org/10.1007/978-981-10-7930-6
Jones, A., Scanlon, E., Gaved, M., Blake, C., Collins, T., Clough, G., Kerawalla, L., Littleton, K., Mulholland, P., Petrou, M. & Twiner, A. (2013). Challenges in personalisation: supporting mobile science inquiry learning across contexts. Research and Practice in Technology Enhanced Learning, 8(1), 21–42.
Kane, M. (2012). All validity is construct validity. Or is it?. Measurement: Interdisciplinary Research & Perspective, 10(1-2), 66-70. https://doi.org/10.1080/15366367.2012.681977.
Kane, M. T. (2016). Explicating validity. Assessment in Education: Principles, Policy & Practice, 23(2), 198-211.
Kabassi, K. & Alepis, E. (2020). Learning Analytics in Distance and Mobile Learning for Designing Personalised Software. In M. Virvou, E. Alepis, G.A. Tsihrintzis & L.C. (Eds.), Machine Learning Paradigms. Advances in Learning Analytics (pp. 185-203). Springer.
Kenny, D. A., Kaniskan, B., & McCoach, D. B. (2015). The performance of RMSEA in models with small degrees of freedom. Sociological Methods & Research, 44(3), 486-507. https://doi.org/10.1177/0049124114543236.
Lee, D. (2014). How to Personalize Learning in K-12 Schools: Five Essential Design Features. Educational Technology, 54(3),12-17.
Levine, E. & Patrick, S. (2019). What is Competency-Based Education. An updated definition. Aurora Institute. https://aurora-institute.org/resource/what-is-competency-based-education-an-updated-definition/
Manzano, P. A. & Zamora M., Salvador (2009). Sistema de Ecuaciones Estructurales: Una Herramienta de Investigación. Cuaderno Técnico 4. Centro Nacional de Evaluación para la Educación Superior, A.C. https://docplayer.es/42086072-Sistema-de-ecuaciones-estructurales-una-herramienta-de-investigacion.html
Marope, M. (2017a). Reconceptualizing and Repositioning Curriculum in the 21st Century. A Global Paradigm Shift. IBE-UNESCO. http://bit.ly/2wIkJm5
Marope, M. (2017b). Future Competences and the Future of Curriculum. A global reference for Curricula Transformation. IBE-UNESCO. http://www.ibe.unesco.org/es/news/document-future-competences-and-future-curriculum
McDonald, R. P. (1999). Test theory: A unified treatment. Lawrence Erlbaum Associates.
National Academies of Sciences, Engineering, and Medicine. (2018). How People Learn II: Learners, Contexts, and Cultures. The National Academies Press. https://doi.org/10.17226/24783
Netcoh, S. (2017). Students’ Experiences with Personalized Learning: An Examination Using Self-Determination Theory. University of Vermont. Graduate College Dissertations and Theses. https://scholarworks.uvm.edu/graddis/738
Organisation for Economic Co-operation and Development (OECD) (2006). Schooling for Tomorrow: Personalising Education. OECD Publishing.
Organisation for Economic Co-operation and Development (OECD) (2017). The principles of learning to design learning environments. In The OECD Handbook for Innovative Learning Environments (chapter 1, pp. 21-40). OECD Publishing.
Olofson, M.W. & Downes, J. (2018). An Instrument to Measure Teacher Practices to Support Personalized Learning in the Middle Grades. RMLE Online, 41(7), 1-21, https://doi.org/10.1080/19404476.2018.1493858
Perrenoud, Ph. (2000). L’école saisie par les compétences. In Ch. Bosman, F.-M. Gerard & X. Roegiers (Eds.), Quel avenir pour les compétences? (pp. 21-41). De Boeck & Larcier.
Prain, V., Cox, P., Deed, C., Dorman, J., Edwards, D., Farrelly, C., Keeffe, M., Lovejoy, V., Mow, L., Sellings, P., Waldrip, B. & Yager, Z. (2013). Personalised learning: lessons to be learnt. British Educational Research Journal, 39(4), 654–676. http://dx.doi.org/10.1080/01411926.2012.669747
Prieto, G., & Delgado, A. R. (2010). Fiabilidad y validez. Papeles del psicólogo, 31(1), 67-74.
Sawyer, R.K. (2014). Introduction: The New Science of Learning. In R. K. Sawyer (Ed.), The Cambridge Handbook of Learning Sciences. Second Edition (pp. 1-18). Cambridge University Press.
Schmid, R. & Petko, D. (2019). Does the use of educational technology in personalized learning environments correlate with self-reported digital skills and beliefs of secondary-school students? Computers & Education, 136, 75–86. https://doi.org/10.1016/j.compedu.2019.03.006
Timmerman, M. E., & Lorenzo-Seva, U. (2011). Dimensionality Assessment of Ordered Polytomous Items with Parallel Analysis. Psychological Methods, 16, 209-220. https://doi.org/10.1037/a0023353
Underwood, J., Baguely, Th., Banyard, Ph., Dillon, G., Farrington-Flint, L., Hayes, M., Hick, P., LeGeyt, G., Murphy, J., Selwood, I. & Wright, M. (2009). Personalising Learning. BECTA. https://webarchive.nationalarchives.gov.uk/20110107182133/http://research.becta.org.uk/index.php?section=rh&&catcode=_re_rp_02&rid=14546
Underwood, J. & Banyard, Ph. (2008). Managers’, teachers’ and learners’ perceptions of personalised learning: evidence from Impact 2007. Technology, Pedagogy and Education, 17(3), 233-246. https://doi.org/10.1080/14759390802383850
UNESCO-IBE (2017). Training Tools for Curriculum Development: Personalized Learning. IBE-UNESCO.
US Department of Education (2010). Transforming American Education. Learning Powered by Technology. National Education Technology Plan 2010. Department of Education. Education Publications Center. https://bit.ly/3arpHCO
Waldrip, B., Cox, P., Deed, C., Dorman, J., Edwards, D., Farrelly, C., et al. (2014). Student perceptions of personalised learning: Validation and development of questionnaire with regional secondary students. Learning Environments Research, 17(3), 355–370. https://doi.org/10.1007/s10984-014-9163-0
Waldrip, B., Yu, J.J. & Prain, V. (2016). Validation of a model of personalized learning. Learning Environments Research, 19, 169-180. https://doi.org/10.1007/s10984-016-9204-y
Watson, W., & Watson, S. L. (2017). Principles for personalized instruction. In C. Reigeluth, B. J. Beatty, & R. D. Myers (Eds.). Instructional-design theories and models, volume IV: The learner-centered paradigm of education (pp. 87–108). Routledge.
Zumbo, B. D., & Rupp, A. A. (2004). Responsible modeling of measurement data for appropriate inferences. SAGE.
Contact address: César Coll. Universidad de Barcelona, Facultad de Psicología, Departamento de Cognición, Desarrollo y Psicología de la Educación. Pg. de la Vall d’Hebron, 171, 08035 Barcelona. E-mail: ccoll@ub.edu
1 This work is part of a research project financed by the Spanish Ministry of Economy, Industry and Competitiveness (PERSONAE –El desafío de la personalización del aprendizaje escolar: principios, posicionamientos e implementación en los centros educativos [PERSONAE – The challenge of school learning personalisation: principles, views and implementation in education centres]. Reference: EDU2013-40965-R). Further information about this project and the research group is available at https://ble.psyed.edu.es/proyectos-actuales/proyecto-personae/
2 Note: The root mean square error of approximation (RMSEA) is reported in all cases, with the exception of those with a small sample size, as suggested by Kenny, Kaniskan and McCoach (2015).