The lack of influence of class size on students’ academic performance: empirical evidence for Andalusia1
La falta de influencia del tamaño de la clase sobre el rendimiento académico de los estudiantes: evidencia empírica para Andalucía
DOI: 10.4438/1988-592X-RE-2022-395-516
Luis Alejandro López-Agudo
Oscar David Marcenaro-Gutiérrez
Universidad de Málaga
Abstract
Class size has been and continues to be a focus of the Spanish education debate. Most of the literature points towards the negative influence that overcrowded classes may have on students’ academic performance, which has increased the belief that a reduced class size may be better for students’ learning. However, the endogeneity that class size presents has prevented a great part of the research works – which are mostly correlational – to grasp its actual influence. Because of that, we intend to solve this issue by the use of a fuzzy regression discontinuity approach (a combination of regression discontinuity and instrumental variables) using as instrument the class size which schools should have set if they had followed the education legislation. This issue has been analysed for the most populated Spanish region, i.e. Andalusia, using census data for primary and secondary education students, provided by the Andalusian Agency of Education Assessment (AGAEVE) for the academic years 2011/12 and 2012/13. Our results show that class size does not influence students’ administrative scores (in mathematics and reading) in primary and secondary education and that the characteristics of the students in the class may be more important.
Keywords: class size, academic performance, fuzzy regression discontinuity, instrumental variables, primary education, secondary education.
Resumen
El tamaño de la clase ha estado y continúa siendo un foco del debate educativo en España. La mayoría de la literatura indica que existe una influencia negativa de las clases sobrepobladas sobre el rendimiento académico de los estudiantes, lo que ha aumentado la creencia de que un tamaño de clase reducido favorecería el aprendizaje del alumnado. Sin embargo, la endogeneidad que presenta el tamaño de clase ha evitado que gran parte de los estudios –la mayoría correlacionales– obtengan su influencia real. En consecuencia, pretendemos resolver este problema mediante el uso de un procedimiento de regresión discontinua difusa (una combinación de regresión discontinua y variables instrumentales) usando como instrumento el tamaño de clase que los colegios deberían haber fijado si hubieran seguido la legislación educativa. Esta cuestión se ha estudiado para la región más poblada de España, esto es, Andalucía, usando datos censales para estudiantes de educación primaria y secundaria, proporcionados por la Agencia Andaluza de Evaluación Educativa (AGAEVE) para los cursos académicos 2011/12 y 2012/13. Nuestros resultados muestran que el tamaño de clase no influye en los resultados académicos administrativos (en lectura y matemáticas) de los estudiantes de primaria y secundaria y que las características de los estudiantes que componen la clase serían más importantes.
Palabras clave: tamaño de clase, rendimiento académico, regresión discontinua difusa, variables instrumentales, educación primaria, educación secundaria.
1. Introduction
There is a worldwide debate on the influence that class size may have on students’ academic performance. Most of this literature seems to indicate that a reduction in class size is positive for students’ academic outcomes (Argaw & Puhani, 2018; Bowne, Magnuson, Schindler, Duncan, & Yoshikawa, 2017; Dolton & Marcenaro-Gutierrez, 2011; Goldstein, Yang, Omar, Turner, & Thompson, 2000; Hanushek, 2002; Krueger, 2003; Shin & Young, 2009; Uttl, Bell, & Banks, 2018, among others). In spite of the relevance of this issue, it has been scarcely studied for Spain and, among these few examples, only correlational evidence exists (as e.g. in Anghel & Cabrales, 2014). Nevertheless, in spite of the lack of a solid empirical body of research on the impact of class size for Spain, some education policies have been implemented to change this limit. Particularly, for primary and secondary education, until the academic year 2011/12 the class size was fixed at 25 and 30 students (respectively) but, in the next academic year, it was increased by 20%, and reduced again to 25 and 30 students in 2016.
In this context of “arbitrary” changes in class size, the Spanish press has alerted about the problems of overcrowded classes in terms of students’ learning, which may increase disruption and teacher time doing tasks such as marking homework or exams, also reducing the learning time that students have2. Additionally, decreasing the number of students per class may suppose an increase in the number of classes, which might be translated into hiring more teachers and, therefore, higher budgetary expenses in terms of these teachers’ salaries. For instance, following MECD (2018), secondary education teachers in Spain receive 61,543$ (PPA) as maximum salary, which is 7.4% higher than the OECD and 7.8% more than the UE22. Thus, in such a context, the decision of reducing class size in Spain should not be arbitrary, but be built on solid empirical evidence.
Specifically, this piece of research analyses class size influence on students’ performance for the most populated Spanish region (Andalusia, with a total of 8.4 million people in 2018) which, in addition, is one of the worst performing Spanish regions in international large-scale assessment tests. In the case of PISA3 2015 (OECD, 2016), Andalusian students obtained 479 points in reading (in contrast to Spanish students, who got 496 points and 487 for the OECD), 466 in mathematics (compared to 486 for Spain and 478 for the OECD) and 473 in science (493 for Spain and 488 for the OECD). Furthermore, Andalusia also presents a high percentage of repeater students in PISA 2015 (38%), while this figure was 31% for Spain and 13% for the OECD (OECD, 2016). This situation of Andalusia has remained similar in PISA 2018 (MECD, 2019, 2020).
This research work is novel as it is the first time that the influence of class size on students’ academic achievement has been analysed for Spain using census data, together with a methodology (fuzzy regression discontinuity) which let us get as close as possible to a causal influence. Particularly, the research question we want to answer is:
Does class size influence students’ academic performance in primary and secondary education in Andalusia?
The rest of the paper is structured as follows. First, we present a brief literature review, followed by a description of the data and methodology employed, the results, their discussion and conclusions.
2. Literature review
According to the previous literature, the most famous education experiment to study the influence of class size on students’ academic performance was the Tennessee Student Teacher Achievement Ratio (STAR) project. Many authors such as Mosteller (1995) and Finn and Achilles (1999) analysed its results and highlighted that reduced class size was positive for academic performance for primary education students, being this even more effective for poor children. Ehrenberg, Brewer, Gamoran, and Willms (2001) analysed this project and indicated that, although having internal validity, it did not have external validity, as the results applied only to the students participating in the experiment, being the characteristics of these students different from those presented by the population of Tennessee students. In addition, they indicated that class size reduction may be conditioned by the capacity of schools to create more classes.
This positive influence of class size reduction on students’ academic performance was also found by authors such as Jepsen and Rivkin (2009), who analysed an experiment aimed at studying the influence of class size on students’ academic performance in primary education in California, finding that lower class size was positive for performance in reading and mathematics. Similarly, Breton (2014) found, for fourth grade Colombian students in TIMSS4 2007, that a reduction from 53 to 20 students per class increased students’ academic performance in mathematics in 0.80 standard deviations. Francis and Barnett (2019) also analysed this issue for preschool students in Chicago, finding that a reduction in 5 students per class to a total of 15 students raised students’ cognitive scores in literacy skills in 0.2 standard deviations. In fact, some papers as Whitmore (2014) indicated that a reduced class size was necessary for better student outcomes, although this positive influence was reduced for higher grades. Zyngier (2014) analysed 112 research works and also indicated that the positive influence of reduced class size on students’ academic outcomes may be more relevant at early grades, and even more for socio-economically disadvantaged students. Contrarily, Etim, Etim, and Blizard (2020) analysed the influence of class size on primary and secondary students in North Carolina, finding that the influence of a higher class size was negative in primary education, but positive in secondary education.
Some meta-analyses have also studied this issue. For instance, Goldstein et al. (2000) focused on 9 research works which used multi-level analysis and found a reduction of students’ academic performance in 0.02 standard deviations per additional student in the class. Accordingly, Finn, Pannozzo, and Achilles (2003) performed a review of the literature on class size, finding that a reduced class size was associated with higher student engagement, which was also associated with their academic performance. Shin and Young (2009) did a meta-analysis on 17 studies for the United States, finding that small classes presented academic results of 0.20 standard deviations higher than those in larger classes. In a similar vein, Bowne et al. (2017) analysed 38 studies on class size influence for early childhood students in the United States, finding a positive influence of lower class size which ranged from 0.22 to 0.10 standard deviations until 15 students per class, being this influence null for bigger classes. Filges, Sonne-Schmidt, and Nielsen (2018) performed a meta-analysis of 127 studies for 41 countries, for students from kindergarten to 12nd grade, finding a positive but small influence of reduced class size on students’ reading performance, but no influence for mathematics. Moreover, Uttl et al. (2018) performed a meta-analysis using over 100 studies, finding that a reduced class size was positive for students’ academic performance until 20 students per class, decreasing this influence from 20 to 30 students per class.
On the other hand, some research works have indicated that “Reducing class size is not, on its own, a sufficient policy lever to improve the performance of education systems, and is a less efficient measure than increasing the quality of teaching” (OECD, 2012, p.1). Chingos and Whitehurst (2011) also supported this argument, finding that most of the existing class size studies, in spite of their huge amount, failed in having enough quality in order to be the basis of education policies. This was additionally supported by Hanushek (2011), who indicated that teacher quality seems to be more important than class size. Li and Konstantopoulos (2017) used data from TIMSS 2011 for 4th grade students in 14 European countries, and also found that class size may not have a positive influence on students’ academic performance (with the exception of Slovakia), indicating that classroom dynamics, instruction, and practices may be relevant to explain academic performance, but they could not be controlled in the model, as these variables were not included in the database. Leuven and Løkken (2017) analysed class size influence for 1st to 9th grade students in Norway, also finding that class size may not be relevant to explain their academic performance. Similarly, Köhler (2020) analysed this issue for 12nd grade South African students, finding a null influence of class size on students’ academic performance, indicating that other characteristics such as those of teachers or school functionality might be more relevant.
Thus, most studies seem to fail in obtaining a causal influence of class size on students’ academic performance due to endogeneity and issues of variable omission. Some research works which have successfully done this are, e.g., Akerhielm (1995), who employed an instrumental variable approach, using as instruments the average class size for a particular subject and students’ enrolment for eighth grade United States students. She found that the influence of class size on students’ academic performance changed from positive (with ordinary least squares) to negative (but small) or insignificant when using an instrumental variable estimate. Other research works such as Angrist and Lavy (1999) have got close to this causal relationship, using a fuzzy regression discontinuity approach for 4th and 5th grade Israeli students, finding that a reduced class size improved their academic performance. We follow a similar approach, but for 4th and 8th grade Spanish students and using student observations instead of class observations. These authors revisited their analysis in Angrist, Lavy, Leder-Luis, and Shany (2019), using 5th grade Israeli student data for the period 2002-2011 and they did not find any evidence of class size influence on students’ academic achievement. Shen and Konstantopoulos (2019) also employed a fuzzy regression discontinuity approach on TIMSS 2003, 2007 and 2011 data to analyse the influence of class size on 8th grade student performance in Hungary, Lithuania, Romania and Slovenia, finding that a reduction of 1 student per class in Romania was positively associated with an increase of 0.05 standard deviations in mathematics and science scores, and 0.03 standard deviations in science scores for Lithuania; however, class size did not influence students’ academic performance in Hungary and Slovenia.
Blatchford (2016) indicated that cross-country comparisons in terms of class size could be misleading due to low external validity of some research works, so special attention on each country situation has to be paid. Following this logic, the present research work is focused on Spain and, concretely, on Andalusia. This is particularly relevant bearing in mind that the evidence on the class size influence on students’ academic performance for Spain is quite scarce, correlational and far from conclusive. For instance, Wößmann and West (2006) found a positive association of class size reduction with 8th grade Spanish students’ academic performance (using TIMSS 1995 data); nevertheless, they employed as instrument the average class size of the grade reported by the school principal, so it might be subject to misreport. Other authors such as Mora, Escardíbul, and Espasa (2010) analysed an education policy reform implemented in Spain between 1992 and 2003 and its influence on the dropout rates of the 18-24 year age group during this period (using data from the Spanish Minister of Education and a correlational logistic model), finding that a reduced class size lowered dropout rates in around 0.4% per pupil in the class. Similarly, García-Pérez, Hidalgo-Hidalgo, and Robles-Zurita (2014) employed a switching regression model and found, for 15-year-old students participating in PISA 2009, that a reduced class size was positively associated with non-repeaters’ academic achievement in mathematics (in 0.008 standard deviations per pupil reduction) but with decreasing returns. Conversely, Anghel and Cabrales (2014) analysed a census of 6th grade students in the academic year 2008/09 in Madrid, using ordinary least squares regression with school fixed effects; they indicated that class size did not seem to have an influence on students’ academic performance, hence concluding that policies focused on it may be a waste of resources.
3. Data and methodology
3.1. Data
The census database employed in the present paper was gathered and provided by the Andalusian Agency of Education Assessment (AGAEVE from now on) with the aim of measuring students’ competences (or cognitive skills) in an assessment named as “diagnostic assessment test”. Concretely, this assessment intends to measure students’ competences on Spanish language (reading from now on) and mathematics, being these tests scored by external teachers. These tests were developed using questions that were similar in their structure and purpose to those employed by PISA to measure students’ competences5. Furthermore, students are linked to their administrative scores (SENECA scores) which are the scores that they obtained in the subjects of reading and mathematics at school after finishing the academic year (scored by their teacher), i.e. they measure students’ content-based knowledge; these administrative scores are going to be used as our dependent variable in the present study. In addition, this diagnostic assessment contains student, family, tutor teacher and school (answered by the head teacher) questionnaires, and also contains information about the class size of each class within each school.
The data used in this research work is that from the 2012/13 academic year for 4th and 8th grade students, together with 8th grade data for the academic year 2011/12 (which we will use as a robustness check for secondary education)6. These two academic years are used because the Spanish government increased by 20% the class size limit7 from the initial 25-student-limit for primary education (1st to 6th grade) and 30-student-limit for secondary education (7th to 10th grade) in 2011/12 to 30 students in primary education and 36 students in secondary education in 2012/13. In this census dataset, there are a total of 90,048 students in 2,482 schools in the 4th grade dataset in 2012/13, 86,626 students in 1,595 schools in the 8th grade dataset in 2012/13, and 88,277 students in 1,609 schools in the 8th grade dataset in 2011/12.
3.2. Methodology
First, with the objective of developing a fuzzy regression discontinuity approach, we need to check some characteristics of our data:
3.2.1. Testing for exogenous variation
As previously indicated, the education legislation indicated that schools had to reach a maximum of 30 students per class in primary education and 36 in secondary education in the academic year 2012/13 (30 students per class in secondary education in the academic year 2011/12). This legislation was exogenously set, but school head teachers may decide to follow it or not based on some conditional variables, so it is not as exogenous as it should be (in our data, only 38.18% of classes in 4th grade and 17% in 8th grade8 in 2012/13 strictly followed it)9. This is the main issue that makes us use a fuzzy regression discontinuity approach (combining regression discontinuity with instrumental variables) instead of directly using a sharp regression discontinuity methodology, as we will explain in the following.
3.2.2. Testing for discontinuity in covariates
In order to select the sample for our fuzzy regression discontinuity strategy, we obtained the total number of students who were attending 4th and 8th grades in each school and academic year (which we called the “school size”). Then, following Angrist and Lavy (1999), we took those schools which had a school size of ± 5 students around the class size legislation figure for that academic year. For example, in 2012/13, the class size legislation for primary education (and for secondary education in 2011/12) indicated a maximum of 30 students per class, so we kept those schools which had between 26 to 35 students, 56 to 65, 86 to 95, 116 to 125, 146 to 155 and 176 to 185 students10.
The main descriptive statistics are presented in Table A1 (Appendix) for each grade and academic year, together with a test of mean differences between the population and the sample under analysis. In these statistics we can appreciate some significant differences between them in terms of students’ socio-economic characteristics and school funding, with a higher number of differences for 8th grade for both academic years (most likely due to the lower rate of classes which followed the class size legislation). Hence, this may be the result, again, of a non-random decision by schools on their class size, so we will add control variables for students’ socio-economic status11 and school funding to our estimates, in order to grasp these differences.
3.2.3. Testing for continuity of the density and the class size instrument
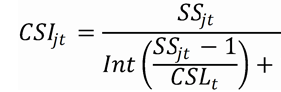
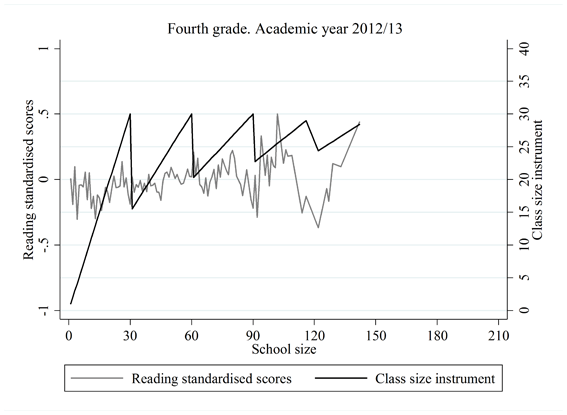
We describe in what follows the creation of a class size instrument which will intend to solve the previously described potential non-random allocation of students to classes. In this case, the proposed instrument is the class size that schools should have set when their school size reached the class size limit indicated by the class size law, thus randomly distributing students in equal-size classes. In order to obtain this instrument, we followed Angrist and Lavy (1999) and calculated:
 (1)
(1)
where j is the school; t the grade and academic year (t = 1 for 4th grade in 2012/13, t = 2 for 8th grade in 2012/13 and t = 3 for 8th grade in 2011/12); SSjt is the school size in that particular grade and academic year; CSLt is the class size limit by law for that grade and academic year (taking the value 30 for 4th grade in 2012/13 – and also for 8th grade in 2011/12 – and 36 for 8th grade in 2012/13); for any positive number n, the function Int(n) is the largest integer lower than or equal to n. For instance, for 4th grade in the academic year 2012/13 and school sizes between 1-30, CSIjt takes the values [1-30], [15.5-30] for school sizes between 31-60, [20.33-30] for 61-90, [22.75-30] for 91-120, and so on. Concretely, this class size instrument shows the class size which should have been set in the case that the schools had exactly followed the class size law when their school size reached the class size limit. As an example, whenever the school size reached to 32 in 4th grade in 2012/13 (2 students over the limit) then students should have been randomly separated into two classes of 16 students. Thus, to the extent that this class size instrument is based on an exogenous class size regulation, our instrument may follow the independence/exogeneity assumption.
In the following we present some graphics on the relationship between class size and our class size instrument (Figure 1) for both 4th and 8th grades in 2012/13 (and 8th grade in 2011/12). As it can be appreciated (and previously indicated), it seems that schools do not exactly follow the law in terms of dividing their students in similar size classes when the school size reaches the class size limit. The actual class size and the class size instrument present a significant correlation of 0.77 in 4th grade and 0.41 in 8th grade in 2012/13 (0.50 in 8th grade in 2011/12) so, as a preliminary approach, it seems that this instrument may be enough correlated with the endogenous variable that it instruments, accomplishing the relevance assumption (needing also a Stock & Yogo, 2005, test of weak instruments to check this, as we will see in the Results’ section).
FIGURE 1. Relationship between class size and the class size instrument
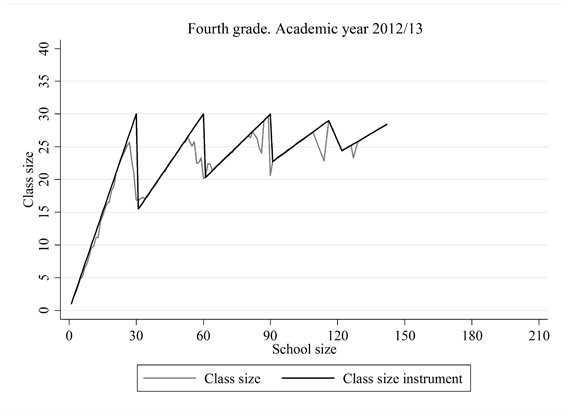
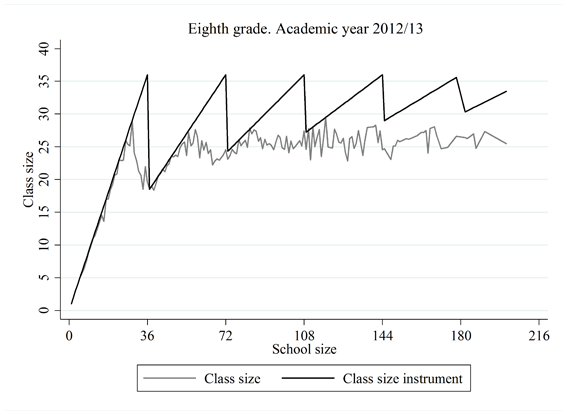
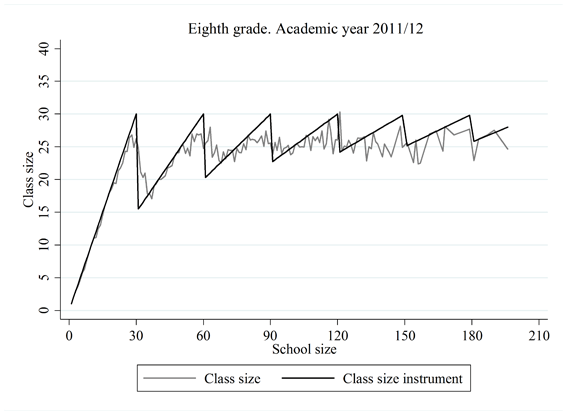
Notes: Class sizes are calculated by school size.
Source: Authors’ own calculations.
3.2.4. Testing for discontinuity in the outcome variables
As indicated by Feir, Lemieux, and Marmer (2016), we need the discontinuity of the outcomes not being weak to make our identification strategy work. In order to check this, we have plotted the relationship between standardised administrative scores in reading (Figure 2) and mathematics (Figure 3), for both 4th and 8th grades in 2012/13 (and 8th grade in 2011/12), together with the class size instrument. It seems that there is a positive relationship between the class size instrument and students’ standardised administrative scores (contrary to what is found in the literature), to the extent that standardised administrative scores seem to mimic the behaviour of the class size instrument, even in the “jump-downs” of the cut-off points of the class size instrument. This correlation seems to indicate that our regression discontinuity strategy may work (if the class size instrument is not correlated to the error term; we will check this when applying the Wooldridge, 1995, endogeneity test in the Results’ section).
FIGURE 2. Relationship between the class size instrument and reading standardised administrative scores
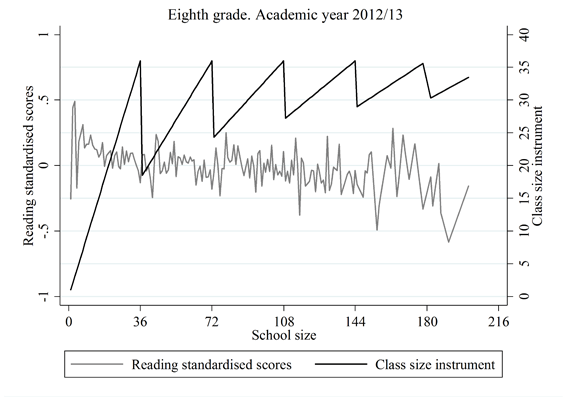
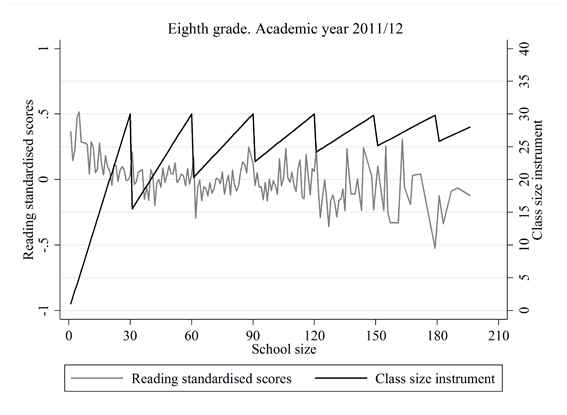
Notes: Reading standardised administrative scores are calculated by school size.
Source: Authors’ own calculations.
FIGURE 3. Relationship between the class size instrument and mathematics standardised administrative scores
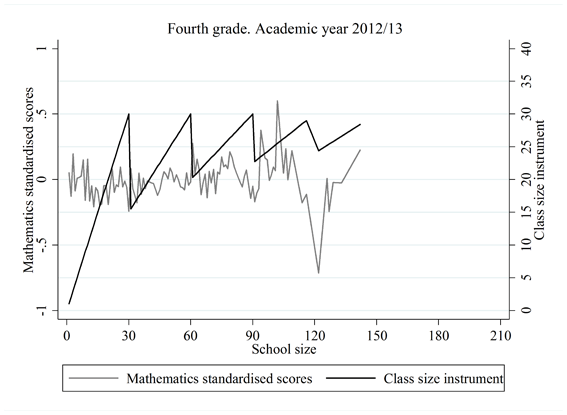
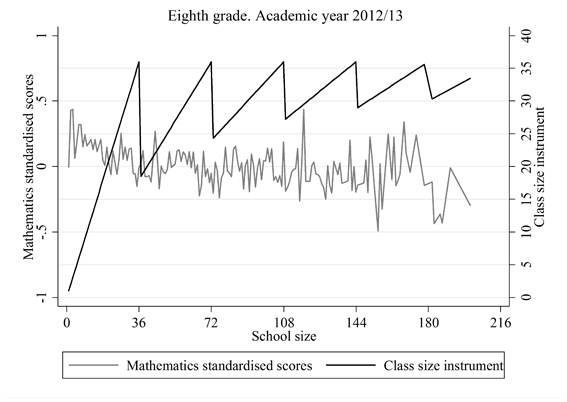
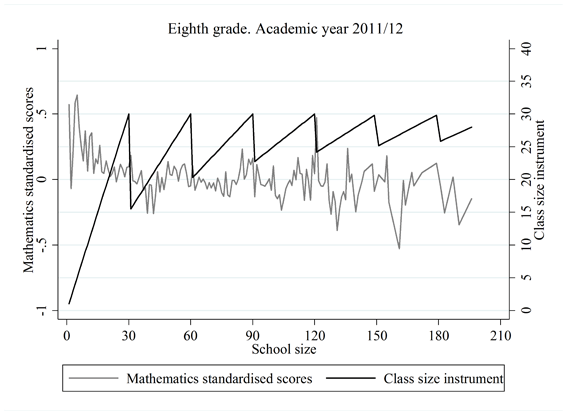
Notes: Mathematics standardised administrative scores are calculated by school size.
Source: Authors’ own calculations.
There are two additional properties that our class size instrument has to accomplish. First, the exclusion restriction, which states that the only influence channel of the instrument on students’ academic performance is through class size. As we have previously found, the instrument seems to accomplish this restriction, as it seems to be related to the outcomes of interest (as found in Figures 2 and 3) and the potential confounders for this relationship may be controlled by both the use of fuzzy regression discontinuity and socio-economic background controls. The second one is the monotonicity property (Barua & Lang, 2016; Dhuey, Figlio, Karbownik, & Roth, 2019; or Fiorini & Stevens, 2014). Barua and Lang (2016, p. 348) defined it as “while the instrument may have no effect on some individuals, all of those who are affected should be affected unidirectionally”12. Therefore, in the view of the previous results, it seems that the monotonicity property is accomplished, as there seems to be an increasing trend in standardised administrative scores with the class size instrument, which begins whenever we reach to a class size cut-off.
3.2.5. Ordinary least squares and census estimations
In order to see how using a simple regression approach may bias our results we present Table I. In this table the census information has been employed, analysing the influence of class size (specification I) and that of our instrument of class size (specification II) on students’ standardised administrative scores. As it can be appreciated, this influence is positive in the case of the class size variable, but differs depending on the grade and academic year for the class size instrument (ranging from negative to positive). Then, we can see here that, in the first case, the omission of relevant variables explaining students’ standardised administrative scores may positively bias the class size influence. In the second case, the use of the class size instrument, which represents a “proper” division of classes, is free of this omission; however, although ideal for our research work, this last division does not reflect reality.
TABLE I. Influence of class size on students’ standardised administrative scores, population estimates
|
Fourth grade. 2012/13 |
Eighth grade. 2012/13 |
Eighth grade. 2011/12 |
||||||||||
|
Specification I |
Specification II |
Specification I |
Specification II |
Specification I |
Specification II |
|||||||
|
Variables |
Reading |
Mathematics |
Reading |
Mathematics |
Reading |
Mathematics |
Reading |
Mathematics |
Reading |
Mathematics |
Reading |
Mathematics |
|
Class size |
0.013*** |
0.010*** |
- |
- |
0.017*** |
0.017*** |
- |
- |
0.016*** |
0.016*** |
- |
- |
|
(0.002) |
(0.002) |
(0.002) |
(0.002) |
(0.002) |
(0.002) |
|||||||
|
Classes size instrument |
- |
- |
0.009*** |
0.006*** |
- |
- |
-0.008*** |
-0.007*** |
-0.003 |
-0.002 |
||
|
(0.002) |
(0.002) |
(0.002) |
(0.002) |
(0.002) |
(0.002) |
|||||||
|
Constant |
-0.297*** |
-0.226*** |
-0.219*** |
-0.130*** |
-0.420*** |
-0.407*** |
0.236*** |
0.205*** |
-0.397*** |
-0.376*** |
0.064 |
0.057 |
|
(0.037) |
(0.035) |
(0.039) |
(0.038) |
(0.039) |
(0.040) |
(0.041) |
(0.043) |
(0.043) |
(0.042) |
(0.053) |
(0.054) |
|
|
Observations |
88,909 |
88,905 |
88,909 |
88,905 |
85,915 |
85,920 |
85,915 |
85,920 |
86,600 |
86,596 |
86,600 |
86,596 |
|
R-squared |
0.003 |
0.002 |
0.002 |
0.001 |
0.008 |
0.007 |
0.002 |
0.001 |
0.007 |
0.006 |
0.000 |
0.000 |
Notes: Standard errors are in parentheses and clustered at district level.
Estimation method: Ordinary least squares.
Dependent variable: Standardised administrative scores using the mean and standard deviations of the population.
Coefficient: *** Significant at 1%, ** significant at 5%, * significant at 10%.
Source: Authors’ own calculations.
Thus, we have to move to our fuzzy regression discontinuity approach in order to get closer to the influence of class size on students’ academic performance.
3.2.6. Fuzzy regression discontinuity
Once we have defined our class size instrument, we can implement the fuzzy regression discontinuity methodology. In order to do this, we stick only to our sample of analysis (schools which had a school size of ± 5 students around the class size legislation figure for that academic year) and estimate the following model, separately for each academic year:

where i represents the student, c the class, j the school and t the grade and academic year (t = 1 for 4th grade in 2012/13, t = 2 for 8th grade in 2012/13 and t = 3 for 8th grade in 2011/12); Yicjt are students’ standardised administrative scores (in reading or mathematics)13; CScjt is class size; Xicjt are student observable characteristics; Ccjt are class observable characteristics; SCHjt are school observable characteristics; α is a constant term and εicjt is the idiosyncratic error term.
As previously argued, our variable of interest (CScjt) may be biased by the particular decision of each school head teacher in terms of class division. Because of that, we estimate our main model by the use of two-stage ordinary least squares, for each grade and academic year. Our instrument is the previously defined CSIjt . The underlying idea is to instrument the class size variable using, as instrument, the class size which schools should have set if they had followed the education legislation, together with the rest of variables which may explain the differences between these two class sizes. Then, in the first stage of this procedure we regress the class size variable on the class size instrument and these variables:

Where π are the coefficients of the controlled variables and ϑicjt the idiosyncratic error term. Once these variables have been controlled for, we can obtain the predicted value of class size from equation (3), i.e.  , which would be free of their influence. Then, we can continue to the second stage, in which we substitute CScjt from equation (2) with this predicted value ():

The β coefficient would be measuring the influence of class size on students’ standardised administrative scores. The fact that this coefficient is measuring our influence of interest depends on the identification of those variables which are making CScjt differ from CSIjt. Then, we have controlled students’ characteristics (Xicjt) such as sex, socio-economic status and competences (in reading or mathematics). In the case of class variables (Ccjt), we have controlled by the years of experience of the tutor teacher – as previously indicated by Breton (2014) or Hanushek (2011), this experience may condition the influence of class size on students’ academic performance. Regarding to school variables (SCHjt), we have controlled by school funding and school size. It has also been controlled by squared school size, in order to find potential non-linearities. As a robustness check of our results and following Angrist and Lavy (1999), we have also employed a piecewise school size variable14. Furthermore, we added a district size variable and the sample has been clustered by district, in order to account for potential differences between districts in the amount of students who can access to the schools.
4. Results
The main results for our fuzzy regression discontinuity analysis are presented in Table II. First, in specification I we have included as controls only class size, school size and the quadratic school size, finding that class size does not seem to have any influence on students’ standardised administrative scores in any of the cases. Then, in specification II, we have included the rest of the previously described controls. As we can appreciate, again, class size seems to have a null influence on students’ standardised administrative scores. Regarding the rest of the variables, there are some of them which may be more important than class size to explain students’ standardised administrative scores: girls seem to perform better than boys in around 0.03 and 0.10 standard deviations (SD) in 4th grade and between 0.16 to 0.20 SD in 8th grade; in the case of the socio-economic status of students, it has also a positive influence on students’ standardised administrative scores (around 0.23 SD in 4th grade and between 0.14 to 0.18 SD in 8th grade for each 1 SD increase in this index). Furthermore, students’ standardised competences have a positive influence on students’ standardised administrative scores – around 0.58 SD in 4th grade and between 0.49 to 0.58 SD in 8th grade for each 1 SD increase on students’ competences15.
TABLE II. Influence of class size on students’ standardised administrative scores
|
Specification I |
Specification II |
|||||||||||
|
Fourth grade. 2012/13 |
Eighth grade. 2012/13 |
Eighth grade. 2011/12 |
Fourth grade. 2012/13 |
Eighth grade. 2012/13 |
Eighth grade. 2011/12 |
|||||||
|
Variables |
Reading |
Mathematics |
Reading |
Mathematics |
Reading |
Mathematics |
Reading |
Mathematics |
Reading |
Mathematics |
Reading |
Mathematics |
|
Class size |
-0.001 |
-0.004 |
-0.018 |
0.018 |
0.022* |
0.019 |
-0.022 |
-0.032 |
0.003 |
0.013 |
-0.011 |
-0.028 |
|
(0.008) |
(0.008) |
(0.038) |
(0.038) |
(0.012) |
(0.012) |
(0.019) |
(0.020) |
(0.041) |
(0.039) |
(0.027) |
(0.029) |
|
|
School size |
0.004 |
0.006 |
0.003 |
-0.004 |
0.002 |
-0.001 |
0.005 |
0.007** |
0.001 |
-0.002 |
0.005* |
0.005 |
|
(0.004) |
(0.005) |
(0.007) |
(0.006) |
(0.002) |
(0.001) |
(0.003) |
(0.003) |
(0.007) |
(0.007) |
(0.003) |
(0.003) |
|
|
Squared school size |
-0.000 |
-0.000 |
-0.000 |
0.000 |
-0.000 |
0.000 |
-0.000 |
-0.000* |
-0.000 |
0.000 |
-0.000** |
-0.000 |
|
(0.000) |
(0.000) |
(0.000) |
(0.000) |
(0.000) |
(0.000) |
(0.000) |
(0.000) |
(0.000) |
(0.000) |
(0.000) |
(0.000) |
|
|
Teacher’s years of experience (Ref.: less than 5 years) |
||||||||||||
|
20 years or more |
- |
- |
- |
- |
- |
- |
-0.183*** |
-0.192*** |
0.047 |
0.006 |
-0.040 |
-0.028 |
|
(0.049) |
(0.047) |
(0.054) |
(0.062) |
(0.032) |
(0.036) |
|||||||
|
10 years or more and less than 20 |
- |
- |
- |
- |
- |
- |
-0.144*** |
-0.161*** |
0.027 |
-0.025 |
0.012 |
-0.060* |
|
(0.055) |
(0.054) |
(0.052) |
(0.062) |
(0.033) |
(0.035) |
|||||||
|
5 years or more and less than 10 |
- |
- |
- |
- |
- |
- |
-0.078 |
-0.149*** |
0.050 |
-0.041 |
-0.002 |
0.003 |
|
(0.051) |
(0.050) |
(0.048) |
(0.056) |
(0.031) |
(0.033) |
|||||||
|
School funding: (Ref.: public) |
||||||||||||
|
Private |
- |
- |
- |
- |
- |
- |
0.004 |
-0.032 |
0.612*** |
0.387*** |
0.081 |
0.226 |
|
(0.167) |
(0.127) |
(0.153) |
(0.143) |
(0.153) |
(0.198) |
|||||||
|
Semi-private |
- |
- |
- |
- |
- |
- |
0.050 |
0.166 |
-0.044 |
-0.156 |
-0.084 |
-0.019 |
|
(0.141) |
(0.150) |
(0.171) |
(0.178) |
(0.158) |
(0.168) |
|||||||
|
District size |
0.000 |
0.000 |
-0.000 |
-0.000* |
-0.000** |
-0.000 |
||||||
|
(0.000) |
(0.000) |
(0.000) |
(0.000) |
(0.000) |
(0.000) |
|||||||
|
Female (Ref.: male) |
- |
- |
- |
- |
- |
- |
0.101*** |
0.031*** |
0.156*** |
0.199*** |
0.179*** |
0.198*** |
|
(0.013) |
(0.012) |
(0.016) |
(0.014) |
(0.011) |
(0.013) |
|||||||
|
Socio-economic status |
- |
- |
- |
- |
- |
- |
0.228*** |
0.234*** |
0.175*** |
0.144*** |
0.164*** |
0.159*** |
|
(0.012) |
(0.013) |
(0.023) |
(0.023) |
(0.016) |
(0.017) |
|||||||
|
Standardised competences |
- |
- |
- |
- |
- |
- |
0.582*** |
0.585*** |
0.486*** |
0.576*** |
0.524*** |
0.577*** |
|
(0.013) |
(0.012) |
(0.027) |
(0.024) |
(0.018) |
(0.019) |
|||||||
|
Constant |
-0.072 |
-0.085 |
0.265 |
-0.253 |
-0.551** |
-0.363 |
0.448 |
0.608* |
-0.036 |
-0.106 |
0.089 |
0.464 |
|
(0.194) |
(0.216) |
(0.563) |
(0.585) |
(0.272) |
(0.289) |
(0.344) |
(0.364) |
(0.554) |
(0.523) |
(0.470) |
(0.511) |
|
|
Observations |
16,031 |
16,028 |
19,672 |
19,681 |
27,646 |
27,640 |
16,031 |
16,028 |
19,672 |
19,681 |
27,646 |
27,640 |
|
Instrumental variables tests |
||||||||||||
|
Wooldridge (1995) endogeneity test |
3.586* |
4.420** |
1.543 |
0.055 |
0.081 |
0.234 |
1.574 |
2.746 |
0.090 |
0.346 |
0.034 |
0.630 |
|
Stock and Yogo (2005) test of weak instruments |
78.927*** |
78.931*** |
5.450*** |
5.597*** |
22.551*** |
22.550*** |
18.185*** |
18.1892*** |
7.058*** |
6.728*** |
6.455*** |
6.380*** |
Notes: Standard errors are in parentheses and clustered at district level. A missing flag has been included in order to prevent missing information on teachers’ years of experience, students’ socio-economic status and standardised competences. The null hypothesis of the Wooldridge (1995) endogeneity test is that the endogenous variable is now exogenous and the null hypothesis of the Stock and Yogo (2005) test of weak instruments is that the instrument is weak.
Estimation method: Fuzzy regression discontinuity (regression discontinuity and two-stage least squares). The instrument of class size is the class size which schools should have set if they had followed the education legislation.
Dependent variable: Standardised administrative scores using the mean and standard deviations of the population.
Coefficient: *** Significant at 1%, ** significant at 5%, * significant at 10%.
Source: Authors’ own calculations.
We can find in this same table two tests aimed at checking whether our instrument has solved the endogeneity problems or not. Focusing on specification II, the first one is the Wooldridge (1995) endogeneity test, in which the null hypothesis is that the class size variable is not endogenous anymore; the null hypothesis of this test is accepted, so we can trust that our approach has solved endogeneity issues. Then, we performed Stock and Yogo (2005) test of weak instruments, in order to check whether the class size instrument is correlated enough to the class size endogenous variable, being the null hypothesis that it is a weak instrument. As we can appreciate, the null hypothesis is rejected at 1%, so we can assure that our instrument is not weak. Thus, the results of these two tests support that our class size instrument works well within this fuzzy regression discontinuity approach. Particularly, for specification I in 4th grade the first test indicates that our instrument does not solve endogeneity problems; nevertheless, when all the potential mediator variables for the difference between class size and its instrument have been controlled for, then it seems that endogeneity issues are solved.
In the case of our robustness check using a piecewise school size, the results are presented in Table III and we also find a null influence of class size on students’ standardised administrative scores and that our instrument also works.
TABLE III. Influence of class size on students’ standardised administrative scores, piecewise school size
|
Fourth grade. 2012/13 |
Eighth grade. 2012/13 |
Eighth grade. 2011/12 |
||||
|
Variables |
Reading |
Mathematics |
Reading |
Mathematics |
Reading |
Mathematics |
|
Class size |
-0.022 |
-0.031 |
0.005 |
0.014 |
-0.003 |
-0.025 |
|
(0.019) |
(0.020) |
(0.038) |
(0.036) |
(0.026) |
(0.027) |
|
|
Piecewise school size |
0.002 |
0.003 |
-0.002 |
-0.003 |
0.001 |
0.005 |
|
(0.003) |
(0.003) |
(0.006) |
(0.006) |
(0.004) |
(0.004) |
|
|
Teacher’s years of experience (Ref.: less than 5 years) |
||||||
|
20 years or more |
-0.182*** |
-0.192*** |
0.045 |
0.007 |
-0.040 |
-0.028 |
|
(0.048) |
(0.047) |
(0.052) |
(0.060) |
(0.031) |
(0.036) |
|
|
10 years or more and less than 20 |
-0.147*** |
-0.165*** |
0.025 |
-0.025 |
0.007 |
-0.061* |
|
(0.055) |
(0.053) |
(0.050) |
(0.060) |
(0.033) |
(0.034) |
|
|
5 years or more and less than 10 |
-0.079 |
-0.150*** |
0.048 |
-0.040 |
-0.006 |
0.001 |
|
(0.051) |
(0.050) |
(0.047) |
(0.056) |
(0.030) |
(0.033) |
|
|
School funding: (Ref.: public) |
||||||
|
Private |
0.013 |
-0.019 |
0.598*** |
0.387*** |
0.030 |
0.204 |
|
(0.162) |
(0.121) |
(0.158) |
(0.148) |
(0.146) |
(0.186) |
|
|
Semi-private |
0.044 |
0.158 |
-0.055 |
-0.160 |
-0.133 |
-0.040 |
|
(0.137) |
(0.146) |
(0.162) |
(0.169) |
(0.154) |
(0.157) |
|
|
District size |
-0.000 |
-0.000 |
-0.000 |
-0.000* |
-0.000** |
-0.000 |
|
(0.000) |
(0.000) |
(0.000) |
(0.000) |
(0.000) |
(0.000) |
|
|
Female (Ref.: male) |
0.101*** |
0.031*** |
0.157*** |
0.199*** |
0.179*** |
0.198*** |
|
(0.013) |
(0.012) |
(0.015) |
(0.014) |
(0.011) |
(0.013) |
|
|
Socio-economic status |
0.228*** |
0.235*** |
0.175*** |
0.144*** |
0.164*** |
0.159*** |
|
(0.012) |
(0.013) |
(0.024) |
(0.023) |
(0.016) |
(0.016) |
|
|
Standardised competences |
0.582*** |
0.585*** |
0.484*** |
0.576*** |
0.519*** |
0.575*** |
|
(0.013) |
(0.012) |
(0.025) |
(0.022) |
(0.018) |
(0.018) |
|
|
Constant |
0.504* |
0.692** |
0.045 |
-0.083 |
0.055 |
0.374 |
|
(0.296) |
(0.307) |
(0.511) |
(0.479) |
(0.429) |
(0.457) |
|
|
Observations |
16,031 |
16,028 |
19,672 |
19,681 |
27,646 |
27,640 |
|
Instrumental variables tests |
||||||
|
Wooldridge (1995) endogeneity test |
1.579 |
2.791 |
0.118 |
0.409 |
0.008 |
0.515 |
|
Stock and Yogo (2005) test of weak instruments |
19.055*** |
19.060*** |
8.263*** |
7.888*** |
7.128*** |
7.062*** |
Notes: Standard errors are in parentheses and clustered at district level. A missing flag has been included in order to prevent missing information on teachers’ years of experience, students’ socio-economic status and standardised competences. The null hypothesis of the Wooldridge (1995) endogeneity test is that the endogenous variable is now exogenous and the null hypothesis of the Stock and Yogo (2005) test of weak instruments is that the instrument is weak.
Estimation method: Fuzzy regression discontinuity (regression discontinuity and two-stage least squares). The instrument of class size is the class size which schools should have set if they had followed the education legislation.
Dependent variable: Standardised administrative scores using the mean and standard deviations of the population.
Coefficient: *** Significant at 1%, ** significant at 5%, * significant at 10%.
Source: Authors’ own calculations.
5. Discussion and conclusions
This paper has analysed the issue of class size and its relationship with students’ academic performance in primary and secondary education for the Spanish case. In order to do this, we have taken advantage of census data for the Spanish region of Andalusia, by the use of a fuzzy regression discontinuity approach. This methodology has been employed due to the decisions made by head teachers in order to allocate students in classes, who did not strictly follow the Spanish class size law, which has prevented us from directly using a sharp regression discontinuity approach.
In this context, our results indicate that class size does not seem to be a relevant variable in determining students’ academic performance in primary or secondary education, having a bigger weight the characteristics of those students who compose the class, as previously highlighted by authors such as Akerhielm (1995), Köhler (2020) – who also indicated that other characteristics such as those of teachers or school functionality may be relevant – or Li and Konstantopoulos (2017) – who highlighted that classroom dynamics, instruction, and practices may be relevant too. Thus, our results are in accordance to those found by authors such as Whitmore (2014) or Zyngier (2014), who remarked that class size is not so relevant in higher grades; nevertheless, in our case, it seems that it is not so relevant even in lower ones, as found by authors such as Angrist et al. (2019), Leuven and Løkken (2017) and Li and Konstantopoulos (2017). These results have passed many tests which indicate that our class size instrument has successfully worked.
This is quite relevant in terms of education legislations and budgetary decisions for Spain. In this sense, the common perception (without empirical support) that a bigger class size is negative for students’ academic performance may suppose triggering education policies aimed at reducing class sizes, which may increase the number of classes per school and, then, enhance the monetary expenses of hiring more teachers for these classes (Filges et al., 2018). However, our empirical results support that a bigger class size might not be such a problem, having a higher relevance the skills of the students attending the class. For instance, this may indicate that a big class crowded with highly skilled students might not be an issue, but a little one of low skilled ones might be. Thus, it seems that recent class size policies applied in Spain, which were aimed at improving students’ academic performance, were useless in both primary and secondary education and may be the origin of unnecessary expenses, concluding that education policy decisions should be based on empirical evidence for each particular case, more than on intuition.
In addition, the COVID-19 pandemic that we are living nowadays may have an impact on this class size issue (Oikawa, Tanaka, Bessho, & Noguchi, 2020; Phillips, Browne, Anand, & Bauch, 2021), as class size has become even more restrictive, so a clear and solid evidence on this topic prior to the pandemic should be developed, so that the consequences of this situation can be properly evaluated.
This paper is not free of limitations: in spite of presenting high internal validity for Andalusia, it does not have so much high external validity, as class size decisions may vary by country (as found by authors such as Blatchford, 2016, and Shen & Konstantopoulos, 2019) or even by region within Spain. In addition, our results are only applicable to primary and secondary education students in the academic years under analysis.
Future research works could be aimed at analysing this class size issue with this same methodology for the rest of Spanish regions whenever census data are available for them, and also for the whole of Spain – for international comparison purposes – or even for other countries. Furthermore, studying early childhood education or higher grades such as high school or university degrees may be interesting for future research. Finally, analysing the consequences on this class size issue in COVID-19 times could also be interesting for future research works.
References
Akerhielm, K. (1995). Does class size matter? Economics of Education Review, 14(3), 229–241. doi: 10.1016/0272-7757(95)00004-4
Anghel, B., & Cabrales, A. (2014). The Determinants of success in Primary Education in Spain. Revista de Evaluación de Programas y Políticas Públicas, 2, 22–53. doi: 10.5944/reppp.2.2014.12030
Angrist, J. D., & Lavy, V. (1999). Using Maimonides’ rule to estimate the effect of class size on scholastic achievement. The Quarterly Journal of Economics, 114(2), 533–575.
Angrist, J. D., Lavy, V., Leder-Luis, J., & Shany, A. (2019). Maimonides Rule Redux. American Economic Review: Insights, 1(3), 309–324. doi: 10.1257/aeri.20180120
Argaw, B. A., & Puhani, P. A. (2018). Does class size matter for school tracking outcomes after elementary school? Quasi-experimental evidence using administrative panel data from Germany. Economics of Education Review, 65, 48–57. doi: 10.1016/j.econedurev.2018.06.005
Barua, R., & Lang, K. (2016). School Entry, Educational Attainment and Quarter of Birth: A Cautionary Tale of a Local Average Treatment Effect. Journal of Human Capital, 10(3), 347–376. doi: 10.1086/687599
Blatchford, P. (2016). Is it true that class size does not matter? A critical review of research on class size effects. In P. Blatchford, K. Wing, M. Galton, K.-C. Lai, and J. Chi-Kin (Eds.), Class Size: Eastern and Western perspectives (pp. 92–104). New York: Routledge.
BOE (2006). Organic Law 2/2006, 3rd May, of Education (LOE). Spain: Nº 106, 4th May 2006, 17158–17207.
Bowne, J. B., Magnuson, K. A., Schindler, H. S., Duncan, G. J., & Yoshikawa, H. (2017). A Meta-Analysis of Class Sizes and Ratios in Early Childhood Education Programs: Are Thresholds of Quality Associated With Greater Impacts on Cognitive, Achievement, and Socioemotional Outcomes? Educational Evaluation and Policy Analysis, 39(3), 407–428. doi: 10.3102/0162373716689489
Breton, T. R. (2014). Evidence that class size matters in 4th grade mathematics: An analysis of TIMSS 2007 data for Colombia. International Journal of Educational Development, 34, 51–57. doi: 10.1016/j.ijedudev.2013.04.003
Chingos, M. M., & Whitehurst, G. J. (2011). Class Size: What Research Says and What It Means for State Policy. Washington D.C: Brookings Institution.
Dhuey, E., Figlio, D., Karbownik, K., & Roth, J. (2019). School Starting Age and Cognitive Development. Journal of Policy Analysis and Management, 38(9), 538–578. doi: 10.1002/pam.22135
Dolton, P., & Marcenaro-Gutierrez, O. D. (2011). If you pay peanuts do you get monkeys? A cross-country analysis of teacher pay and pupil performance. Economic Policy, 26(65), 5–55. doi: 10.1111/j.1468-0327.2010.00257.x
Ehrenberg, R. G., Brewer, D. J., Gamoran, A., & Willms, J. D. (2001). Class Size and Student Achievement. Psychological Science in the Public Interest, 2(1), 1–30. doi: 10.1111/1529-1006.003
Etim, J. S., Etim, A. S., & Blizard, Z. D. (2020). Class Size and School Performance: An Analysis of Elementary and Middle Schools. International Journal on Studies in Education, 2(2), 66–77. doi: 10.46328/ijonse.13
Feir, D., Lemieux, T., & Marmer, V. (2016). Weak Identification in Fuzzy Regression Discontinuity Designs. Journal of Business & Economic Statistics, 34(2), 185–196. doi: 10.1080/07350015.2015.1024836
Filges, T., Sonne-Schmidt, C. S., & Nielsen, B. C. V. (2018). Small class sizes for improving student achievement in primary and secondary schools: a systematic review. Campbell Systematic Reviews, 14(1), 1–107. doi: 10.4073/csr.2018.10
Finn, J. D., & Achilles, C. M. (1999). Tennessee’s Class Size Study: Findings, Implications, Misconceptions. Educational Evaluation and Policy Analysis, 21(2), 97–109. doi: 10.3102/01623737021002097
Finn, J. D., Pannozzo, G. M., & Achilles, C. M. (2003). The “Why’s” of Class Size: Student Behavior in Small Classes. Review of Educational Research, 73(3), 321–368. doi: 10.3102/00346543073003321
Fiorini, M., & Stevens, K. (2014). Assessing the Monoticity Assumption in IV and fuzzy RD designs. The University of Sydney Economics Working Paper Series, 13, 1–52.
Francis, J., & Barnett, W. S. (2019). Relating preschool class size to classroom quality and student achievement. Early Childhood Research Quarterly, 49, 49–58. doi: 10.1016/j.ecresq.2019.05.002
García-Pérez, J. I., Hidalgo-Hidalgo, M., & Robles-Zurita, J. A. (2014). Does grade retention affect students’ achievement? Some evidence from Spain. Applied Economics, 46(12), 1373–1392. doi: 10.1080/00036846.2013.872761
Goldstein, H., Yang, M., Omar, R., Turner, R., & Thompson, S. (2000). Meta-analysis using multilevel models with an application to the study of class size effects. Journal of the Royal Statistical Society: Series C (Applied Statistics), 49(3), 399–412. doi: 10.1111/1467-9876.00200
Hanushek, E. A. (2002). Evidence, politics, and the class size debate. In L. Mishel, and R. Rothstein (Eds.), The class size debate (pp. 37–65). Washington, DC: Economic Policy Institute.
Hanushek, E. A. (2011). The economic value of higher teacher quality. Economics of Education Review, 30(3), 466–479. doi: 10.1016/j.econedurev.2010.12.006
Jepsen, C., & Rivkin, S. (2009). Class Size Reduction and Student Achievement. Journal of Human Resources, 44(1), 223–250. doi: 10.3368/jhr.44.1.223
Köhler, T. (2020). Class size and learner outcomes in South African schools: The role of school socioeconomic status. Development Southern Africa, in press. doi: 10.1080/0376835x.2020.1845614
Krueger, A. B. (2003). Economic Considerations and Class Size. The Economic Journal, 113(485), F34–F63. doi: 10.1111/1468-0297.00098
Leuven, E., & Løkken, S. A. (2017). Long Term Impacts of Class Size in Compulsory School. IZA Discussion Papers No. 10594, 1–36.
Li, W., & Konstantopoulos, S. (2017). Does class-size reduction close the achievement gap? Evidence from TIMSS 2011. School Effectiveness and School Improvement, 28(2), 292–313. doi: 10.1080/09243453.2017.1280062
MECD (2018). Panorama de la educación Indicadores de la OCDE 2018. Informes Español. Madrid: Instituto Nacional de Evaluación Educativa.
MECD (2019). PISA 2018. Programa para la Evaluación Internacional de los Estudiantes. Informe español. Madrid: Ministerio de Educación y Formación Profesional.
MECD (2020). PISA 2018. Programa para la Evaluación Internacional de los Estudiantes. Resultados de lectura en España. Madrid: Ministerio de Educación y Formación Profesional.
Mora, T., Escardíbul, J.-O., & Espasa, M. (2010). The effects of regional educational policies on school failure in Spain. Revista de Economía Aplicada Número, 54(18), 79–106. http://www.redalyc.org/articulo.oa?id=96915832004
Mosteller, F. (1995). The Tennessee Study of Class Size in the Early School Grades. The Future of Children, 5(2), 113–127. doi: 10.2307/1602360
OECD (2012). How Does Class Size Vary Around the World? Paris: OECD Library.
OECD (2016). PISA 2015 Results (Volume I): Excellence and Equity in Education. Paris: PISA, OECD Publishing. doi: 10.1787/9789264266490-en
Oikawa, M., Tanaka, R., Bessho, S.-I., & Noguchi, H. (2020). Do Class Size Reductions Protect Students from Infectious Disease? Lessons for Covid-19 Policy from Flu Epidemic in Tokyo Metropolitan Area. IZA Discussion Paper No. 13432, 1–30.
Phillips, B., Browne, D. T., Anand, M., & Bauch, C. T. (2021). Model-based projections for COVID-19 outbreak size and student-days lost to closure in Ontario childcare centres and primary schools. Scientific Reports, 11, 6402. doi: 10.1038/s41598-021-85302-6
Shen, T., & Konstantopoulos, S. (2019). Estimating causal effects of class size in secondary education: evidence from TIMSS. Research Papers in Education, in press. doi: 10.1080/02671522.2019.1697733
Shin, I.-S., & Young, J. (2009). Class size and student achievement in the United States: A meta-analysis. KEDI Journal of Educational Policy, 6(2), 3–19.
Stock, J. H., & Yogo, M. (2005). Testing for weak instruments in linear IV regression. In D. W. K. Andrews, and J. H. Stock (Eds.), Identification and Inference for Econometric Models: Essays in Honor of Thomas Rothenberg (pp. 80–108). New York: Cambridge University Press.
Uttl, B., Bell, S., & Banks, K. (2018). Student Evaluation of Teaching (SET) Ratings Depend on the Class Size: A Systematic Review. Proceedings of International Academic Conferences 8110392, International Institute of Social and Economic Sciences.
Whitmore, D. (2014). Does Class size Matter? Colorado Boulder: National Education Policy Center.
Wößmann, L., & West, M. (2006). Class-size effects in school systems around the world: Evidence from between-grade variation in TIMSS. European Economic Review, 50(3), 695–736. doi: 10.1016/j.euroecorev.2004.11.005
Wooldridge, J. M. (1995). Score diagnostics for linear models estimated by two stage least squares. In G. S. Maddala, T. N. Srinivasan, and P. C. B. Phillips (Eds.), Advances in Econometrics and Quantitative Economics: Essays in Honor of Profesor C. R. Rao (pp. 66–87). Oxford: Blackwell.
Zyngier, D. (2014). Class size and academic results, with a focus on children from culturally, linguistically and economically disenfranchised communities. Evidence Base, 1, 1–24. doi: 10.21307/eb-2014-001
Contact address: Luis Alejandro López-Agudo, Universidad de Málaga, Facultad de Ciencias Económicas y Empresariales, Departamento de Economía Aplicada (Estadística y Econometría). Plaza de El Ejido s/n, 29013, Málaga (España). E-mail: lopezagudo@uma.es
Appendix
TABLE A1. Descriptive statistics and test of mean differences between the population and the employed sample
|
Fourth grade. 2012-13 |
Eighth grade. 2012/13 |
Eighth grade. 2011/12 |
|||||||||||||||||
|
Population |
Sample |
Population |
Sample |
Population |
Sample |
||||||||||||||
|
Variables |
Obs. |
Mean |
S.D. |
Obs. |
Mean |
S.D. |
Obs. |
Mean |
S.D. |
Obs. |
Mean |
S.D. |
Obs. |
Mean |
S.D. |
Obs. |
Mean |
S.D. |
|
|
Sex of the student |
Male |
90,048 |
0.51 |
0.50 |
16,433 |
0.52 |
0.50 |
86,626 |
0.52 |
0.50 |
19,880 |
0.52 |
0.50 |
88,271 |
0.52 |
0.50 |
28,109 |
0.52 |
0.50 |
|
Female |
90,048 |
0.49 |
0.50 |
16,433 |
0.48 |
0.50 |
86,626 |
0.48 |
0.50 |
19,880 |
0.48 |
0.50 |
88,271 |
0.48 |
0.50 |
28,109 |
0.48 |
0.50 |
|
|
Level of education of the father |
Incomplete primary education or did not attend school |
70,745 |
0.13 |
0.33 |
12,822 |
0.13 |
0.33 |
62,998 |
0.15D |
0.36 |
13,916 |
0.16D |
0.36 |
61,706 |
0.16D |
0.36 |
19,638 |
0.15D |
0.35 |
|
EGB or Compulsory Secondary Education |
70,745 |
0.34D |
0.47 |
12,822 |
0.35D |
0.48 |
62,998 |
0.35D |
0.48 |
13,916 |
0.38D |
0.48 |
61,706 |
0.35D |
0.48 |
19,638 |
0.33D |
0.47 |
|
|
High school, First Grade Professional Formation, Elemental Arts School and Artistic Professions, BUP, COU, Official Language School or Medium Grade Professional Formation Cycle |
70,745 |
0.21 |
0.41 |
12,822 |
0.21 |
0.41 |
62,998 |
0.21 |
0.40 |
13,916 |
0.21 |
0.41 |
61,706 |
0.21 |
0.41 |
19,638 |
0.21 |
0.41 |
|
|
Second Grade Professional Formation, Arts Speciality and Artistic Professions or High Grade Professional Formation Cycle |
70,745 |
0.12D |
0.33 |
12,822 |
0.11D |
0.31 |
62,998 |
0.10 |
0.31 |
13,916 |
0.10 |
0.31 |
61,706 |
0.10 |
0.31 |
19,638 |
0.11 |
0.31 |
|
|
University degree, PhD |
70,745 |
0.20 |
0.40 |
12,822 |
0.20 |
0.40 |
62,998 |
0.19D |
0.39 |
13,916 |
0.15D |
0.36 |
61,706 |
0.18D |
0.38 |
19,638 |
0.20D |
0.40 |
|
|
Level of education of the mother |
Incomplete primary education or did not attend school |
79,641 |
0.09 |
0.29 |
14,447 |
0.09 |
0.29 |
70,425 |
0.12D |
0.33 |
15,651 |
0.13D |
0.34 |
68,675 |
0.13D |
0.34 |
21,758 |
0.12D |
0.32 |
|
EGB or Compulsory Secondary Education |
79,641 |
0.35 |
0.48 |
14,447 |
0.35 |
0.48 |
70,425 |
0.38D |
0.49 |
15,651 |
0.41D |
0.49 |
68,675 |
0.39D |
0.49 |
21,758 |
0.37D |
0.48 |
|
|
High school, First Grade Professional Formation, Elemental Arts School and Artistic Professions, BUP, COU, Official Language School or Medium Grade Professional Formation Cycle |
79,641 |
0.21 |
0.41 |
14,447 |
0.21 |
0.41 |
70,425 |
0.21 |
0.41 |
15,651 |
0.21 |
0.41 |
68,675 |
0.21 |
0.41 |
21,758 |
0.21 |
0.41 |
|
|
Second Grade Professional Formation, Arts Speciality and Artistic Professions or High Grade Professional Formation Cycle |
79,641 |
0.12D |
0.33 |
14,447 |
0.12D |
0.32 |
70,425 |
0.10D |
0.30 |
15,651 |
0.09D |
0.29 |
68,675 |
0.09 |
0.29 |
21,758 |
0.10 |
0.30 |
|
|
University degree, PhD |
79,641 |
0.23 |
0.42 |
14,447 |
0.23 |
0.42 |
70,425 |
0.19D |
0.39 |
15,651 |
0.16D |
0.37 |
68,675 |
0.18D |
0.38 |
21,758 |
0.20D |
0.40 |
|
|
Father occupation |
Business managers or public administration |
70,349 |
0.07 |
0.26 |
12,715 |
0.07 |
0.26 |
62,302 |
0.08D |
0.27 |
13,778 |
0.07D |
0.25 |
61,434 |
0.07D |
0.26 |
19,594 |
0.08 D |
0.27 |
|
Technicians, professionals, scientists and intellectuals. Army (officials and high ranks) |
70,349 |
0.13 |
0.34 |
12,715 |
0.13 |
0.34 |
62,302 |
0.13D |
0.33 |
13,778 |
0.11D |
0.30 |
61,434 |
0.13D |
0.34 |
19,594 |
0.14D |
0.36 |
|
|
Technicians and support professionals. Administrative employees. Little business people |
70,349 |
0.21 |
0.40 |
12,715 |
0.20 |
0.40 |
62,302 |
0.20D |
0.40 |
13,778 |
0.19D |
0.40 |
61,434 |
0.20D |
0.40 |
19,594 |
0.21D |
0.41 |
|
|
Hotel workers, personnel, protection and sellers. Army (sub-officials and low ranks) |
70,349 |
0.14D |
0.35 |
12,715 |
0.13D |
0.34 |
62,302 |
0.13 |
0.34 |
13,778 |
0.14 |
0.35 |
61,434 |
0.14 |
0.35 |
19,594 |
0.14 |
0.35 |
|
|
Agriculture and fishing qualified workers. Artisans and qualified manufacturing, construction and mining workers |
70,349 |
0.34D |
0.47 |
12,715 |
0.35D |
0.48 |
62,302 |
0.33D |
0.47 |
13,778 |
0.36D |
0.48 |
61,434 |
0.33D |
0.47 |
19,594 |
0.30D |
0.46 |
|
|
Non-qualified workers |
70,349 |
0.05D |
0.22 |
12,715 |
0.06D |
0.23 |
62,302 |
0.06D |
0.23 |
13,778 |
0.06D |
0.24 |
61,434 |
0.06 |
0.23 |
19,594 |
0.06 |
0.23 |
|
|
Performing housework |
70,349 |
0.01 |
0.10 |
12,715 |
0.01 |
0.10 |
62,302 |
0.01 |
0.10 |
13,778 |
0.01 |
0.11 |
61,434 |
0.01 |
0.10 |
19,594 |
0.01 |
0.09 |
|
|
Inactive |
70,349 |
0.05 |
0.23 |
12,715 |
0.05 |
0.22 |
62,302 |
0.06 |
0.24 |
13,778 |
0.06 |
0.25 |
61,434 |
0.06 |
0.23 |
19,594 |
0.06 |
0.23 |
|
|
Mother occupation |
Business managers or public administration |
78,575 |
0.03 |
0.18 |
14,231 |
0.03 |
0.18 |
69,282 |
0.04 |
0.19 |
15,358 |
0.03 |
0.18 |
67,804 |
0.03D |
0.17 |
21,513 |
0.03D |
0.18 |
|
Technicians, professionals, scientists and intellectuals. Army (officials and high ranks) |
78,575 |
0.13 |
0.34 |
14,231 |
0.13 |
0.34 |
69,282 |
0.12D |
0.32 |
15,358 |
0.10D |
0.30 |
67,804 |
0.12D |
0.32 |
21,513 |
0.13D |
0.34 |
|
|
Technicians and support professionals. Administrative employees. Little business people |
78,575 |
0.18 |
0.38 |
14,231 |
0.18 |
0.38 |
69,282 |
0.15D |
0.37 |
15,358 |
0.15D |
0.36 |
67,804 |
0.16D |
0.36 |
21,513 |
0.17D |
0.37 |
|
|
Hotel workers, personnel, protection and sellers. Army (sub-officials and low ranks) |
78,575 |
0.13D |
0.34 |
14,231 |
0.12D |
0.33 |
69,282 |
0.12D |
0.33 |
15,358 |
0.13D |
0.33 |
67,804 |
0.13 |
0.34 |
21,513 |
0.13 |
0.34 |
|
|
Agriculture and fishing qualified workers. Artisans and qualified manufacturing, construction and mining workers |
78,575 |
0.07D |
0.25 |
14,231 |
0.07D |
0.26 |
69,282 |
0.07D |
0.26 |
15,358 |
0.08D |
0.27 |
67,804 |
0.06D |
0.23 |
21,513 |
0.06D |
0.22 |
|
|
Non-qualified workers |
78,575 |
0.09 |
0.28 |
14,231 |
0.09 |
0.28 |
69,282 |
0.10D |
0.29 |
15,358 |
0.10D |
0.30 |
67,804 |
0.10D |
0.32 |
21,513 |
0.10D |
0.31 |
|
|
Performing housework |
78,575 |
0.34 |
0.47 |
14,231 |
0.35 |
0.48 |
69,282 |
0.37D |
0.48 |
15,358 |
0.38D |
0.49 |
67,804 |
0.37D |
0.48 |
21,513 |
0.35D |
0.48 |
|
|
Inactive |
78,575 |
0.03 |
0.17 |
14,231 |
0.03 |
0.17 |
69,282 |
0.03 |
0.17 |
15,358 |
0.03 |
0.17 |
67,804 |
0.03 |
0.17 |
21,513 |
0.03 |
0.17 |
|
|
Number of books at home |
Between 0 and 100 |
82,465 |
0.67 |
0.47 |
14,948 |
0.67 |
0.47 |
73,075 |
0.63D |
0.48 |
16,262 |
0.65D |
0.48 |
71,284 |
0.65D |
0.48 |
22,625 |
0.63D |
0.48 |
|
Between 101 and 200 |
82,465 |
0.16 |
0.37 |
14,948 |
0.16 |
0.36 |
73,075 |
0.17 |
0.37 |
16,262 |
0.17 |
0.37 |
71,284 |
0.17D |
0.37 |
22,625 |
0.17D |
0.38 |
|
|
More than 200 |
82,465 |
0.17 |
0.38 |
14,948 |
0.17 |
0.38 |
73,075 |
0.20D |
0.40 |
16,262 |
0.18D |
0.39 |
71,284 |
0.18D |
0.39 |
22,625 |
0.20D |
0.40 |
|
|
Household resources |
Place to study |
82,527 |
0.95 |
0.22 |
14,956 |
0.95 |
0.22 |
73,093 |
0.96 |
0.19 |
16,284 |
0.96 |
0.20 |
71,342 |
0.96D |
0.19 |
22,647 |
0.97D |
0.18 |
|
Internet |
82,186 |
0.83D |
0.38 |
14,899 |
0.82D |
0.39 |
73,045 |
0.89D |
0.31 |
16,262 |
0.88D |
0.32 |
71,036 |
0.89D |
0.31 |
22,538 |
0.90D |
0.30 |
|
|
Books (novels, tales, poems, comics…) |
82,319 |
0.96 |
0.19 |
14,904 |
0.96 |
0.19 |
72,888 |
0.96D |
0.21 |
16,207 |
0.95D |
0.22 |
70,796 |
0.94D |
0.25 |
22,479 |
0.94D |
0.23 |
|
|
School funding |
Public |
90,048 |
0.76D |
0.42 |
16,433 |
0.70D |
0.46 |
86,626 |
0.74D |
0.44 |
19,880 |
0.91D |
0.29 |
88,271 |
0.75D |
0.43 |
28,109 |
0.66D |
0.47 |
|
Semi-private |
90,048 |
0.21D |
0.41 |
16,433 |
0.25D |
0.44 |
86,626 |
0.24D |
0.43 |
19,880 |
0.08D |
0.27 |
88,271 |
0.23D |
0.42 |
28,109 |
0.31D |
0.46 |
|
|
Private |
90,048 |
0.03D |
0.16 |
16,433 |
0.05D |
0.22 |
86,626 |
0.02D |
0.13 |
19,880 |
0.01D |
0.10 |
88,271 |
0.02D |
0.15 |
28,109 |
0.03D |
0.16 |
|
Notes: “Obs.” stands for “Observations” and “S.D.” stands for “Standard Deviation”. The “D” means there are significant differences (significant at 5% or less) between the “Population” mean and the “Sample” mean columns within each grade and academic year.
Source: Authors’ own calculations.
1 Acknowledgements: The data used in this research have been provided by Agencia Andaluza de Evaluación Educativa, Consejería de Educación, Junta de Andalucía. This work has been partly supported by the Ministerio de Ciencia e Innovación under Research Project PID2020-119471RB-I00, and the FEDER funding under Research Project UMA18FEDERJA024 (Consejería de Transformación Económica, Industria, Conocimiento y Universidades, Junta de Andalucía)
2 This is discussed in this article of the Spanish newspaper “El País”: https://elpais.com/sociedad/2019/06/18/actualidad/1560868415_851675.html
3 PISA stands for “Programme for International Student Assessment”.
4 TIMSS stands for “Trends in International Mathematics and Science Study”.
5 Some examples of this kind of cognitive test questions for PISA can be found in https://www.oecd.org/pisa/test/.
6 Unfortunately, 4th grade data for the academic year 2011/12 is not available.
7 This modification was regulated in the Real law Decree 14/2012, of 20th April of urgent policies of rationalisation of public expense in the education field, which modified the initial class size legislation in BOE (2006, art. 157.1.a).
8 This figure is 18% of classes for 8th grade in 2011/12.
9 This is a trend which still continues. For instance, as indicated in the following press report (https://sevilla.abc.es/andalucia/sevi-mas-mitad-colegios-andaluces-supera-ratio-maxima-alumnos-profesor-201703201406_noticia.html), around 59.3% of Andalusian schools had class sizes with higher number of students than the class size limit in 2017.
10 For 8th grade students in 2012/13, as the class size limit was 36 students per class, these figures are 32 to 41 students, 68 to 77, 104 to 113, 140 to 149, 176 to 185 and 212 to 221 students.
11 Concretely, we have employed a socio-economic status index which was created by AGAEVE using the highest level of education of the parents, the highest parental occupation, the number of books at home and the level of home resources. It was standardised to have mean 0 and standard deviation 1.
12 It was defined by Fiorini and Stevens (2014) as “fo r a given change in the value of the instrument, it cannot be that some individuals increase treatment intensity while others decrease treatment intensity” (p. 2).
13 This standardisation has been performed using the mean and standard deviations of the population and is aimed at interpreting the results as effect sizes, for international comparisons.
14 The underlying idea of this piecewise school size variable is to create a continuous piecewise linear trend similar to the slope of school size on the linear segments (as suggested by Angrist & Lavy, 1999). Denoting the school size variable as , for 4th grade in the academic year 2012/13 (), this piecewise function is defined as for the interval [1, 30], for the interval [31, 60], for the interval [61, 90], for the interval [91, 120], for the interval [121, 150] and for the interval [151, 180]. For 8th grade in the academic year 2012/13 (), this piecewise function is defined as for the interval [1, 36], for the interval [37, 72], for the interval [73, 108], for the interval [109, 144], for the interval [145, 180] and for the interval [181, 216]. For 8th grade in the academic year 2011/12 (), the piecewise school size function is defined as for the interval [1, 30], for the interval [31, 60], for the interval [61, 90], for the interval [91, 120], for the interval [121, 150], for the interval [151, 180] and for the interval [181, 210].
15 The estimations on Table II have been replicated not including students’ standardised competences and results do not change. These estimations will be provided upon request to the authors.