Grade repetition and graduation in compulsory
secondary educa-tion in Spain. Empirical analysis and policy recommendations
La repetición de curso y la graduación en Educación
Secundaria Obligatoria en España. Análisis empíricos y
recomendaciones políticas
DOI:10.4438/1988-592X-RE-2021-394-510
Francisco López-Rupérez
Isabel García-García
Universidad Camilo José Cela
Eva Expósito-Casas
Universidad Nacional de Educación a Distancia (UNED)
Abstract
The grade repetition is one of the main topics of educational policy that has attracted the attention of researchers, mainly in Anglo-Saxon countries. This is a phenomenon that can affect a very large number of students and has clear economic consequences. Its connection with the problem of equity in education makes repetition a matter of political interest and a subject of ideological debate. This study has addressed the problem of repetition in Spain, and has identified the extent of the phenomenon and its evolution over the past decade, from a comparative perspective at both the international and subnational levels. The association between socioeconomic and cultural status and level of repetition has been analyzed from a regional perspective, as well as the predictive value of repetition with respect to graduation in compulsory secondary education; and a causal model involving, together, these three variables has been tested through a path analysis. The main findings reveal a large extent of the phenomenon at 15 years of age, a marked heterogeneity between territories and a strong and negative causal link between repetition and graduation that that doubles that of the OECD countries. From the above evidence, some consequences are drawn on the effectiveness of compensatory policies and well-founded proposals are made to correct the extent of the phenomenon of grade repetition in Spain and to reduce its effects on the future of students. In particular, the analysis of the implementation of compensation policies in the school environment, the evaluation of their impact and the reinforcement of both prevention and remediation interventions.
Keywords: Grade repetition, regional differences, policies of educational compensation, path analysis, graduation in compulsory secondary education, socioeconomic and cultural status.
Resumen
La repetición de curso es uno de los temas destacados de política educativa que ha atraído la atención de los investigadores, principalmente en los países anglosajones. Se trata de un fenómeno que puede afectar a un número muy amplio de alumnos y que tiene claras consecuencias económicas. Su vinculación con la problemática de la equidad en educación hace de la repetición escolar una cuestión de interés político y un objeto no menor de debate ideológico. En el presente estudio se ha abordado el problema de la repetición escolar en España, se ha determinado la amplitud del fenómeno y su evolución a lo largo de la última década, en una perspectiva comparada tanto a nivel internacional como subnacional; se ha analizado, desde un enfoque territorial, la asociación entre nivel socioeconómico y cultural y grado de repetición, así como el valor predictivo de la repetición con respecto a la graduación en la Educación Secundaria Obligatoria; y se ha puesto a prueba, mediante un path analysis, la validez de un modelo causal que implica, conjuntamente, esas tres variables. Lo esencial de los resultados revela una amplia extensión del fenómeno a los 15 años, una notable heterogeneidad entre territorios y una conexión causal intensa y negativa entre repetición y graduación que duplica la de los países de la OCDE. A partir de las anteriores evidencias, se extraen algunas consecuencias sobre el grado de efectividad de las políticas de compensación educativa y se efectúan propuestas fundadas tendentes a corregir la amplitud del fenómeno de la repetición en España y a reducir su incidencia sobre el futuro de los estudiantes. En particular, el análisis de la implementación de las políticas de compensación educativa en el medio escolar, la evaluación de su impacto y el refuerzo de las intervenciones tanto de prevención como de remediación.
Palabras clave: Repetición de curso, diferencias regionales, políticas de compensación educativa, path analysis, graduación en Educación Secundaria Obligatoria, Nivel socioeconómico y cultural.
Introduction
Even though the literature has established a variety of types of grade repetition (Brophy, 2006), for the purpose of this study we understand grade repetition to be the educational practice of retaining a student who has completed a full academic year in a specific educational grade at the same grade for the following school year.
Grade repetition is one of the main topics of educational policy that has attracted the attention of researchers, above all in Anglo-Saxon countries (Jackson, 1975). It is a phenomenon that can affect a very large number of students and has clear economic consequences (Dawson, 1998; Manacorda, 2012; West, 2012). In the case of Spain, according to data from the “State system of educational indicators 2019” (Sistema estatal de indicadores de la educación 2019) published by the Ministry of Education and Vocational Training (Spanish acronym: MEyFP, 2019), 2.5% of students in primary education in the 2016/17 academic year were grade repeaters; the figure for students in compulsory secondary education was 8.7%. This means that according to the corresponding data on the number of students, over 237,000 repeated a grade during this academic year in Spain in the compulsory school levels. On the economic front, and if the official figures available on spending per student are taken into consideration (ME and FP, 2019), simplified estimated calculations give a rough figure of annual spending in Spain associated with grade repetition in the order of 1.5 billion euros.1 But beyond the economic dimension, its relation to the problem of equity in education makes grade repetition a matter of political interest and an equally important matter for ideological debate.
Thus those who support the solution of grade repetition as an educational policy designed to improve the results of low-performance students, tend to cite the following arguments in favor of their position and against automatic or “social” promotion (Ikeda and García, 2014; Schwerdt and West, 2012; Thomson and Cunningham, 2000). Grade repetition sends a clear message to students that lack of effort and bad performance are not acceptable behavior in the school. It allows low-performing students to prepare better and to be ready for the next year, as it gives them the opportunity to correct their direction, enhance their self-esteem and reinforce their motivation, which will improve their results in following years. In contrast, automatic promotion frustrates students by placing them at higher levels for which they are not prepared. It obliges teachers to pay attention to students who are not sufficiently prepared while they try to attend to those better prepared; gives parents a false perception of their children’s academic progress and prevents them from noticing alarm signals that would mobilize their involvement; leads employers to conclude that diplomas have no value; and casts students with a precarious level of education into an adult society in which they cannot perform.
At the opposite extreme are the supporters of automatic promotion. For them, this educational practice gives low-performing students new opportunities to make progress, allows them to continue with the same classmates and to receive their support and not feel discriminated against at school. In contrast, repeating a grade forces student to repeat the same curriculum and robs them of the opportunity to learn new things. It discourages precisely those students whose motivation and self-confidence tend to be low, and may stigmatize them with their fellow students, teachers and families. All this will have a negative effect on their emotional development.
The phenomenon of repeating a grade and its consequences has been the subject of empirical research in the Anglo-Saxon world for more than a century. Because of this it has been subject to reviews with varying levels of systematization (Ikeda and García, 2014; Jacob and Lefgren, 2009; Jimerson, 2001; Jimerson, Anderson and Whipple, 2002; Jimerson, Ferguson, Whipple, Anderson, and Dalton, 2002; Rumberger, and Lim, 2008; Thomson and Cunningham, 2000; West, 2012). These have been added to by the most recent criticisms of the application of correlational methodologies and their limitations in establishing unambiguous causal connections (Babcock and
Bedard, 2011; Choi, Mediavilla and Valbuena, 2018; Eide and Showalter, 2001; Ikeda and García, 2014; Jacob and Lefgren, 2004; Murnane and Willett, 2011), to the point of considering that much of the work published is not conclusive (Choi et al., 2018; Jacob and Lefgren, 2004).
However, both the correlational studies and the most rigorous ones, focused on estimating the causal effect of policies of repeating grades on academic performance and early school leaving, reveal mixed empirical results: some positive and others negative. In any event, due to its frequent empirical link to the socioeconomic and cultural level of students, grade repetition has been identified as an area for intervention requiring the application of educational policies and practices. This is not only because of its association with variables of a purely academic nature, but also because of its predictive value of social and economic factors in adulthood.
The work by Choi et al. (2018) and García-Pérez, Hidalgo and Robles (2014) give an extensive account of the research referring to Spain. Compared with the Anglo-Saxon literature, and in particular that from North America, Spanish research is relatively recent, limited and affected for the most part by the methodological limitation described above (Choi et al., 2018). In addition it is systematically based on the PISA data, which correspond to self-report answers by students on their grade repetition levels. It is therefore subject, as we will see below, to the bias associated with “social desirability.”
This study tackles the problem of grade repetition in Spain with the following research objectives:
a) Determine the extent of the phenomenon of grade repetition in Spain and its changing patterns in the last decade from a comparative perspective at both international and sub-national level.
b) Analyze the links between the socioeconomic and cultural levels and the rate of repetition using a territorial approach.
c) Analyze the predictive value of grade repetition with respect to completion of Compulsory Secondary Education (Educación Secundaria Obligatoria, ESO) using a territorial approach.
d) Test the validity of a causal model that involves these three variables together, and the corresponding latent factors, using a path analysis.
Based on the above, the aim is to extract consequences about the level of effectiveness of our compensatory education policies and make well-founded proposals to correct the extent of the phenomenon of grade repetition and reduce its impact on the future lives of students.
Despite the controversies of an ideological nature relating to grade repetition, we consider that ultimately many researchers who are in favor of repeating would be prepared to accept its limitations; and many researchers in favor of automatic promotion would admit its weaknesses and risks as an instrument for achieving equity in education.
Methodology
Sample
With respect to samples, this study has used, first, the national PISA sample corresponding to the 2018 edition, made up of 6,736 students representing the whole Spanish population of students of 15 years of age, mainly in the 4th grade of ESO (compulsory secondary education); and second, the 19 extended samples corresponding to 19 autonomous regions and cities (N=32,330), which are statistically representative of their respective populations of school students of this age. Table I presents the different extensions (N) of the sub-national samples, as well as the percentages with respect to their respective populations.
TABLE I. Sample extension of students corresponding to each of the 19 autonomous regions and cities in Spain, together with percentages with respect to their respective populations.
|
N |
% |
|
|
Andalusia |
1,813 |
4.6% |
|
Aragon |
1,798 |
4.6% |
|
Asturias |
1,790 |
4.6% |
|
Balearic Islands |
1,797 |
4.6% |
|
Canary Islands |
1,842 |
4.7% |
|
Cantabria |
1,924 |
4.9% |
|
Castile-Leon |
1,858 |
4.8% |
|
Castile-La Mancha |
1,889 |
4.8% |
|
Catalonia |
1,769 |
4.5% |
|
Region of Valencia |
1,625 |
4.2% |
|
Extremadura |
1,809 |
4.6% |
|
Galicia |
1,865 |
4.8% |
|
Region of Madrid |
1,808 |
4.6% |
|
Region of Murcia |
1,796 |
4.6% |
|
Region of Navarra |
1,874 |
4.8% |
|
Basque Country |
3,612 |
9.2% |
|
La Rioja |
1,461 |
3.7% |
Source: own preparation based on the PISA 2018 database. (OECD, 2019 a)
Together with the samples described in Table 1 for determining the socioeconomic and cultural (ISEC) index of students and the grade repetition (REPEAT) index, measured by answers to the corresponding questionnaires given to PISA 2018 students, the work has made use of the complete populations for measuring the and the age-appropriateness rate and rate of graduation in ESO.
Variables
The variables in which we have focused our attention in this study have been as follows:
– The degree of repetition (REPEAT), which has been calculated in the 2018 PISA (OECD, 2019) using the records made by students of the corresponding samples for questions ST127Q01TA, ST127Q02TA and ST127Q03TA, in which the students had to indicate whether they had repeated a grade in the three levels of ISCED (International Standard Classification of Education) indicated, such that REPEAT=1 is the value assigned to students who indicated they had repeated at least once and REPEAT=0 if they answered “no, never.”
– The socioeconomic and cultural level (ISEC), calculated according to the PISA 2018 questionnaire. Specifically, it uses the information relating to the level of the parents’ education and occupation (PARED and HISEI) and the income level of the home (HOMEPOS).
– The rate of repetition (REP), measured using the administrative statistics relating to the rate of age-appropriateness IDN (REP=100-IDN) for the entire population of students of 15 years of age in 2018.
– The rate of ESO graduation (GRD), measured using administrative statistics related to ESO graduation in the academic year 2017/18 for the corresponding school population. Although it is a performance indicator that does is not in principle as precise as that of PISA, it is sufficiently informative for our purposes.2
Analysis procedure
Together with the procedures inherent to descriptive statistics, for the REPEAT and REP variables in particular we have used linear regression to correlate the ISEC variable with the REP variable broken down by autonomous regions and cities, thus dealing with the first two objectives of this work (a and b). The same procedure has been used in an initial approach to explore the predictive value of the REP variable over the GRD variable, thus tackling the third objective of the study (c). In both cases we carried out the corresponding variance analyses. Using the data analysis program IBM SPSS Statistics for Windows, Version 25.0.
We also carried out a path analysis (Blalock, 1988; Bryman and Cramer, 1994; Kim and Kohout, 1988; Pérez, Medrano and Sánchez Rosas, 2013) to test the validity of a causal model that involves the variables ISEC, REP and GRD and the corresponding latent factors in order to address the fourth and last objective (d). We used the Amos program for this (Version 23.0).
It is worth noting that path analysis is a form of multiple regression statistical analysis that goes beyond the direct impact of a set of independent variables on a dependent variable, as it also takes into consideration the interaction between the predictive variables, as well as their possible indirect influence on the dependent variables (Aron and Aron, 2001). With respect to causality, this technique does not prove its existence, but helps us argue about different causal hypotheses from an empirical base (Batista Foguet and Gallart, 2000). As Kim and Kohout (1998; p. 385) note, there are two general cases in which it is possible to apply path analysis. The first is the existence of at least one “weak causal order,” which means that “it is known, or assumed, that variable Xi may or may not affect variable Xj, but that in no case may Xj affect variable Xi. It is classified as a weak causal order because the above case does not in the strict sense require Xi to be the cause of Xj.” The second case is that of the “causal close”: “Given a bivariate covariance between X and Y, and a weak causal order from X to Y, the observed covariance between X and Y may be due:
(1) solely to the causal dependency of Y on X;
(2) the mutual dependence on a third variable;
(3) a combination of (1) and (2)” (Kim and Kohout, 1988; p. 385).
CHART I. Generic causal model for a three-variable scheme
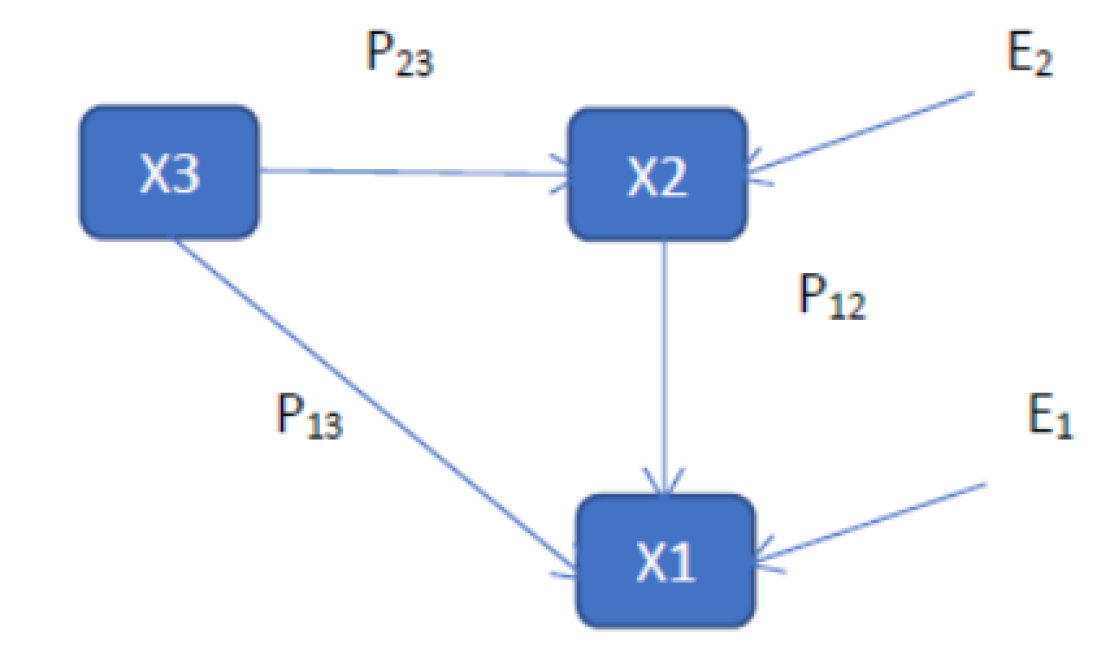
Source: Kim et al. (1988)
Chart I shows a generic causal model for a scheme with three variables, with E1 y E2 being the corresponding latent variables, each of which represents the total unknown residual causes, operating on the corresponding variable, and which are different from those considered explicitly in the causal model. Pij represent the path coefficients. This causal model must be accompanied by a plausible theoretical explanation of how and why the variables are related. This explanation will be given below.
Results
Extent of the grade repetition phenomenon in Spain: A comparative analysis
Based on the self-report data of the students in the different PISA editions, a comparative analysis can be carried out of the percentage of students of 15 years of age who have repeated a grade at least once during their studies, and the patterns of change in this figure over approximately a decade. Chart II shows the values of this indicator obtained by the OECD countries in the 2009, 2015 and 2018 editions of PISA. The following evidence should be highlighted from this analysis:
a) Most of the major EU countries are above the OECD average in terms of grade repetition.
b) There has been a gradual trend to reduction in grade repetition over practically a decade (2009-2018), most notably a drastic reduction in France.
c) Spain occupies a significant position (3rd) in this international ranking of grade repetition, and despite its moderate downward trend, it demonstrates the considerable importance of this phenomenon in our country.
CHART II. Percentage of students of 15 years of age who have repeated a grade at least once in the European Union countries PISA 2009, 2015 and 2018
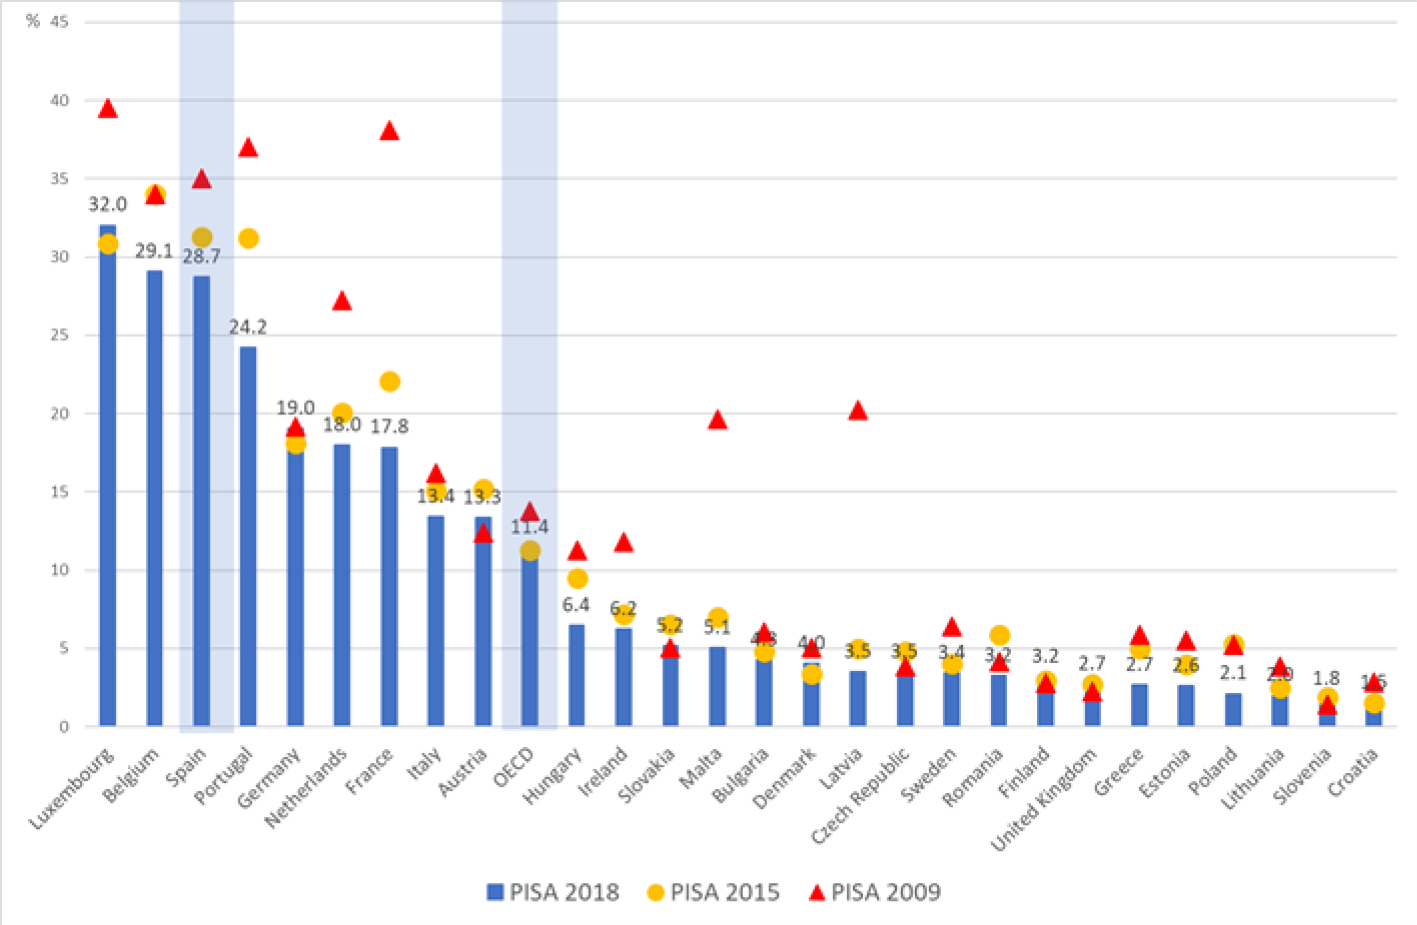
Source: Own preparation based on the PISA 2018, 2015 and 2009 database.
Chart III shows a summary of the phenomenon of grade repetition in Spain at sub-national level, in the autonomous regions and cities, using the same REPEAT variable. The following facts should be highlighted from this analysis:
a) The general trend for a reduction in the extent of grade repetition over time.
b) The figures for repetition triple those for the OECD as a whole.
c) Very significant differences between territories. When compared in reasonably homogenous terms, extensive differences can be discerned between autonomous regions, with figures that in 2018 range from 35.6% in the Canary Islands to 15.2% in Catalonia.
CHART III. Percentage of students of 15 years of age who have repeated a grade at least once in the autonomous regions and cities. PISA 2012, 2015 and 2018
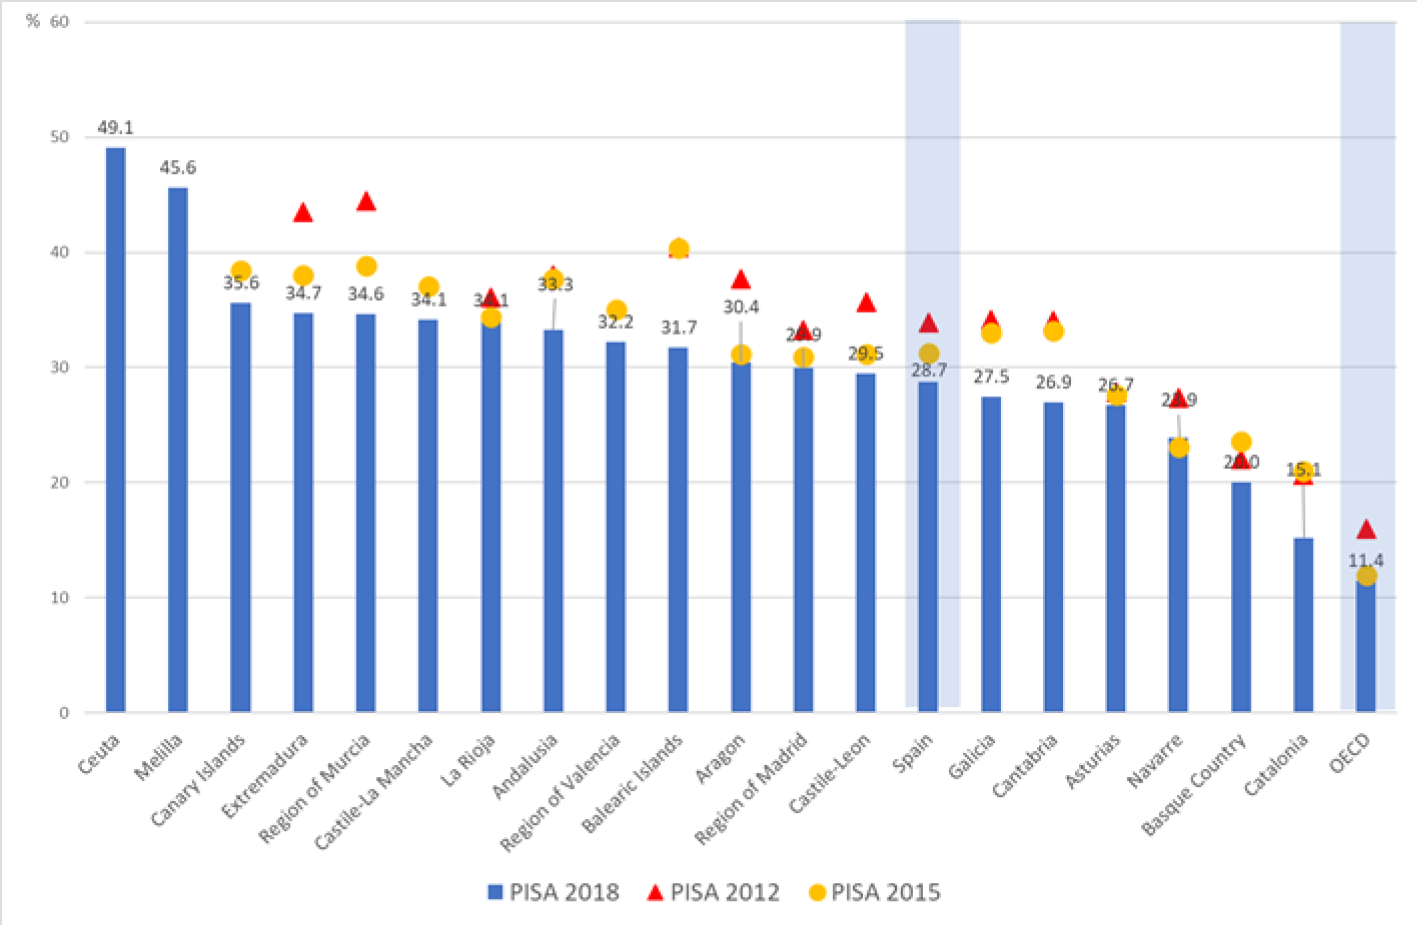
Note: The 17 autonomous regions began to participate in PISA with an extended sample in 2015 and Ceuta and Melilla did so in 2018.
Source: Own preparation based on the PISA 2018 database.
An alternative method of measuring the extent of the phenomenon of grade repetition at 15 years of age consists of using the age-appropriateness rate (IDN). This shows the percentage of students of a determined age who are studying in the grade theoretically corresponding to their age. It is therefore an inverse measurement of repetition. To put it another way, its complement to 100 constitutes an expression of the rate of at least one grade repetition, at the corresponding age3 (REP=100-IDN). Unlike the sample data taken from PISA, which is obtained from answers to questionnaires sent to students, the suitability rate at 15 years of age is measured directly and by census, and is expressed in the corresponding school statistics of the Ministry of Education (MEyFP, 2020).
Because of the way it is measured, this indicator involves a lower margin of error. This is because a “social desirability” mechanism operates when students self-report answers, so that their results may be conditioned by what is considered well regarded by their families and the school, or what is socially acceptable. This bias tends to generate a systematic error, in this case by default, as can be seen when comparing the figures for Spain and its autonomous regions and cities with another more reliable standard. For example, the average grade repetition rate as measured by PISA 2018 for the whole country is 28.7%, while the figure derived from the age-appropriateness rate at 15 years of age is 30.5% for the same year. In the case of Catalonia, the PISA 2018 measure gives a value of 15.1%, while that obtained from the age-appropriateness rate is 19.3%. Chart IV replicates Chart III, but with reference to the age-appropriateness rates. The facts inferred from the analysis are of the same nature as those advanced for the previous case: a slight reduction in the phenomenon over time and a considerable territorial inequality.
CHART IV. Age-appropriateness rate for 15 years of age in Spain and in the autonomous regions Academic years 2011/12, 2014/15 and 2017/18
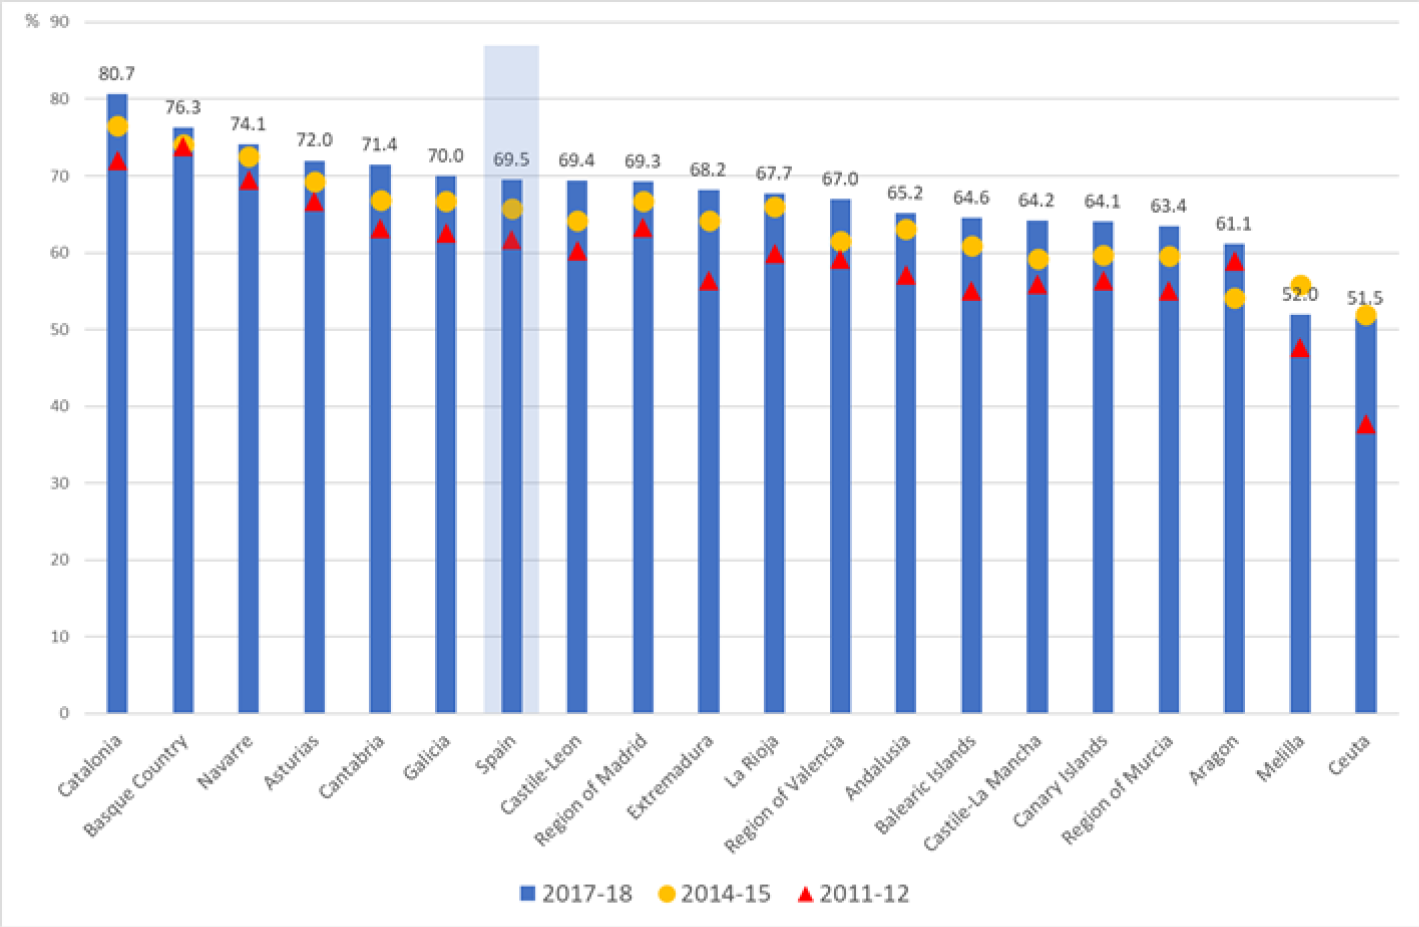
Source: Own preparation, based on statistics from non-university education. Ministry of Education and Vocational Training (MEyFP, 2019).
Even though the data from PISA are the only ones available for the purpose of international comparison, for sub-national comparison those obtained from the age-appropriateness rate are preferable in terms of reducing the margin for error and its propagation.
Socioeconomic and cultural level (ISEC) and the grade repetition
rate (REP)
An initial empirical approach to the problem of grade repetition from the perspective of equal opportunities consists of demonstrating the relationship in Spain between this phenomenon and the socioeconomic and cultural level.
The linear regression analysis carried out between ISEC and the grade repetition rate, calculated more precisely using the age-appropriateness rate at 15 years of age and referring to the academic year 2017/18, is shown in Chart V. This analysis allows us to infer the following:
a) A very strong association, with an R2 strength of 67%, between the two variables, which could reinforce the thesis that in Spain ISEC is an inverse predictor of the rate of repetition at 15 years of age, given that lower socioeconomic levels correspond to greater levels of repetition.
b) This is a position in terms of the incidence of the phenomenon of repetition that is greater than what would correspond to their socioeconomic and cultural level, in particular in the autonomous regions of Aragon and Madrid, and the autonomous city of Ceuta. These territories may be making use of repetition more frequently than expected.
c) This is a position in terms of the incidence of the phenomenon of repetition that is lower than that which would correspond to their socioeconomic and cultural level, in particular in the autonomous regions of Catalonia and Extremadura. These territories may be making use of repetition with a lower frequency than what would correspond from their ISEC.
CHART V. Linear regression analysis between ISEC and the repetition rate at 15 years of age (REP) in Spain and in the autonomous regions.
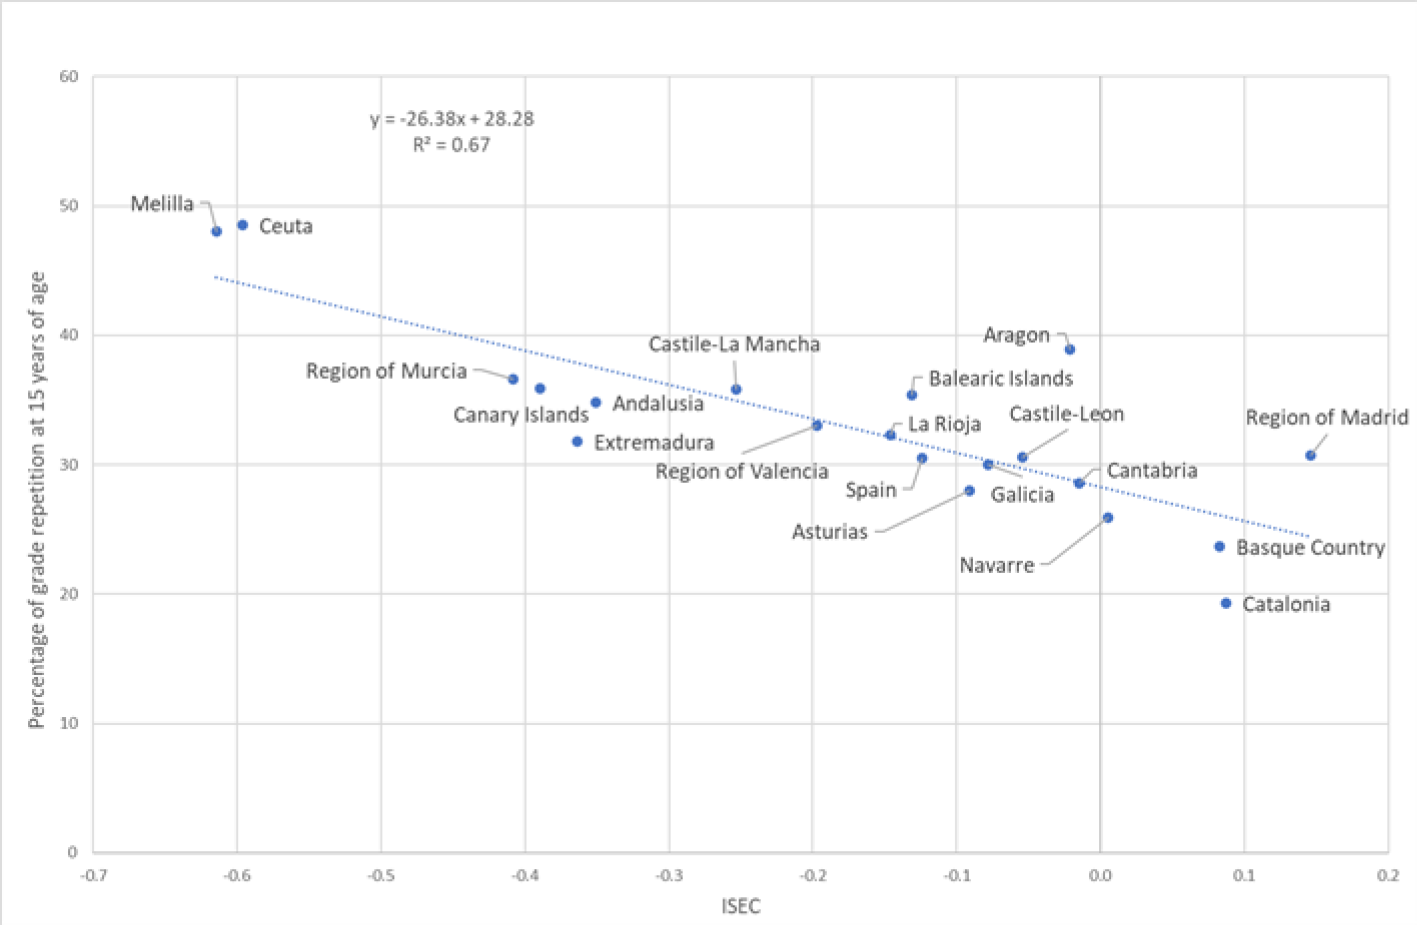
Source: Own preparation based on PISA 2018 for the ISEC and Non-University Educational Statistics, Ministry of Education and Vocational Training, for the repetition percentage at 15 years of age.
Table II shows the parameters corresponding to the regression analysis of the variables REP vs. ISEC presented in Chart V.
TABLE II. Parameters related to linear regression analysis between the rate of repetition (REP) at 15 years of age (academic year 2017/18) and ISEC (PISA, 2018) and the corresponding variance analysis
|
Correlation coefficient |
0.82 |
||||
|
Adjusted R^2 coefficient of determination |
0.65 |
||||
|
Typical error |
4.14 |
||||
|
Variance analysis |
|||||
|
Degrees of freedom |
Sum of squares |
Average of squares |
F |
Sig. |
|
|
Regression |
1 |
626.07 |
626.07 |
36.44 |
0.00 |
|
Residuals |
18 |
309.24 |
17.18 |
||
|
Total |
19 |
935.31 |
|
|
|
Although the nature of the methodology used does not allow us to define a formally established causal relationship, the very nature of the variables that have been considered alludes to a priority among them that is incompatible with the hypothesis of inverse causality: from repetition to the family’s socioeconomic and cultural level. The causal relationship may of course unfold in the medium or long term, but not at the time when both variables are measured simultaneously. We will refine this initial approach to this link and its size by the technique of path analysis.
Predictive value of repetition (REP) with respect to graduation in ESO (GRD)
Chart VI shows the result of the linear regression analysis carried out on the repetition rate (REP) at 15 years of age and school performance, measured by the graduation rate (GRD) at the end of the corresponding school level (ESO), whatever the age at which this graduation takes place. The following results should be highlighted from this analysis:
CHART VI. Linear regression analysis between the repetition rate at 15 years of age and the ESO graduation rate in Spain and in the autonomous regions
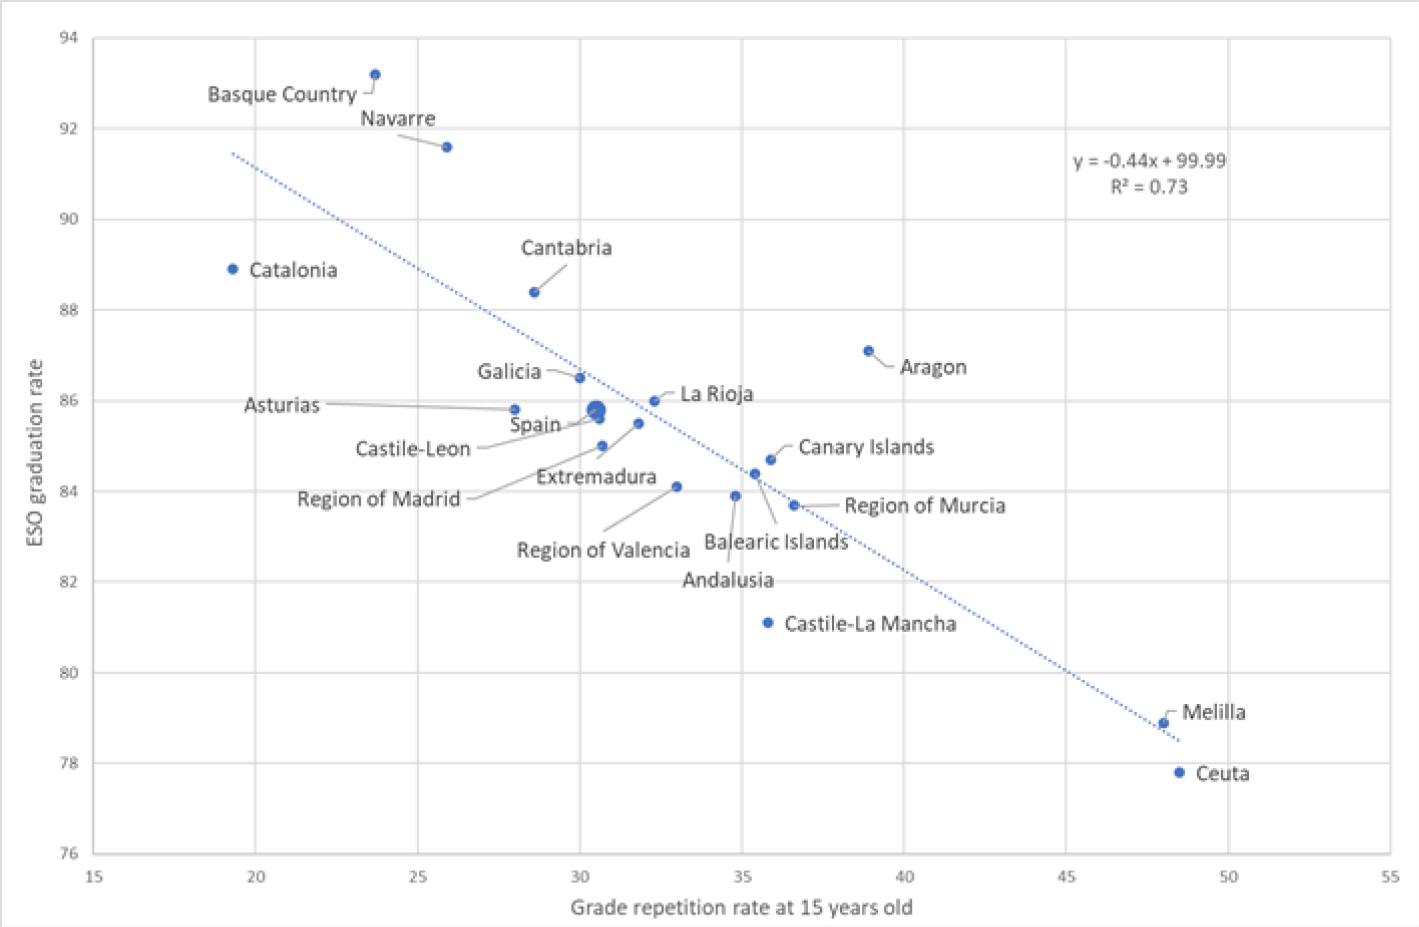
Source: Own preparation, based on statistics from non-university education. Ministry of Education and Vocational Training (MEyFP, 2019).
a) A very close association, with an R2 strength of 73% between the two variables, which strengthens the thesis that these are two strongly correlated phenomena in Spain. Repetition is thus a good inverse predictor of graduation.
b) This position in terms of the ESO graduation rate is higher than that which would correspond from the repetition rate, in particular in the autonomous regions of the Basque Country, Navarre and Aragon. In these cases, actions providing specific support, attention or personal involvement with the students repeating a grade, whether at school or in the family, could be more effective than the rest.
c) This position in terms of the ESO graduation rate is lower than that which would correspond from the repetition rate, in particular in the autonomous regions of Catalonia, Castile-La Mancha and Asturias. In these cases, actions providing specific support, attention or personal involvement with the students repeating a grade, whether at school or in the family, could be less effective than the rest.
Table III shows the parameters corresponding to the regression analysis of the variables GRD vs. REP, presented in Chart VI.
TABLE III Parameters related to linear regression analysis between the ESO graduation rate (GRD) (academic year 2017/18) and repetition rate (REP) at 15 years of age (academic year 2017/18) and the corresponding variance analysis
|
Correlation coefficient |
0,85 |
||||
|
Adjusted R^2 coefficient of determination |
0.71 |
||||
|
Typical error |
1.9 |
||||
|
Variance analysis |
|||||
|
|
Degrees of freedom |
Sum of squares |
Average of squares |
F |
Sig. |
|
Regression |
1 |
183.84 |
183.84 |
48.31 |
0.00 |
|
Residuals |
18 |
68.5 |
3.81 |
||
|
Total |
19 |
252.34 |
|
|
|
Path analysis of the variables ISEC, REP and GRD
Chart VII shows the causal model postulated for these three variables, together with the values of their characteristic parameters, which have been obtained based on successive hierarchical or sequential multiple regression analysis; the adjustment values of the model are shown in Table IV. Before starting the interpretation of the results, we have to note that this model satisfies the two requirements described above, which are necessary conditions for applying a path analysis.
With respect to the first requirement of at least a weak “causal order,” it must be stated that the empirical association noted between each pair of variables is accompanied by a clear priority in the causal order. Thus the ISEC -> REP relationship does not admit the opposite sense, as it is the socioeconomic and cultural level of students, a characteristic of their family milieu, that conditions their grade repetition and not the reverse, at least at the time when the observation is made. Something similar could be said about the ISEC -> GRD relationship as a measure of school performance. With respect to the REP -> GRD relationship, the temporal order of the two phenomena (the condition of repeating a grade precedes graduation in ESO) also justifies this causal order. With respect to the second requirement of “causal close,” the diagram of Chart VII itself assures that the conditions established in the definition hold.
The figures presented next to the graphics of Chart VII represent the values of their path coefficients. The following is inferred from this analysis:
a) The greater the socioeconomic and cultural level of the students (ISEC), the lower will be their repetition rate at 15 years of age (REP), with the strength of the direct relationship between the two variables being 6.2%.
b) The greater the rate of repetition of the students at 15 years of age (REP), the lower will be the ESO graduation rate (GRD), with the strength of the direct relationship between the two variables being 67.2%.
c) The greater the socioeconomic and cultural level of the students (ISEC), the greater will be the ESO graduation rate (GRD), with the strength of the direct relationship between the two variables being 1.4%.
d) The impact on the ESO graduation rate (GRD) of all the residual causes that impact this variable but that are not explicit in the model is high, with a force of 54.8%. This is therefore the variance percentage not explained by the model.
CHART VII Path diagram corresponding to the ISEC, REP and GRD variables.
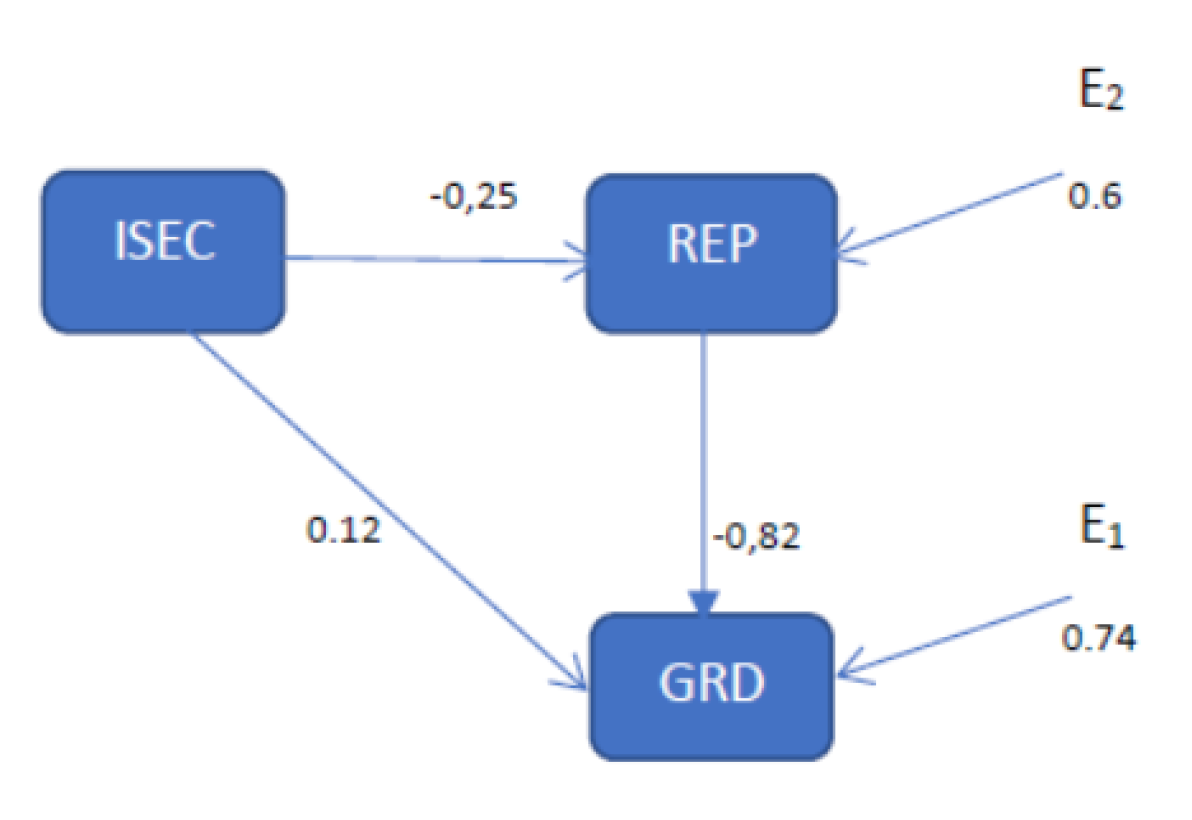
TABLE IV. Adjustment values of the model
|
Criterion |
Value obtained |
|
|
χ2 |
Significance > .05 |
0.104 |
|
χ2/gl |
< 3 |
0.104 |
|
GFI |
≥ .95 |
0.996 |
|
AGFI |
≥ .95 |
0.978 |
|
RMR |
Close to 0 |
0.154 |
|
RMSEA |
< 0.05 |
0.000 |
|
CFI |
≥ .95 |
1.00 |
The quantitative information summed up in Chart VII can be complemented with that in Table V. This table distinguishes between the causal and non-causal (spurious) effects; and within the causal effects, it distinguishes the direct from the indirect.
TABLE V. Decomposition of the effects of non-causal (spurious) and causal relations; and within the causal, of the direct and indirect.
|
Bivariate relation |
ISEC -> REP |
ISEC-> GRD |
REP->GRD |
|
A. Original covariation (rij)* |
-0.25 |
0.08 |
-0.86 |
|
B. Causal effects |
-0.25 |
0.32 |
-0.82 |
|
Direct |
-0.25 |
0.12 |
-0.82 |
|
Indirect |
0 |
0.20 |
0 |
|
C. Non-causal effects (A-B) |
0 |
0 |
-0.04 |
* rij corresponds to the correlation coefficient - multiple in the case GRD= f (REP, ISEC).
With respect to the spurious effects, derived from the fact that the variables are both correlated with a third variable, Table V indicates that this non-causal effect between the variables REP and GRD, both correlated with ISEC, is in this case small (-0.04) according to our model. With respect to the total effects of ISEC on GRD, they are the sum of direct (0.12) and indirect (-025 x -0.92=0.20) effects, in which the notable effect of repetition (REP) on graduation (GRD) provides a singular contribution (see path diagram in Chart VII).
Discussion and conclusions
The four research objectives expressed above have been reasonably covered by the analysis procedures, as reflected in the results obtained. However, in this discussion section it is worth looking closer at their two most relevant aspects: the association between the socioeconomic/cultural level and the repetition rate; and the predictive value of repetition with respect to graduation from Compulsory Secondary Education (ESO).
Carabaña (2013) has empirically linked repetition with the level of the parents’ studies; and along the same lines García-Pérez et al. (2014) have established that “the number of repeaters is greater among students with parents of a low educational level” (p. 1,377). More recently, Choi et al. (2018) have used a multivariate logistic model to provide a coefficient of association between grade repetition measured in PISA 2012 and the socioeconomic and cultural level (ISEC) of -0.639, with a value for the strength of this association of 0.527, as measured by the corresponding odd ratio (Choi et al., 2018). In this work, the correlation coefficient R obtained from a linear regression analysis between the ISEC of the students and the repetition rate (REP), measured using age-appropriateness (taking the 17 autonomous regions as a basis for the analysis) has been -0.82, with a coefficient of determination of 0.67. Although smaller (-0.25), the corresponding coefficient of our path analysis is in line with the same idea. There is thus a consistency in the meaning of the results of the different studies, despite having used different techniques of analysis and performance indicators, which alerts us that school repetition is a phenomenon that primarily affects socially disadvantaged students.
Even though research into the phenomenon of grade repetition is relatively recent in Spain, and thus less abundant than in the United States, practically all the studies available give results that are in line with the negative association between repetition and school results. This frequently leads the authors to recommend the removal of grade repetition, and even to support automatic promotion. Our previous empirical results obtained in this respect, in particular those of path analysis, also point to the negative impact of grade repetition at 15 years of age on subsequent school performance, measured by the ESO graduation rate. Although it is true that, as pointed out above, all our analysis is based on data that do not refer to subjects considered individually, but rather grouped by territories, the results once more present a notable coincidence with the other studies that have made use of a more precise level of analysis.
Thus, for example, Table VI shows the partial correlation coefficients between school repetition, measured by PISA 2015 based on student questionnaires, and performance in science, for Spain and the OECD, for the purposes of comparison. We also present the coefficients of partial correlation between ISEC and performance.
TABLE VI. Correlation coefficients associated with science performance of grade repetition of students and their socioeconomic and cultural level for Spain and the OECD. PISA 2015.
|
Repetition vs. performance |
ISEC vs. performance |
|
|
r(x100) d. e. |
r(x100) d. e. |
|
|
Spain |
-83.8 3.0 |
7.8 1.0 |
|
OECD |
-49.3 0.6 |
16.2 0.2 |
Source: PISA 2015 Results (Volume II): Policies and Practices for Successful Schools. OECD 2016. Annex B1.7 Results (tables): What PISA results imply for policy. Table II.7.1 y Figure II.7.2 Factors associated with science performance.
Although both the measure of repetition and that of performance has been made through different procedures (ours is based on administrative census statistics, while those of the OECD use questionnaires and science test samples from the 2015 PISA edition), the order of magnitude of the results obtained is similar. This fact not only converges with our data, but allows a comparison to be made that demonstrates an anomalous behavior by Spain. As a limitation we should note possible problems of compatibility, as well as those inherent to the data analysis techniques used.
Together with the negative nature of the impact, the notable strength of the relationship between repetition and performance in the Spanish case could be demonstrating a lack of consistency or effectiveness of the educational compensatory services applied in our country for grade repeating students.
Within the context of this study, it is of interest to complement the quantitative approach with the results of a qualitative study on grade repetition, promoted by the School Board of the Region of Navarre (Artuch Garde et al., 2015). From the conclusions of the study (Artuch Garde et al., 2015) we would like to highlight the fact that both students and teachers consider that “repetition is a useful measure, unless there is an alternative for supporting students who do not do well in their studies,” although teachers qualify this by saying that “the measure may be useful or not,” depending on the characteristics of the students. Among the advantages of repetition on which teachers and students coincide, the report highlights: “Students may receive more assistance and can make new friends; it helps them understand the subjects better and it may also be an opportunity to reflect and change their form of behavior” (p. 42). Among the disadvantages, both teachers and students note: “the loss of friends because of not continuing with the group they are used to; they also admit to an initial feeling of failure and low self-esteem, and the fact that they may have possible problems in the family (comparison with brothers and sisters, discussions due to study, etc.), or be less valued by some fellow students.” To sum up, the results of this exploratory study suggest the use of qualified support for students repeating a grade is indicated, if there is no alternative educational support.
In view of the above, experience from around the world, attitudes derived from national studies, our own results and of shared opinions of teachers and students derived from the qualitative study of the School Board of Navarre, the position that emerges from this study is that of an eclectic solution that does not reject repetition out of hand but complements it with appropriate compensatory educational support aligned with the transactional development model. This concept postulates that it is the specific characteristics of the school, family and individual that influence the development and performance of children, and as a result are the most likely forces behind the phenomenon of repetition (Jimerson, 1999; 2001).
Having reached this point, the objectives of this research combine to call on mechanisms for improvement in the implementation of the compensatory educational policies as a real need of our educational system. Of the quantitative results of this study, illuminated by our personal experience in state schools that educate the disadvantaged population above all (López Rupérez, 2008), the inference appears to be that compensatory educational policies which are generally applied under current law in the Spanish school system, could have a limited effectiveness. This is the opinion of the directors of public schools who participated actively in the Plan for Priority Public Schools in the Region of Madrid (López Rupérez, 2008); and this is also the main conclusion we would suggest, based on our empirical results; in particular the very notable expansion in comparative terms of the phenomenon of grade repetition in Spain, and the very strong negative correlation of repetition and success at school. The expansion of the phenomenon would be mitigated (as yet this has not been observed) if the general compensatory educational services operated effectively as prevention. The negative correlation would reduce its impact (also not seen in internationally comparative terms) if the repeating students were treated in a sufficiently personalized and effective way in order to cover their academic shortcomings. Both types of actions (prevention and remediation, respectively), and in particular prevention, assume the implications of the transactional development model and its underlying mechanisms (Jimerson, 1999; 2001). The recent research by Arroyo Resino et al. (2019) which concludes that the probability of repeating a grade is associated more with process variables, such as learning time and curriculum, reinforces the need to focus attention on specific mechanisms for compensatory education at school and on its level of effectiveness.
The above reasoning supports the convergent opinion of teachers and students which emerges from the qualitative study of the School Board of Navarre (Artuch Garde, González Felipe, Pascual Asura and Sanz Moreno, 2015), and which also questions a policy of automatic promotion as a miraculous formula which by itself could cover the deficiencies and shortcomings of the disadvantaged students: “Repetition is a useful measure, unless there is another alternative to help students who are not doing well in their studies” (p. 42).
An extensive and rigorous assessment of the impact of compensatory education policies currently in place in Spain would be essential, after nearly a quarter of a century since the regulations were introduced. This would allow a reconceptualization of the model with the aim of making more effective the preventive interventions that improve the results of disadvantaged students, and it would also reduce our very high grade-repetition rates.
With respect to repetition itself, the development of effective remediation policies, such as those implemented by the State of Florida in the United States (Schwerdt and West, 2012), allowing the identification of students at risk and implementing monitoring, support and reinforcement actions, summer classes, etc., targeted specifically at repeating students, could complement those of prevention.
Precedents such as those of the government PROA program (Manzanares Moya and Ulla Díaz. (2012) and the Priority Public Schools Plan in the Region of Madrid (López Rupérez, 2008), should be recovered, perfected in terms of their monitoring and conception, maintained over time and geared to an improvement of the results of disadvantaged students, as well as a reduction of grade repetition through these means.
Bibliography
Aron, A. y Aron, E. (2001). Estadística para Psicología. Buenos Aires: Pearson Education.
Arroyo Resino, D., Constante Amores, I. A. y Asensio Muñoz, I. (2019). La repetición de curso a debate: un estudio empírico a partir de PISA 2015. Educación XX1, 22(2), 69-92, doi: 10.5944/ educXX1.22479
Artuch Garde, R., González Felipe, P., Pascual Asura, A. y Sanz Moreno, A. (2015). Idoneidad y repetición en el sistema educativo en Navarra. Pamplona: Consejo Escolar de Navarra. Recuperado de https://consejoescolar.educacion.navarra.es/web1/wp-content/uploads/2015/12/Monografía-Idoneidad-y-repitición.pdf
Batista Foguet, J. M. B. y Gallart, G. C. (2000). Modelos de Ecuaciones Estructurales. Madrid: La Muralla.
Babcock, B. y Bedard, K. (2011). The wages of failure: new evidence on school retention and long-run outcomes. Education Finance and Policy, 293-322. Recuperado de: https://www.researchgate.net/publication/237415744_The_Wages_of_Failure_New_Evidence_on_School_Retention_and_Long-Run_Outcomes
Blalock, H.M. (1988). Estadística social. México D.F.: Fondo de Cultura Económica.
Brophy, J. (2006). Grade Repetition. Education Policy Series nº 6. IAE-IIEP/UNESCO. Recuperado de http//: www.unesco.org/ieps
Bryman, A. y Cramer, D. (1994). Quantitative data analysis for social scientists. New York: Routledge.
Carabaña, J. (2013). Repetición de curso y puntuaciones PISA ¿Cuál causa cuál?. En PISA 2012. Informe español. Volumen II: Análisis secundario. Madrid: INEE-MECD. Recuperado de https://www.educacionyfp.gob.es/inee/dam/jcr:67c216ff-0c79-4e81-9d2f-753916747c4d/pisa2012lineavolumenii.pdf
Choi, A., Gil, M., Mediavilla, M. y Valbuena, J. (2018). Predictors and effects of Grade Repetition. Revista de economía mundial, 48, 21-42.
Cordero Ferrera, J. M., Crespo Cebada, E. y Pedraja Chaparro, F. (2013). Rendimiento educativo y determinantes según PISA: una revisión de la literatura en España. Revista de Educación, 362. 273-297. DOI: 10.4438/1988-592X-RE-2011-362-161Recuperado de: https://www.educacionyfp.gob.es/dctm/revista-de-educacion/articulosre362/re36210.pdf?documentId=0901e72b816fbab8
Dawson, P. (1998). A primer on student grade retention: What the research says. Communiqué, 26, 28-30.
Eide, E. y Showalter, M. (2001). The effect of grade retention on educational and labor market outcomes. Economics of Education Review, 20(6), 563-576
García-Pérez, J., Hidalgo, M. y Robles, J. (2014). Does Grade Retention Affect Students’ Achievement? Some evidence from Spain. Applied Economics, 46(12), 1373-1392. DOI: 10.1080/00036846.2013.872761
Ikeda, M. y García, E. (2014). Grade repetition: A comparative study of academic and non-academic consequences. OECD Journal: Economic Studies, 1. Recuperado de http://dx.doi.org/10.1787/eco_studies-2013-5k3w65mx3hnx
Jackson, G. (1975). The research evidence on the effects of grade retention. Review of Educational Research, 45, 613-635.
Jacob, B.A. y Lefgren, L. (2004). Remedial Education and Student Achievement: A Regression discontinuity Analysis. Review of Economics and Statistics, 86(1), 226-244.
Jacob, B.A. y L. Lefgren, L. (2009). The Effect of Grade Retention on High School Completion. American Economic Journal: Applied Economics,1(3), 33-58.
Jimerson, S. R. (1999). On the failure of failure: Examining the association of early grade retention and late adolescent education and employment outcomes. Journal of School Psychology, 37, 243-272.
Jimerson, S. R. (2001). Meta-analysis of grade retention research: New directions for practice in the 21st century. School Psychology Review, 30, 420-437.
Jimerson, S.R., Anderson, G.E. y Whipple, A.D. (2002). Winning the battle and losing the war: examining the relation between grade retention and dropping out of high school. Psychology in the Schools, 39(4), 441-457.
Jimerson, S.R., Ferguson, P., Whipple, A.D., Anderson, G.E. y Dalton, M.J. (2002). Exploring the Association Between Grade Retention and Dropout: A Longitudinal Study Examining Socio-Emotional, Behavioral, and Achievement Characteristics of Retained Students. The California School Psychologist, 7, 51-62
Kim, J.O. y Kohout, F.J. (1988). Special topics in general linear models. En Statistical Package for the Social Sciences. Nie, N.H. et al. New York: McGraw- Hill.
López Rupérez, F. (2008). La Educación Pública Prioritaria de la Comunidad de Madrid y el reto de la integración de la población socialmente desfavorecida. En Políticas educativas para la cohesión social (pp. 319-352). Madrid: Fundación Europea Sociedad y Educación & Comunidad de Madrid. Consejería de Educación.
Manacorda, M. (2012). The Cost of Grade Retention. Review of Economics and Statistics, 94(2), 596-606.
Manzanares Moya, A. y Ulla Díez, S. (2012). La evaluación estatal del Plan de Refuerzo, Orientación y Apoyo (PROA). Análisis tras seis años de evaluación continuada. Revista de Educación, número extraordinario, 89-116. DOI: 10.4438/1988-592X-RE-2012-EXT-208. Recuperado de: https://sede.educacion.gob.es/publiventa/descarga.action?f_codigo_agc=15508
MEyFP, Ministerio de Educación y Formación Profesional (2019). Sistema estatal de indicadores de la educación 2019. Recuperado de http://www.educacionyfp.gob.es/dam/jcr:627dc544-8413-4df1-ae46-558237bf6829/seie-2019.pdf
MEyFP, Ministerio de Educación y Formación Profesional (2020). Las cifras de la educación en España. Curso 2017-2018. Recuperado de https://www.educacionyfp.gob.es/servicios-al-ciudadano/estadisticas/indicadores-publicaciones-sintesis/cifras-educacion-espana/2017-18.html
Murnane, R.J. y Willett, J.B. (2011). Methods Matter: Improving Causal Inference in Educational and Social Science Research. New York: Oxford University Press.
OECD (2016). PISA 2015 Results (Volume II): Policies and Practices for Successful Schools. Paris: OECD Publishing.
OECD (2019). PISA 2018 Results (Volume I): What Students Know and Can Do. PISA. Paris: OECD Publishing. Recuperado de https://doi.org/10.1787/5f07c754-en.
Pérez, E., Medrano, L. A. y Sánchez Rosas, J. (2013). El Path Analysis: conceptos básicos y ejemplos de aplicación. Revista Argentina de Ciencias del Comportamiento, 5(1), 52-66.
Rumberger, R.W. y Lim, S.A. (2008). Why Students Drop Out of School: A Review of 25 Years of Research. Santa Barbara, CA: California Dropout Research Project. Recuperado de http://cdrp.ucsb.edu/dropouts/pubs_reports.htm#15.
Schwerdt, G. y West, M. (2012). Effects of Early Grade Retention on Student Outcomes over Time: Regression Discontinuity Evidence from Florida. Program on Education Policy and Governance Working Papers Series. PEPG 12-09. Harvard Kennedy School.
Thompson, C. y Cunningham, E. (2000). Retention and Social Promotion: Research and Implications for Policy. ERIC Digest No. 161, New York: ERIC Clearinghouse on Urban Education, Teachers College, Columbia University
West, M.R. (2012). Is Retaining Students in the Early Grades Self-Defeating?. CCF Brief# 49. Washington: Center on Children and Families at Brookings.
Xia, N. y Kirby, S.N. (2009). Retaining Students in Grade: A Literature Review of the Effects of Retention on Students’ Academic and Nonacademic Outcomes. RAND Technical Report. Recuperado de www.rand.org/content/dam/rand/pubs/technical_reports/2009/RAND_TR678.pdf.
Contact address: Francisco López Rupérez. Universidad Camilo José Cela. Facultad de Educación. Cátedra de Políticas Educativas. C/ Castillo de Alarcón, 49, Urb. Villafranca del Castillo, 28692 Villanueva de la Cañada. E-mail: flopezr@ucjc.edu
1(1) The calculation is the result of using the spending per student in public and private educational institutions in euros (PPS) for compulsory education as a whole (5,837 euros PPS) (MEyFP, 2019; p 67).
2(2) The anomalies produced in measuring performance in reading competence for Spain in the 2018 PISA has led to these data not being available.
3(3) It is measured for ages that mark the start of the second and third cycles of primary education (8 and 10 years), the theoretical age for starting ESO (12 years) and for those associated with the last two grades of this stage (14 and 15 years).