Selection of Educational Indicators. Spain 1970-2025
Selección de Indicadores educativos. España 1970-2025
https://doi.org/10.4438/1988-592X-RE-2025-410-704
Enrique Roca
Catedrático de Educación Secundaria. Jubilado
Abstract
The aim of this article is to offer a very synthetic quantitative overview of some of the most significant indicators, especially those that show the evolution of the main results of Spanish education over the last 50 years. A total of 16 indicators have been selected, two on the demographic and economic context, one on funding, one on expenditure per pupil, one on teachers, three on school enrolment and nine on the results and educational level achieved by the adult population.
The sources used directly are the official ones proposed by the national and international institutions responsible for educational statistics and indicators or, in some cases, these same sources from their compilation by Spanish researchers of statistics from the last century.
The progress made in Spanish education since 1970, promoted by the main state and regional education laws and policies, is truly remarkable. The proposed indicators show that Spain´s educational backwardness prior to 1970 has been transformed into achievements in international assessments that place Spain within the OECD and EU averages and attainment levels in higher education similar to those of the most successful countries at this stage.
Keywords:
schooling, ‘student rates...’, qualifications, graduation, educational success, educational attainment of the adult population
Resumen
El objetivo del artículo es ofrecer una mirada cuantitativa, muy sintética, de algunos de los indicadores más significativos, sobre todo de aquellos que muestran la evolución de los principales resultados de la educación española de los últimos 50 años. Se seleccionan 16 indicadores en total, dos de contexto demográfico y económico, uno de financiación, uno de gasto por alumno, uno de profesorado, tres de escolarización y nueve de resultados y nivel educativo alcanzado por la población adulta.
Las fuentes utilizadas directamente son las oficiales propuestas por las instituciones nacionales e internacionales responsables de las estadísticas y los indicadores educativos o, en algunos casos, estas mismas fuentes a partir de su recopilación realizada por investigadores españoles sobre las estadísticas del siglo pasado
Los progresos de la educación española desde 1970, promovidos por las principales leyes y políticas educativas estatales y autonómicas, son realmente notables. Lo indicadores propuestos evidencian el paso de un destacado retraso educativo español antes de 1970, a unos logros en evaluaciones internacionales que sitúan a España en los promedios de OCDE y UE y a unos niveles de logro en educación superior similares a los de países de mayor éxito en esta etapa.
Palabras clave:
escolarización, “tasa de alumnos…”, titulación, graduación, éxito educativo, nivel de formación de la población adultaIntroduction
The selection of indicators presented in this article is intended to
provide a quantitative and synthetic overview of the objectives,
educational stages and results obtained as a consequence of the
application of educational laws and policies since 1970, as well as the
incorporation of the proposals of OECD, UNESCO and EU. The purposes of
this article and its dimensions require limiting the vast amount of
information available to a few indicators (Table 1).
TABLE I

Source: Compiled by the authors
The different educational stages, schooling ages and degrees present complex requirements when it comes to determining historical series of indicators in which the figures are comparable over time and with those of education in other countries. The International Standard Classification of Education (ISCED) (UNESCO, 2011) (Table 2) has made it possible to unify criteria and educational stages and thus facilitate comparisons over time and between countries.
TABLE II. International Standard Classification of Education (ISCED) (UNESCO, 2011)
Source: UNESCO General Conference, 36th Session. Paris.
The fundamental sources used in this article are three. First,
Spanish educational statistics, produced by the Subdirectorate General
of Statistics and Studies of the
MEFPD
Demographic and economic context
C1 Resident population in Spain
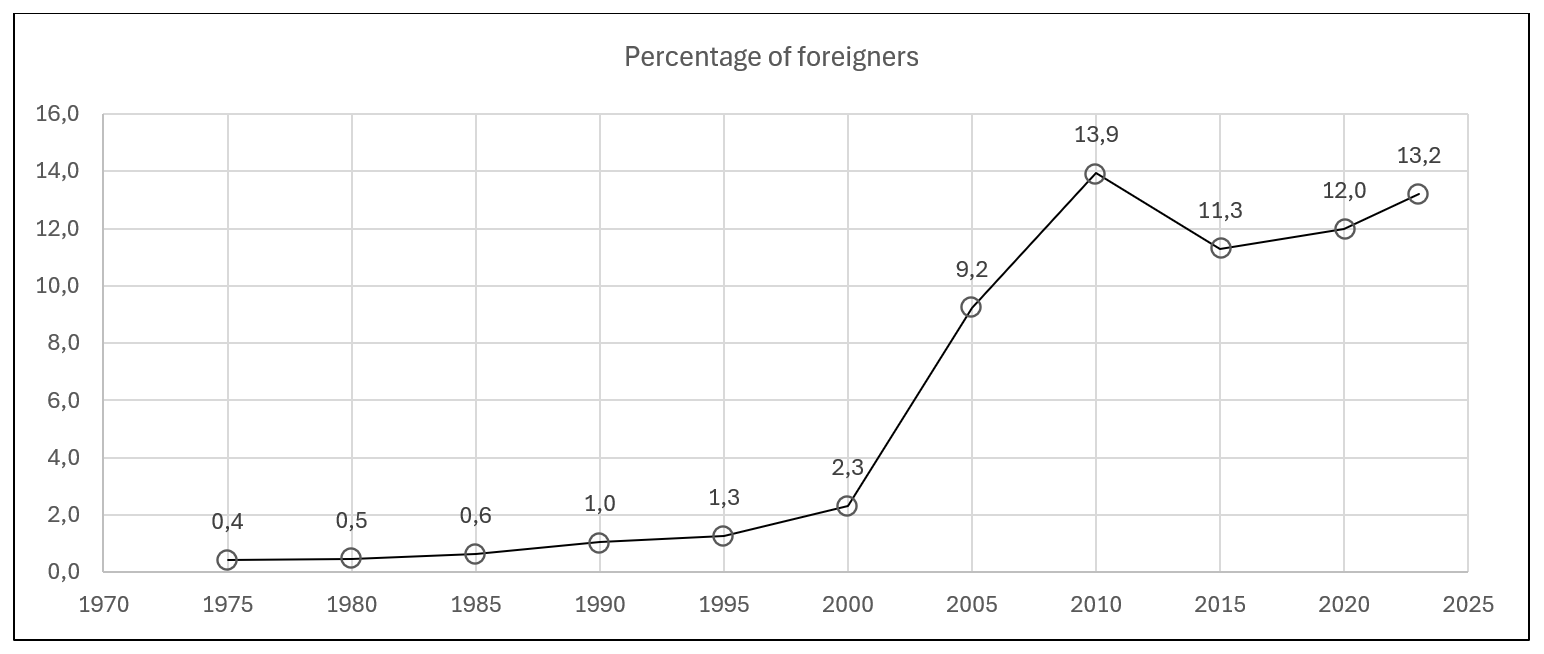
The Spanish population in 1900 was 18.8 million inhabitants. In 1971 that figure had risen to 34.0 million inhabitants (almost double, despite the Civil War), of which only 0.4% were foreigners. In those 70 years, the growth was essentially due to the difference between births and deaths. Twenty years later, in 1990, there were 38.9 million residents (3.3 million more, a more moderate increase than in previous decades) and 1% foreigners. In the first decade of this century, the Spanish population increased by 6 million inhabitants, reaching 46.5 million in 2010, of which 13.9% were foreign residents, a growth that coincided with economic development until the 2008 crisis (Figure C1.1) (INEbase 2024a).
FIGURE C1.1. Resident population in Spain. Millions
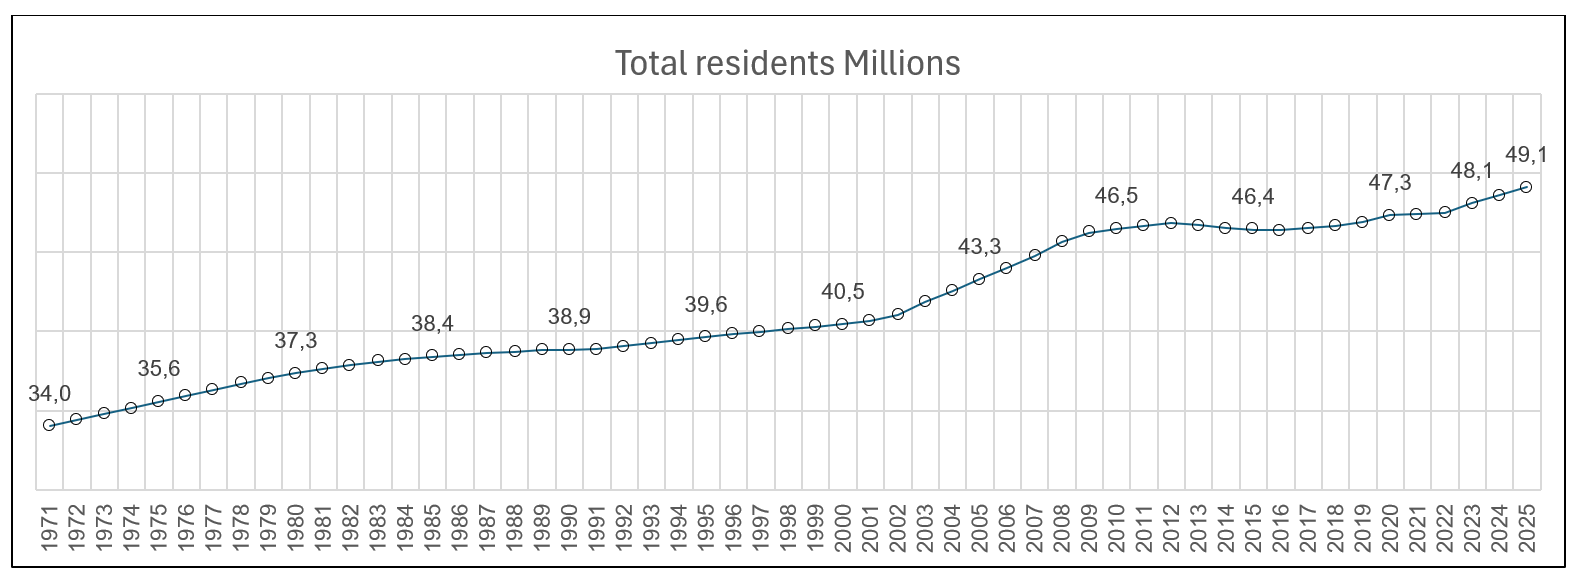
Source: Instituto Nacional de Estadística. INEbase
Since 2010, the number of residents decreased slightly, mainly due to the fall in the number of foreigners, 2.6 million fewer, to 11.3% in 2015. From this date, the number of residents recovered to 49.1 million in 2025, thanks mainly to the new increase in the number of foreigners, which recovered 1.9 percentage points between 2015 and 2023. It can be concluded that the evolution of the Spanish population has been stimulated by economic development and that the economy has been favored by the increase in the foreign population residing in Spain
Given these figures, it is worth considering the evolution of the birth rate in Spain, according to the nationality of the mother, Spanish/foreign, which is shown in Table C1.2 (Appendix). In 2023, there were 6.61 births per 1000 inhabitants in Spain, compared to 18.70 in 1975; the current Spanish rate is among the lowest in the world, together with those of Italy and Japan. The arrival of immigrants to Spain, which has increased notably since the beginning of the 21st century, with a current birth rate of foreign resident families of 12.35, has moderated the constant fall in the national total and doubles that of Spanish resident families (5.76) (INEbase, 2024b).
Something similar occurs with the fertility rate (number of children
per woman aged 15-49), which in Spain was 1.16 in 2022, compared to the
OECD average of 1.5: "below the "replacement level" of
2.1 children per woman", which "could have important
implications for economic growth and prosperity". (OECD,
2024a).
C2 Gross Domestic Product (GDP) per capita
GDP per capita calculated in current prices has risen in Spain from 400 euros in 1970 to 30,968 euros in 2023. (Figure C2.1). (Prados de la Escosura, L. (2021) and INEbase, 2024c). It is a very synthetic indicator of the macroeconomic development of a country, which does not provide information on the particular prosperity of its inhabitants, but it does provide an overview of the vigor of the growth or crises of a country´s economy and allows a comparative view with other countries, i.e. a view with very useful benchmarks.
FIGURE C2.1. GDP per capita. Current prices. Thousands of euros
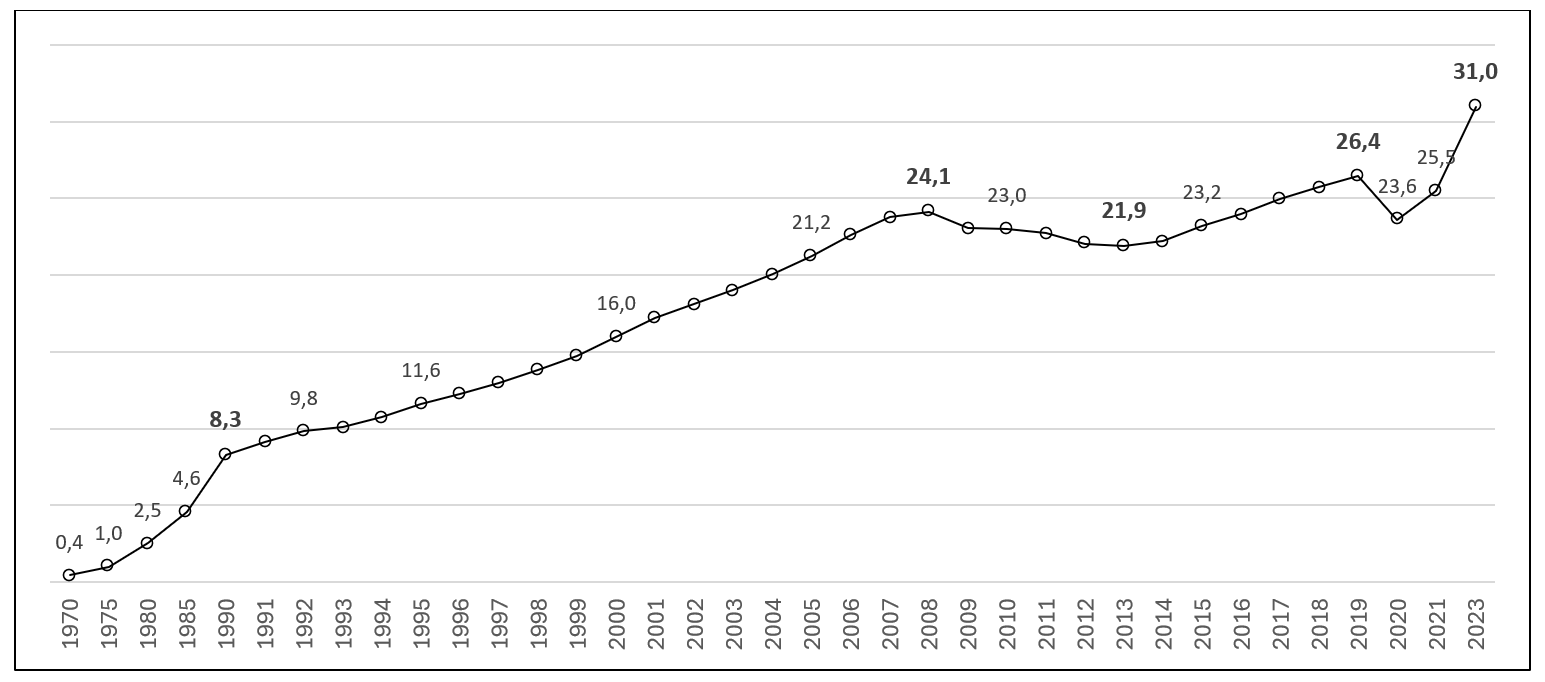
Sources: from 1970 to 2000: Prados de la Escosura, L. (2021). From 2000 to 2023: Instituto Nacional de Estadística. INEbase (2024c)
The values are presented by five-year period from 1970 to 1990 and then the labels of values corresponding to the years of change in trend up to 2023. GDP per capita growth was remarkable between 1970 and 2008 (24,100 euros per capita). The economic crisis of 2008 led to a fall in GDP by more than 2000 euros per capita to 21,900 in 2013. A recovery follows until 2019 and a new drop in 2020 (23,600) due to COVID 19. From 2020 to 2023, there is a new increase until the last available data in 2023, 31,000 euros per capita.
Figure C2.2 (Annex) shows a selection of data from the World Bank Open Data (2023), corresponding to 2021, including some of the main Western economies and those of our environment. GDP is presented measured in current international dollars, converted using PPP (Purchasing Power Parity). The Spanish figure, 40,592, is clearly lower than those of the economic powers (USA, Germany, UK, France...), close to those of Japan and Italy, and slightly higher than those of Portugal and other European countries.
Financing, expenditure per student and average number of students per teacher
F1 Public expenditure on education and expenditure per pupil
Expenditure as a % of GDP offers a very general view, but it is a good indicator of the economic effort that societies are willing to make in favor of their education. The analysis of the historical evolution of this indicator in Spain offers an approximation of this investment effort.
In 1970, Spanish public spending on education reached 2.3% of GDP, a modest figure in comparison with those of the countries around us (Antón, V., Burgos, J., Coll, P., 1992). Between 1970 and 1995, spending doubled, reaching 4.66% in 1995; a remarkable increase in those 25 years, with different growth rates (Figure F1.1)
FIGURE F1.1. Evolution of public spending on education as a percentage of GDP. Spain
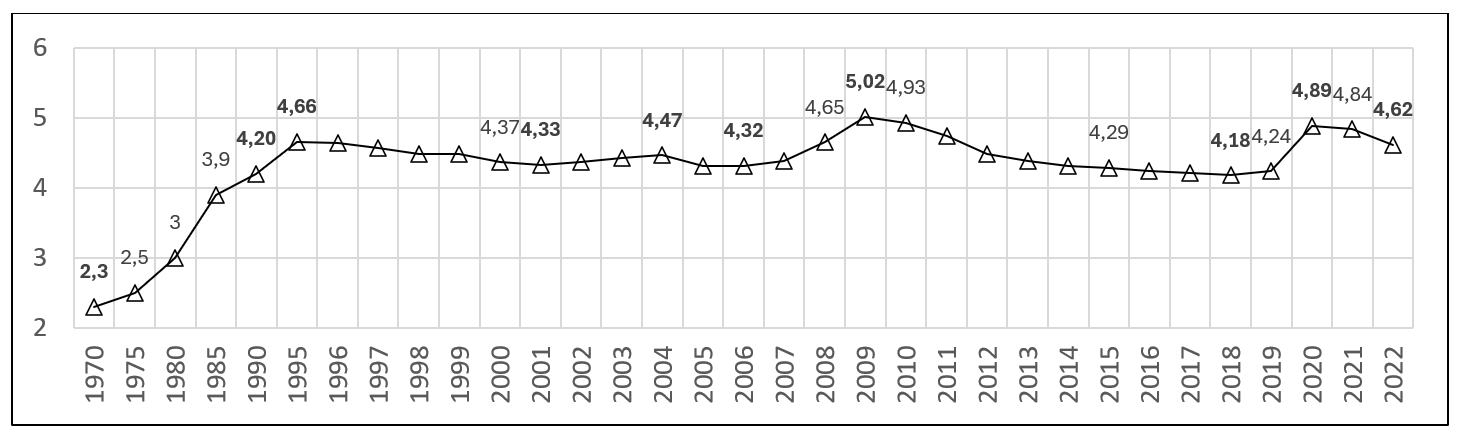
Sources: 1970 to 1985 Antón, V., Burgos, J, Coll, P. (1992).
From 1990 to 2022, MEFP. Educa base (2024b). Subdirección General de Estadística y Estudios del MEFPD.
From 1995 to 2006 (4.32%) the previous trend was broken and public spending decreased with slight variations; it recovered between 2006 and 2009 (5.02%), the historical maximum. It decreased again until 2018 (4.18%), grew until 2020 (4.89%), second maximum, to finally drop again to 4.62% in 2022 (MEFP Educa base (2024b). Political changes in the responsibility for education and the economic and COVID crises probably explain these rises and falls since 1995, which leave the final figure in 2022 equal to that of 1995 after these 27 years have elapsed (MEFPD Educa base, 2024b).
The Spanish figures for public spending on education are far from those of countries (World Bank Group, 2024) such as Sweden (6.7%), USA (5.6%), UK (5.4%), France (5.2%) and the Netherlands (5.1%). Around the Spanish figures are those of Portugal (4.6%), Canada (4.6%) and Germany (4.5). Finally, the figures for Italy (4.0%) and Japan (3.5%) are lower.
F1.2 Expenditure per student in public educational institutions as a percentage of GDP per capita (F.1.2, Annex)
In 2021, spending per pupil as a percentage of GDP per capita in Spain was 30.6%, higher than the European average and that of countries such as France, Germany, Italy and Portugal, which are around 27% (Eurostat, 2024c). When considering this indicator, differences due to the dispersion of the school population and population distribution should be taken into account: the more rural the population, the higher the expenditure per pupil.
The material resources (number of educational centers, school furniture and materials, etc.) and human resources (teachers, administrative and service personnel) have grown in Spain since 1970 at the same time as the demand for students in the different educational stages; in addition, schooling conditions have improved notably, both in terms of the number of students per classroom and per teacher, as well as the new plans and curricula, as discussed in the different articles in this monographic issue, which include some of the selected indicators.
P1 Average number of students per teacher
A very notable proportion of the investment in education is dedicated to personnel, 62.4% in 2022. (MEFPD Educa base, 2024b). Only two indicators are addressed in this section:
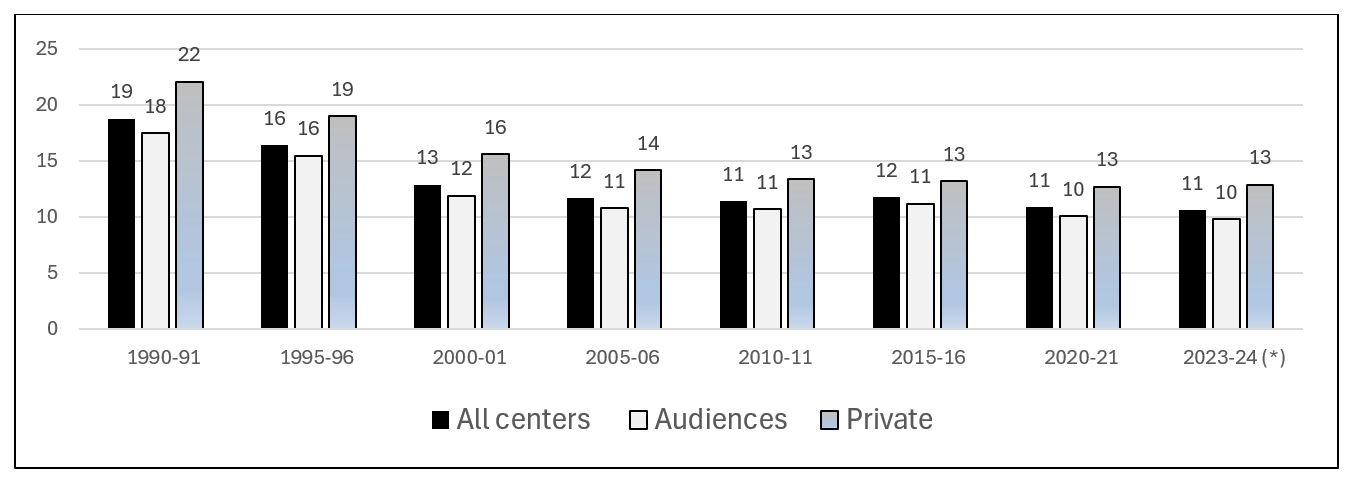
Figure P1 shows the evolution of the average number of students per teacher in General Education MEFPD Educa base, 2024c); in 1990, the average was 19 students per teacher and dropped to 11 in 2010, a figure that has been maintained until 2023-24. In all the years considered, the average number of students per teacher in private schools exceeds that of public schools by 2-4 points. The analysis of these figures must take into consideration the high distribution of private schools in urban areas and the low distribution in rural and depopulated areas.
FIGURE P1. Average number of students per teacher. 1990-2023
Source: Subdirección General de Estadística y Estudios del Ministerio de Educación, Formación Profesional y Deportes.
P2 Percentage of women out of total faculty members
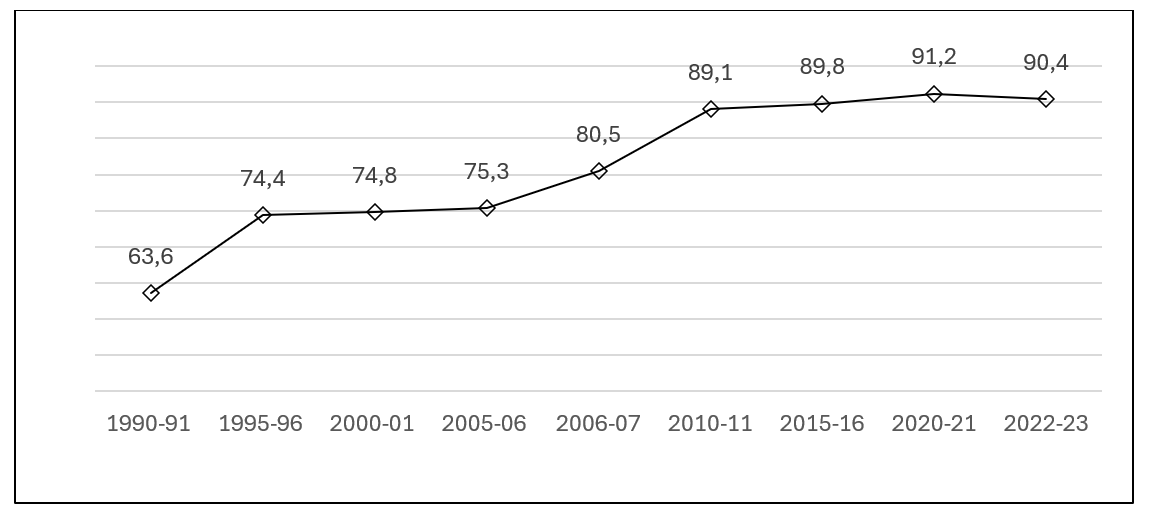
The evolution of the percentage of women with respect to the total faculty went from 62% in 1990-91 to 72% in 2020-21 (Figure P2, Annex) (MEFPD Educa base, 2024d). The percentages of women in 1990 were in private schools three to four percentage points higher than in public schools, but the figures were equalized as of 2010.
School enrolment
E1 The School enrolment of the population from 5 to 14 years of age increased from 75% in 1960 to 83% in 1975 and 89.9% in 1990. During these years, the curricula outlined in the 1950s and the LGE were implemented, with compulsory education from ages 6 to 14.
FIGURE EI. School enrolment of the population aged 5-14 years. 1960-1990
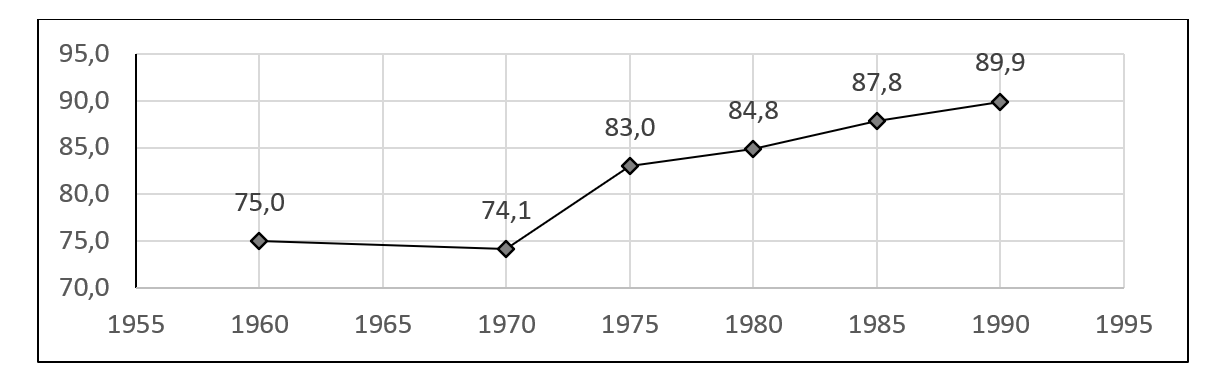
Source: Carreras, A. and Tafunell, X. (2005).
As of 1990, the LOGSE extended compulsory education from 6 to 16 years of age, giving rise to a drive to achieve complete schooling at these ages. Along with this effort, schooling objective was also focused on the non-compulsory stages
E2 School enrolment in early childhood education MEFPD Educa base, 2024e)
In 1990, net schooling rates for 3 to 5 year olds were 75.9% and reached 97% in 2000, a figure that is considered practically full schooling. Schooling at age 2 was very low in the early 1990s; in 1995 it stood at 11.7%. Over the next 20 years it grew markedly until 2015 (57.5%), and declined slightly until 2020. In the course 2023-24 schooling at 2 years of age has reached 73.3%, with a growth of more than 16 percentage points in the last 3 years.
FIGURE E2.1. Net schooling rates for children aged 2 and 3 to 5 years. Spain
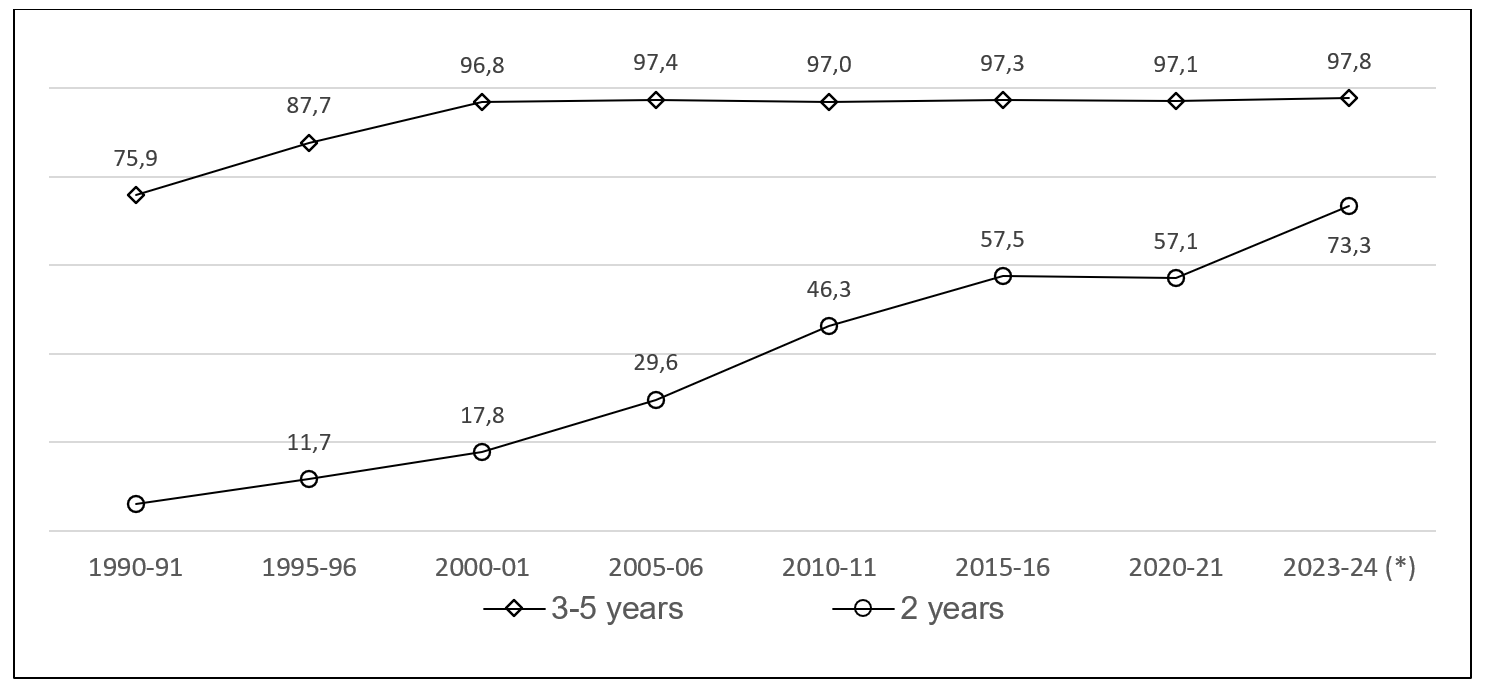
Source: Non-university Education Statistics. Subdirectorate General of Statistics and Studies. MEFPD
The European target for 2030 (European Commission, 2024) proposes
that at least 96% of children between 3 years old and the age at which
compulsory primary education begins should participate in early
childhood education and care.
FIGURE E2.2. Comparison of child schooling in Spain, the OECD and the EU
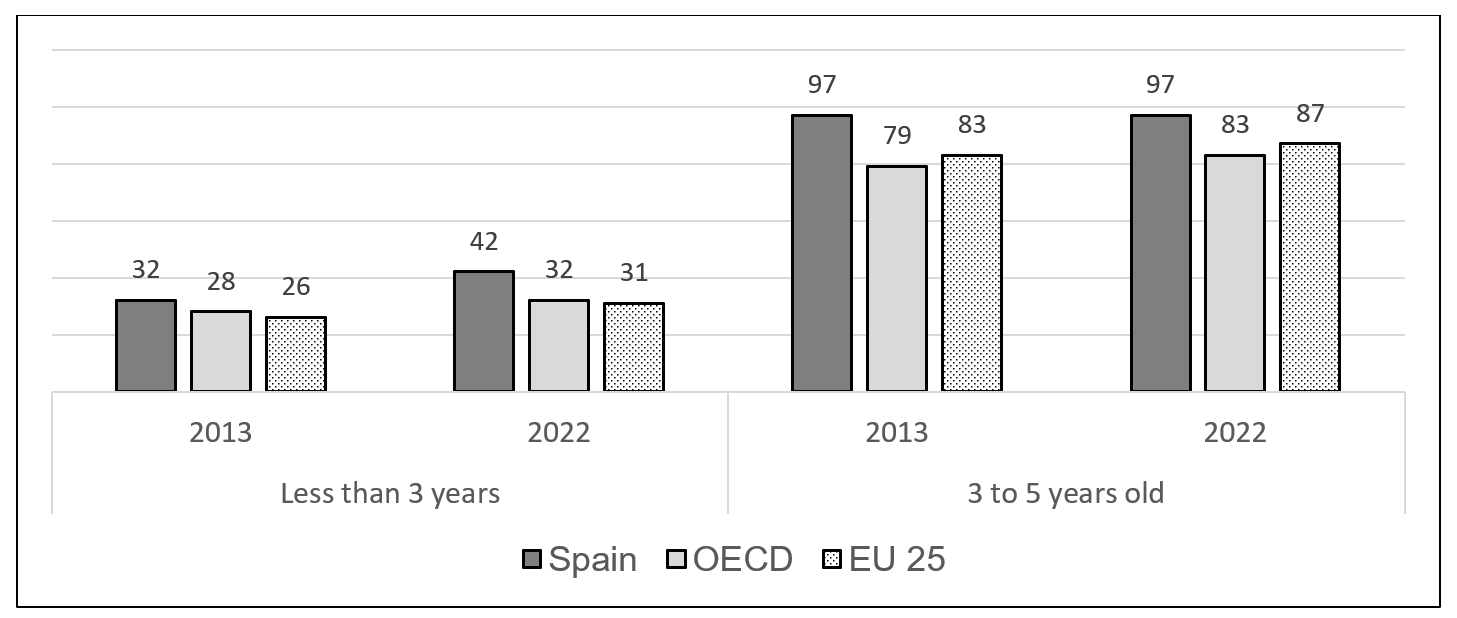
Source: OECD (2024b). Education at a Glance 2024
E3 Upper secondary school enrolment
Between 1960 and 1990, the "gross schooling rate for the population aged 14 to 19 years did not exceed 40% (Carreras, A. and Tafunell, X., 2005) (Figure E3.1, Annex). Between 1990 and 2023, schooling at 17 years of age has evolved as shown in Figure E3.2 (MEFPD Educa base, 2024f).
FIGURE E3.2. Net schooling rate at age 17. Spain
Source: Non-university Education Statistics. Subdirección General de Estadística y Estudios of the MEFPD Educa base.
Level of education attained by the adult population
R.1. Evolution of illiteracy in Spain (
In 1930, 32% of Spaniards were illiterate. The figure was reduced to 23% in 1940, undoubtedly thanks to the efforts of the Second Republic in the creation of schools and the provision of teachers and in spite of the inevitable effect of the War on schooling. The figure continued to decrease in the following decades until it reached 6% in 1981, a figure achieved thanks to the schooling and study plans of the 1950s and the new EGB of 1970, as well as the literacy programs promoted by the Ministry of Education in the 1980s. The difference between the male and female rates also decreased, from 16 percentage points in 1930 to 5 in 1981. Illiteracy among the adult population was progressively reduced in a remarkable way, which undoubtedly meant an important benefit for the people affected and for their families.
FIGURE R1. Illiteracy rate in Spain (%): 1930-1981
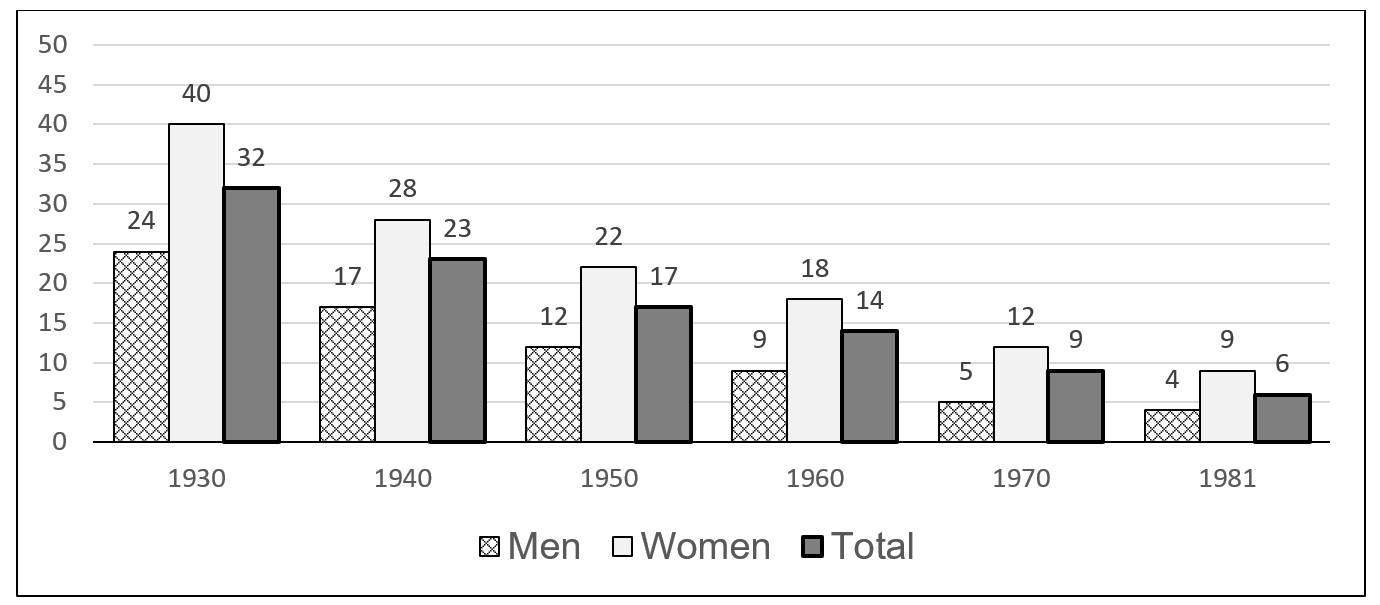
Source: Vilanova, M. and Moreno, X. (1992).
The difference between the male and female rates decreased from 16 percentage points in 1930 to 5 in 1981. Illiteracy among the adult population was reduced in this remarkable way and ceased to be a major educational problem in Spain.
ED Level of education attained by the adult population
This indicator provides information on long-term educational outcomes, but also on the context in which students study, due to the significant influence of the parents´ (and particularly the mother´s) studies.
Figure ED.1 shows the percentages of the educational level of the generations born in Spain in the decades indicated (Carreras, A. and Tafunell, X., 2005). Among those born in 1950, 33% of the population had no education, 46% had primary education, 10% had secondary education and 9% had higher education. In other words, in the 60s of the last century, the young people who finished high school and its revalidation, as well as other intermediate studies, did not exceed 10% of the total population, and these same young people mostly went on to complete higher education.
FIGURE ED1. Educational level of generations born in Spain. 1950-1970 (%)
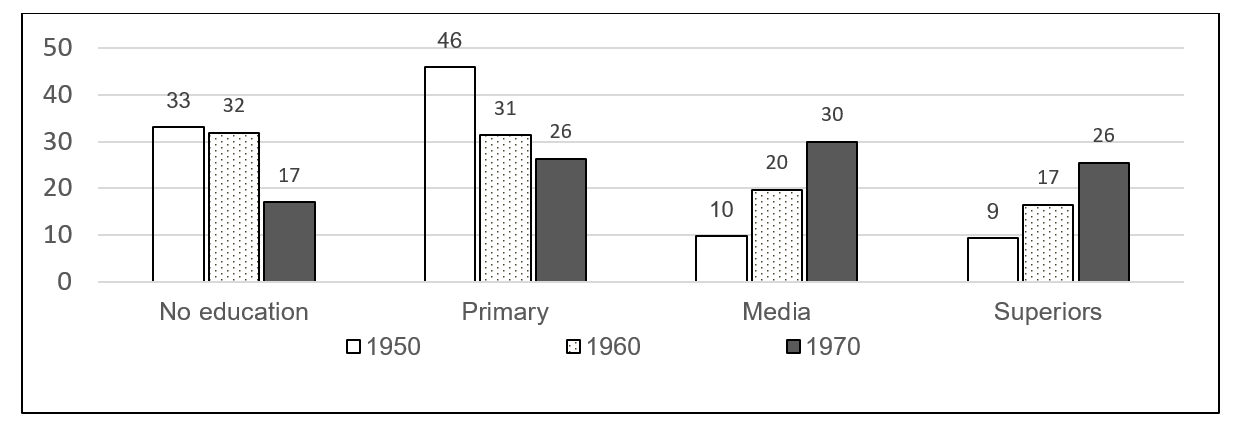
Source: Carreras, A. and Tafunell, X. (2005).
Those born in the 1970s came to enjoy the new LGE curriculum; 30% of young people completed their secondary education and 26% completed their higher education.
The study carried out by the OECD (2011), on the occasion of its 50th anniversary, whose partial results, referring to Spain and 6 other countries in our environment, are shown in Figure ED. 2, provides a good link between these results and those included in the international system of educational indicators. The data in Figure ED.2 refer, first, to the percentage of adults between 55 and 64 years of age, born between 1933 and 1942 who, in 1997, had attained at least upper secondary education (ISCED 3), equivalent to the current baccalaureate and intermediate vocational training. In Spain and Mexico, these adults were 11%; in the United States they were 78%, in Germany 74% and in France 39%. These figures show unequivocally the "backwardness" of Spanish education in the years prior to the LGE of 1970 with respect to that of the most developed Western countries.
FIGURE ED.2. Progress in upper secondary education
attainment (ISCED 3)
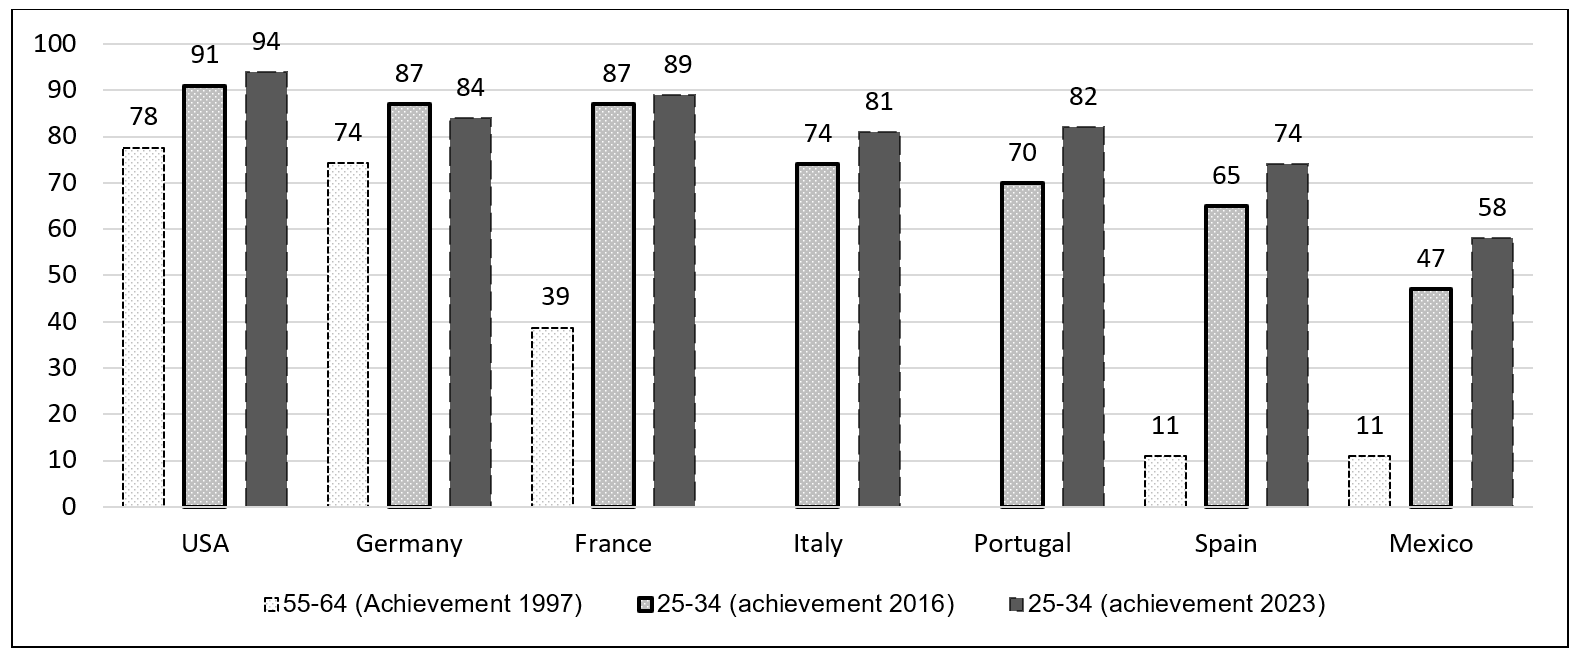
Sources: OECD 2011: Education at a Glance 2011, Education at a Glance 2018 Table A1.2, Education at a Glance 2024. Table A1.2
The situation began to change very noticeably since the approval of the 1970 and 1990 education laws. 65% of young Spaniards born between 1982 and 1991, aged 25-34 years in 2016, reached the upper secondary level of education (OECD, 2018). The figure has reached 74% of young people born between 1989 and 1998, who were between 25 and 34 years old in 2023. Progress has been remarkable, although our adult population with that level of education is currently 7-8 percentage points below Italy and Portugal, 10 points behind Germany, 14 points behind France and 20 points behind the United States.
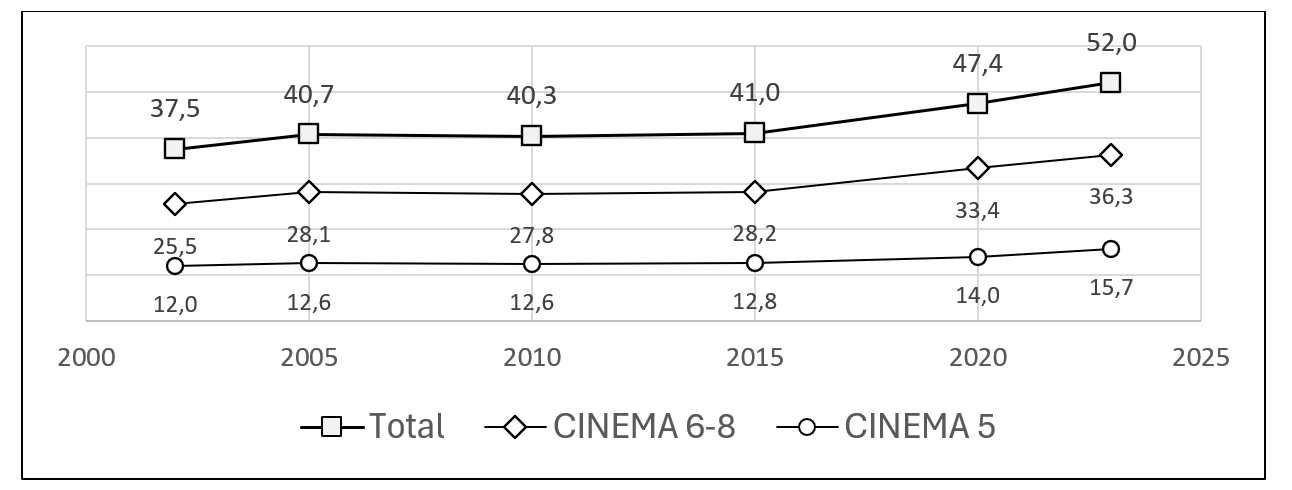
Figure ED.3 plots together the percentages of adults aged 25-64 (populations other than those discussed in the previous figure) who have attained ISCED level 3, ISCED levels 5-8 and the sum total of both percentages (OECD, 2024b). The percentage of Spaniards with ISCED 3, 23%, is half the EU average and 17 points lower than the OECD average. However, the percentage of Spaniards with ISCED 5-8, 41%, is equal to the OECD average and higher than those of the EU, Germany, Portugal and Italy. Thus, the main Spanish difficulty with respect to the levels of education attained by the adult population lies in upper secondary education, ISCED 3, and not in higher education.
FIGURE ED.3. Percentage of adults aged 25-64 with the highest level of education attained. 2023
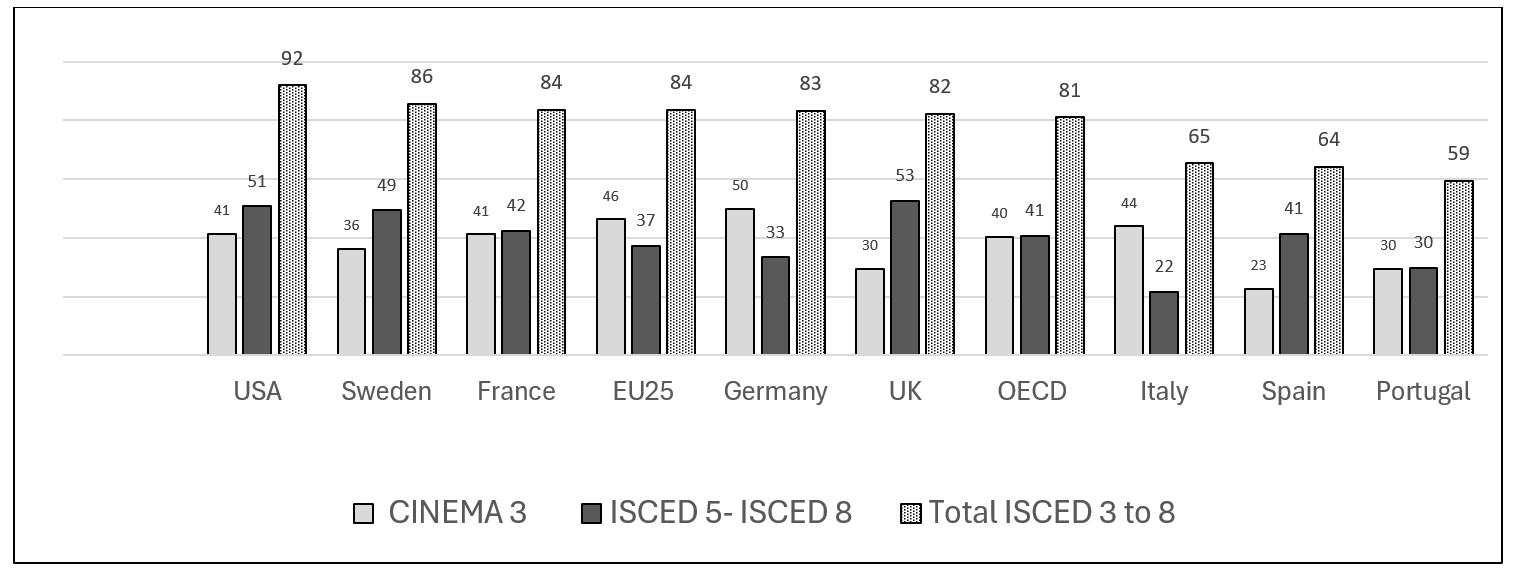
Education at a Glance 2024
Secondary education attainment
The changes introduced by the LGE and the LOGSE in the structures of the educational system, in schooling and in results, aimed at the educational success of all students in compulsory education. These changes led to very significant progress, as shown by the results indicators presented in this section. However, at the same time, courses and stages were approached in practice with a selective character, as evidenced by the high figures for grade repetition, as well as by the also high percentages of students who did not graduate at the end of EGB or ESO
R2 Pupils repeating grades in compulsory education
In making decisions about promotion to the next grade, for most students in compulsory education, a propaedeutic, academic and selective conception of the teaching of areas and subjects, inherited from previous curricula, particularly that of the 1950s (elementary and higher baccalaureate, with its revalidated exams), has been taking precedence. This conception has led to the classification of students, at the end of each year, into passers (success) and repeaters (failure). The implementation of basic competencies in 2006, as proposed by the LOE, did not substantially transform the situation described before 2012.
Grade repetition in primary and secondary school has been and still is high. When students did not pass learning in different subjects, grade repetition has been used as a resource to improve learning, with the purpose of guaranteeing success in the following grades and educational stages. The result is the grade repetition figures shown in Figure R2.1.
In the 1994-95 school year, one out of every five 12-year-old Spanish students had repeated at least once. The percentage of repeaters in primary school fell slightly in the following years and with greater intensity in the last 5 years, to 10% in the 2023 school year. This Spanish figure is much higher than those of countries such as the United Kingdom, the United States, Canada, Sweden, Italy, France and Germany, where in 2018 repetition in primary school was between 1% and 4% (Consejo Escolar del Estado, 2020) (see Figure R2.2 and Figure R2.3 in Annex).
FIGURE R2.1. Percentage of students who have repeated at least once. Spain
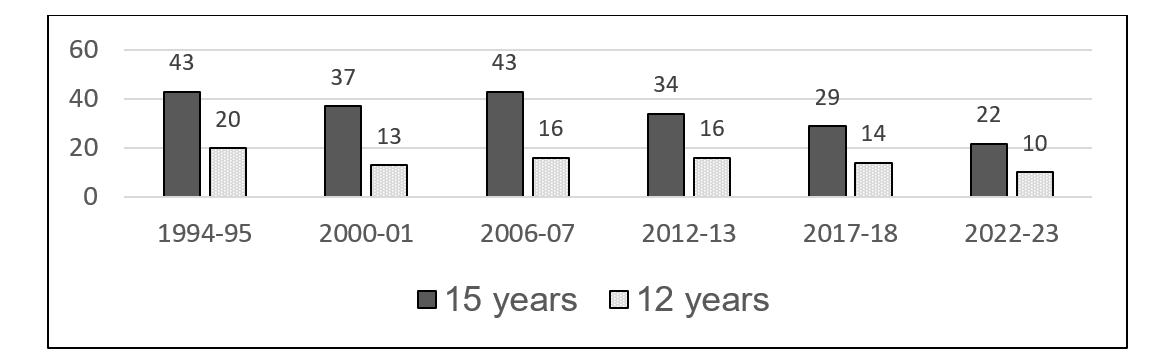
Source: Own elaboration based on Consejo Escolar del Estado (2020) and PISA Reports 2018, 2022.
The percentage of students who have repeated at least once in ESO is practically double that of primary school in all the years considered; it was 43% in 1994-95 and in 2006-07; it progressively decreased to 22% in 2022-23. The international comparison presented in Figure R2.4 (OECD (2023), shows the current situation of repetition in Spain: it is 10 times that of the United Kingdom, 5 times that of Sweden; it is double or higher than repetition in the United States, Italy and France (the latter two countries which, together with Portugal, presented figures as high as those of Spain and which have been drastically reduced in the last decade). PISA has repeatedly stated , from its first report in 2000 to the recent one in 2022, that grade repetition is costly for the country, inefficient for the system and dramatic for the students who suffer from it
FIGURE R2.4. Percentage of students repeating at least once in PISA 2022
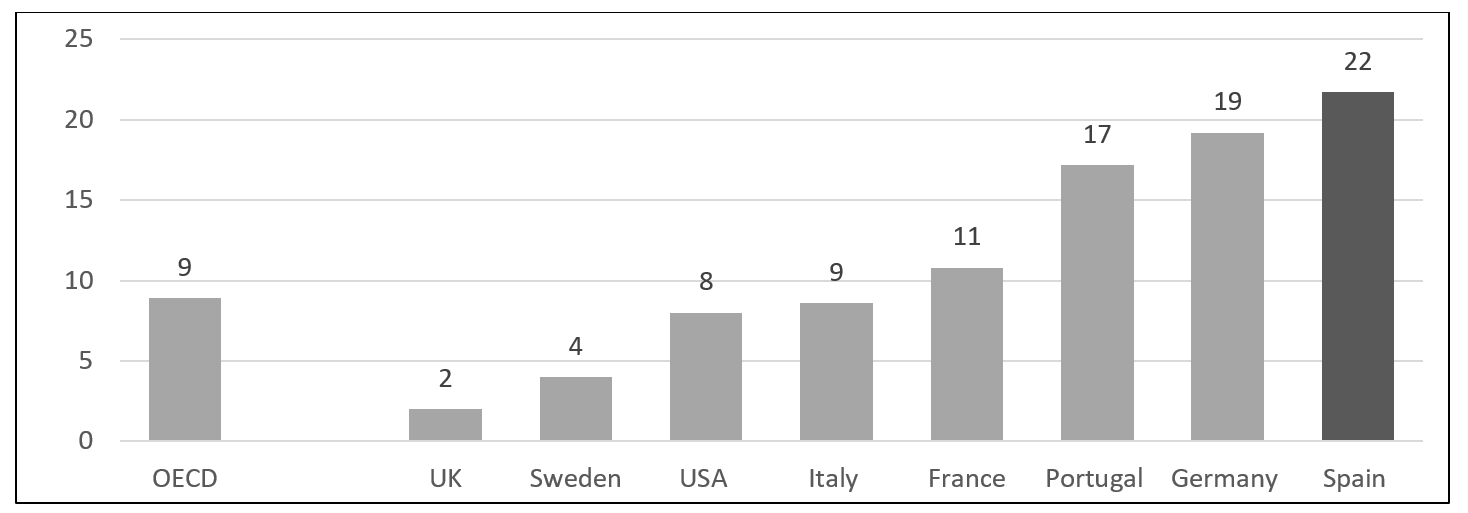
Source: Data prepared from PISA Report (2023), PISA 2022 Results (Volume II): Learning During - and From - Disruption, PISA, OECD Publishing, Paris,
In the last years of the 20th century and the first years of the 21st
century, international institutions, experts and educational leaders
from different countries engaged in a process of reflection on
educational objectives and the importance of education in satisfying
social aspirations for individual, economic and social development. A
new conception of education took shape, first, in the publication of the
Delors Report
Second, the OECD launched
R3 PISA results
The PISA study has been conducted every 3 years since 2000, except
for the last one which was delayed to 2022 because of the pandemic
(OECD, 2023). The definition of competencies and the very varied results
obtained can be found in the successive reports (OECD,
2000-2022).
The most publicized PISA result is the average score (and the
resulting ranking) of the countries, referring to an initial OECD
average that was made equivalent to 500
points
FIGURES R3.1. PISA means scores. Spain and OECD. 2000-2022
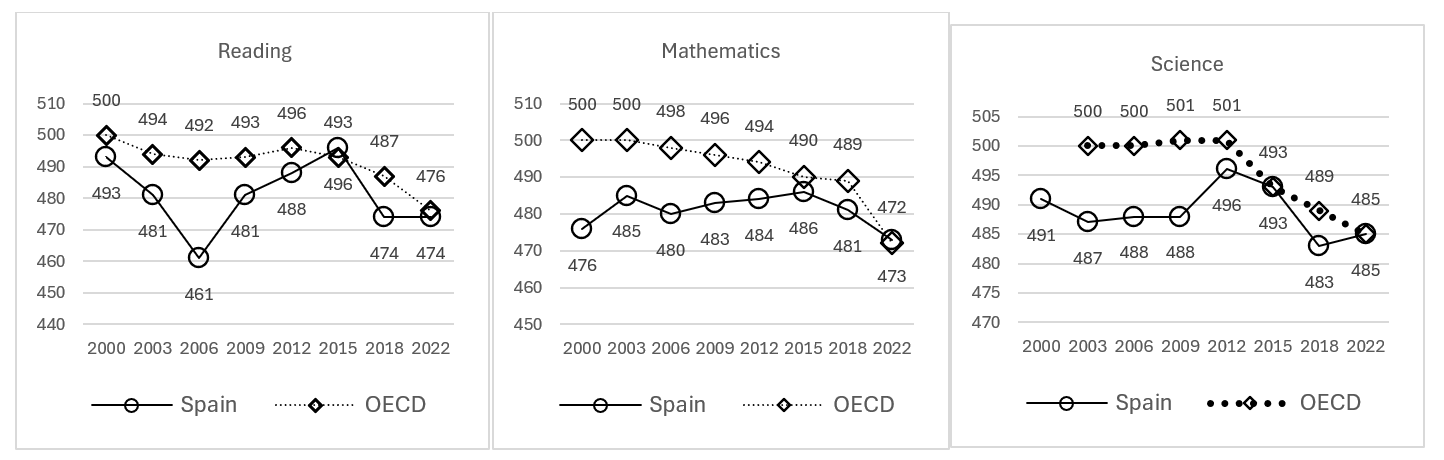
The Spanish results at the lowest performance levels (1 and <1) are also similar to or lower than the OECD average. The percentage of Spanish students at these levels is lower or equal in all three competencies (Figures R.3.2. Appendix). However, the Spanish percentage in the high levels is lower in all cases than that of the OECD. In other words, the Spanish education system is more efficient with students at lower levels, despite the repetition that dominates at those levels, and less efficient, relatively speaking, with students at higher levels.
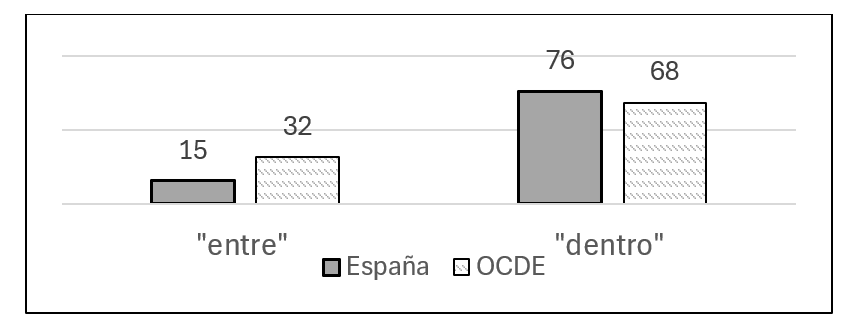
The analysis of variance allows us to assess the dispersion of
student results that occurs "between" and "within"
schools. The variance attributable to the differences in the results of
students from different schools (
In 2022, in the OECD as a whole, the overall variation in student performance between schools (32%) is significantly lower than that within schools (68%). The same is true in Spain: 15% between schools and 76% within schools. Spanish results are similar to those of countries with greater equity.
FIGURE R3.3. Percentage of variance. Differences "between" and "within" centers. 2022
In addition, half of the difference between schools in Spain is attributable to differences in students´ social, economic and cultural status (ISEC). The average ISEC of the OECD countries as a whole is 0.0; the ISEC of the EU is -0.04 (very slightly below the average) and that of Spain is 0.03, slightly higher than that of the EU and the OECD average. This Spanish value has risen notably in the last 20 years: the Spanish ISEC figure was, in 2009, 0.3. This signifies Spanish socioeconomic and cultural progress, which is a good index of the improvement in the learning environment enjoyed by students (MEFPD, 2023a).
Girls score higher in reading (around 487 points) than boys (around 463). In mathematics, boys score higher (478 points compared to 468 for girls, practically equal averages in Spain, OECD and EU). In science, the differences between boys and girls are small in OECD, EU and Spain. These relative differences have undergone little variation in the different PISA studies (Figure R3.4. Annex).
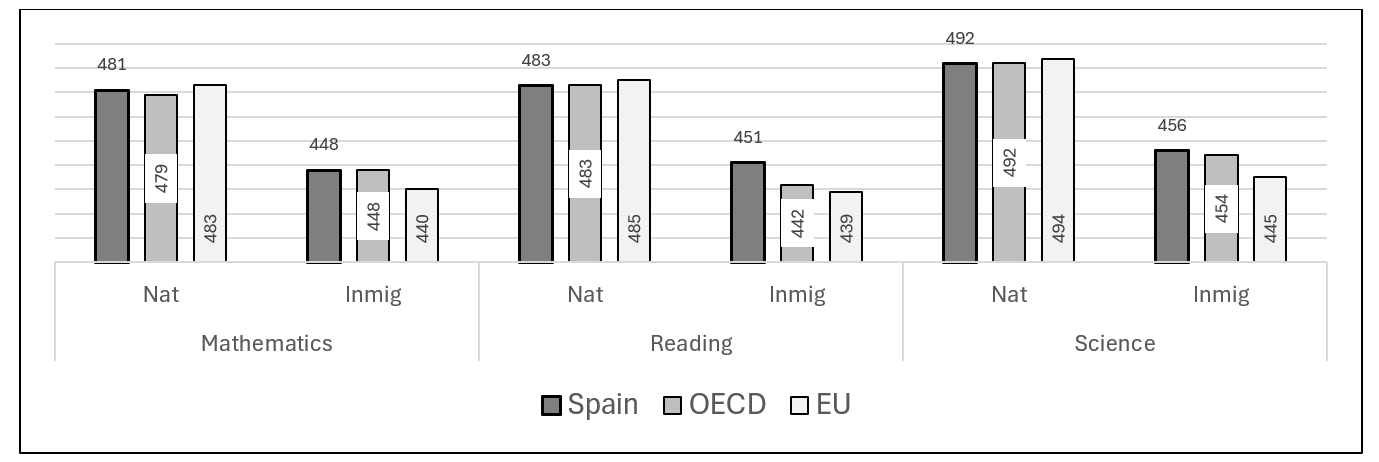
Regarding the results of natives and immigrants, Figure R3.5 shows that Spanish natives have scores that are practically equal in 2022 to the averages of natives in OECD and EU countries in the three competencies. In all cases, these scores are higher than those of immigrants by about 30 points.
FIGURE R2.5. PISA 2022. Native and immigrant differences
R4 Compulsory secondary education graduation (ESO). (ISCED 2)
As has just been mentioned, in the last PISA exercise, Spanish
students scored equal to the averages of the OECD and EU countries.
However, the selective nature of the ESO diploma has been preventing
students who do not obtain it from continuing their studies in upper
secondary, general or professional education, which has contributed to
the so-called "school failure". The reasons for this failure
are very complex, as stated in the Report "
FIGURE R4.1. Gross rate of population completing ESO (ESO Graduation) (percentage)
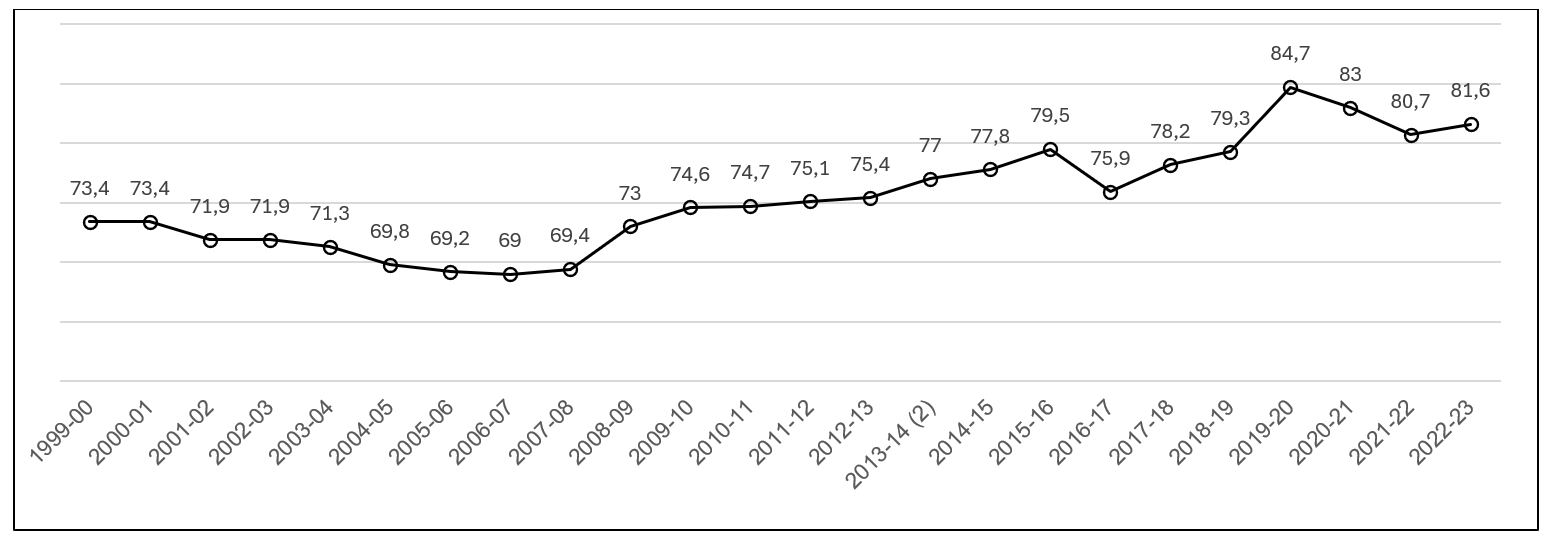
Source: Subdirección General de Estadística y Estudios. MEFPD
In 2000, 73.4% of the student body obtained the ESO graduation at the end of this stage, a figure that dropped to 60% in 2006-07. It rose to 79.5 in 2015-16 and, after a decline of 3.6 percentage points in 2016-17, increased to 84.7% in 2020. It is complex to attribute the declines observed in the series to economic crises or policy changes by different governments, although the decline from 2000 to 2006 is eloquent; perhaps more evident is the effect of COVID on the decline that brought the rate to around 81%. In any case, practically one out of every 5 Spanish students was not able to continue with high school or professional studies in recent years because they did not reach the ESO degree at the expected age (MEFPD, 2023b).
The Spanish figure of ESO graduates in 2023 corresponds to quite diverse percentages of graduates in the autonomous communities and cities, ranging from 64% in Ceuta to 87% in the Basque Country (Figure R.4.2).
FIGURE R4.2. Gross rate of population graduating from ESO. CCAA. Percentage of students. 2023
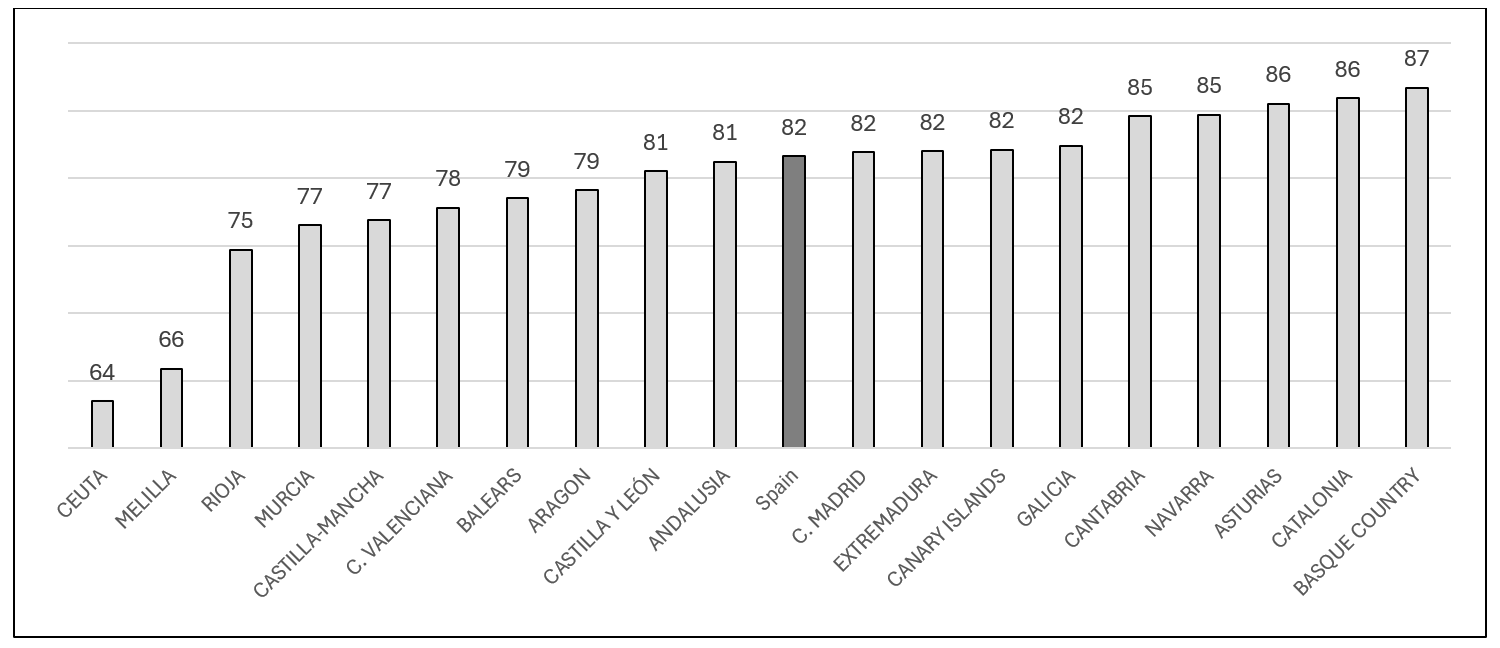
Source: Subdirección General de Estadística y Estudios. MEFPD
In most Western countries, there has been a shift from initial selective approaches, similar to Spain´s, to a firm intention to extend education effectively to all citizens up to the age of 18, as indicated by the European target of bringing the early dropout rate below 10%.
R5 Early leavers from education and training
Reducing early school leaving was one of the main objectives of the
EU since 2003 (
Figure R5.1 shows the official figures provided by Eurostat (2024d). Spain had one of the highest dropout rates in 1992 (40.4%), together with Italy and Portugal. The Spanish figure fell to 31.0% in 2005 and to 13.7% in 2023. The decrease has been very notable over the last 18 years, but it has not reached the figures of the two neighboring countries mentioned above, particularly those of Portugal, which has gone from 38.5% in 2005 to 8.1% in 2023.
FIGURE R5.1. Trends in early school leaving. Spain, the EU and selected countries.
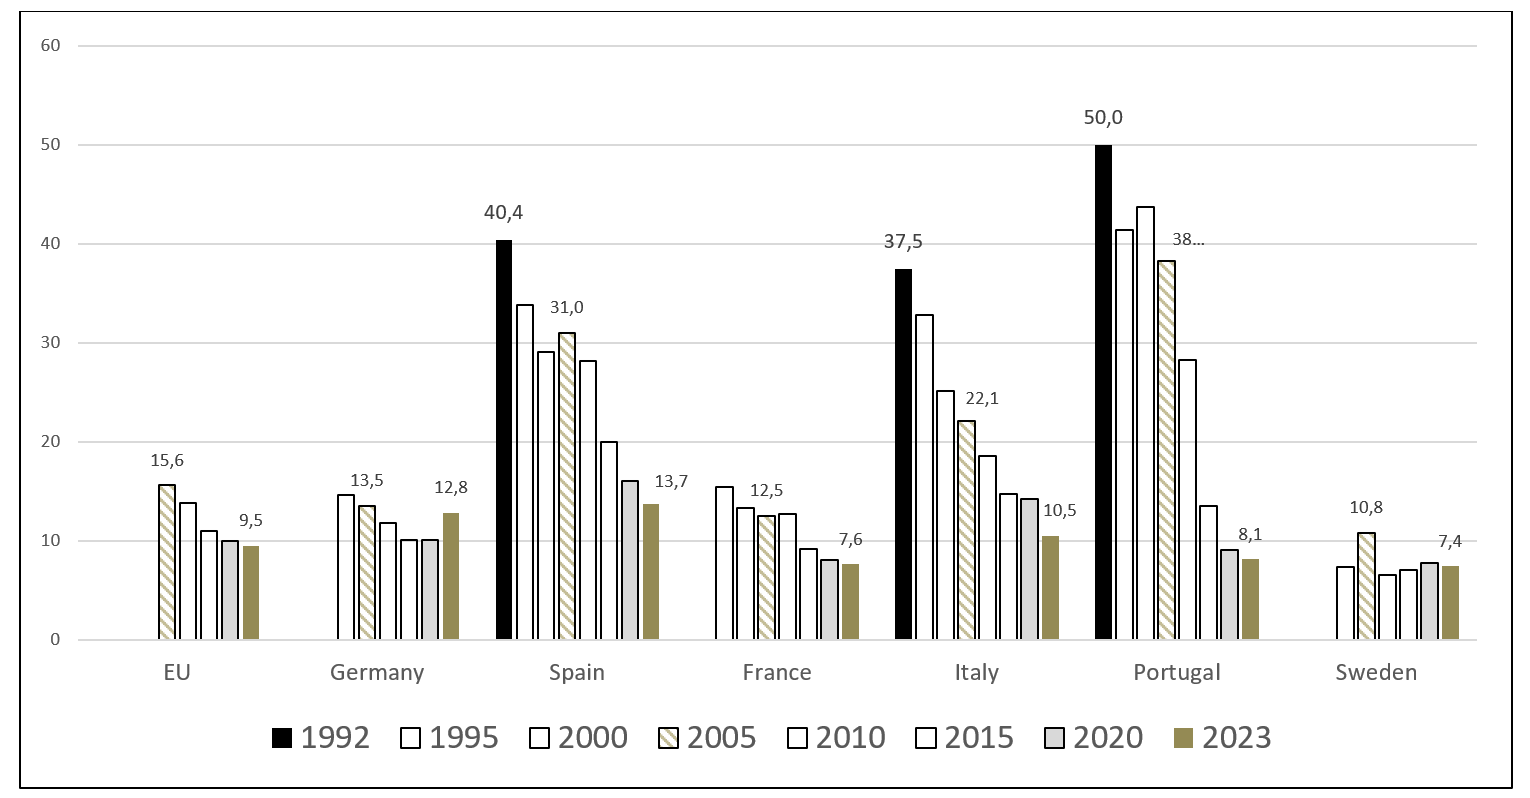
Source: Eurostat. Early leavers from education and training by sex and labour status. Data extracted on 04/12/2024
It is also worth highlighting the decisive influence of the mothers´ level of studies on early dropout, as shown in Figure R5.2. In 2013, 41.3% of Spanish students whose mothers only had primary education did not continue studying; this figure dropped to 34.1% in 2023. If the mothers had higher education, early dropout was 4.3% in 2013 and 2.4% in 2023. For this reason, the importance of the studies attained by the adult population in explaining educational success in adolescents and young people has been emphasized.
FIGURE R5.2. Early leavers by mother´s level of education. Spain. 2022
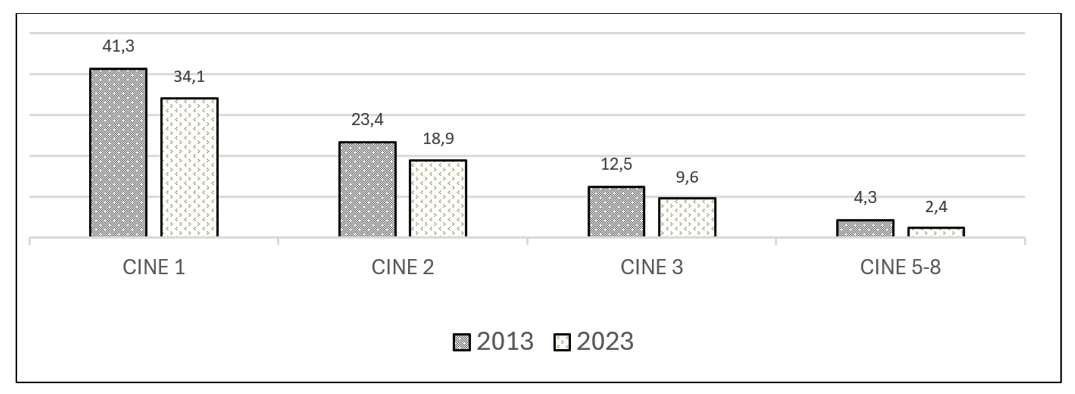
Source: OECD 2023. PISA 2022
This article has already reiterated the importance of repetition and the difficulties of graduation from ESO. However, it is essential to point out that some Autonomous Communities, with the same state legislative measures, have achieved early school dropout rates below the initial European target: the Basque Country (6.7%) and Cantabria (7.3%), Galicia (9.1%), Rioja (9.7%) and Extremadura (9.9%).
FIGURE R5.3. Early leavers from education-training. CCAA. 2023
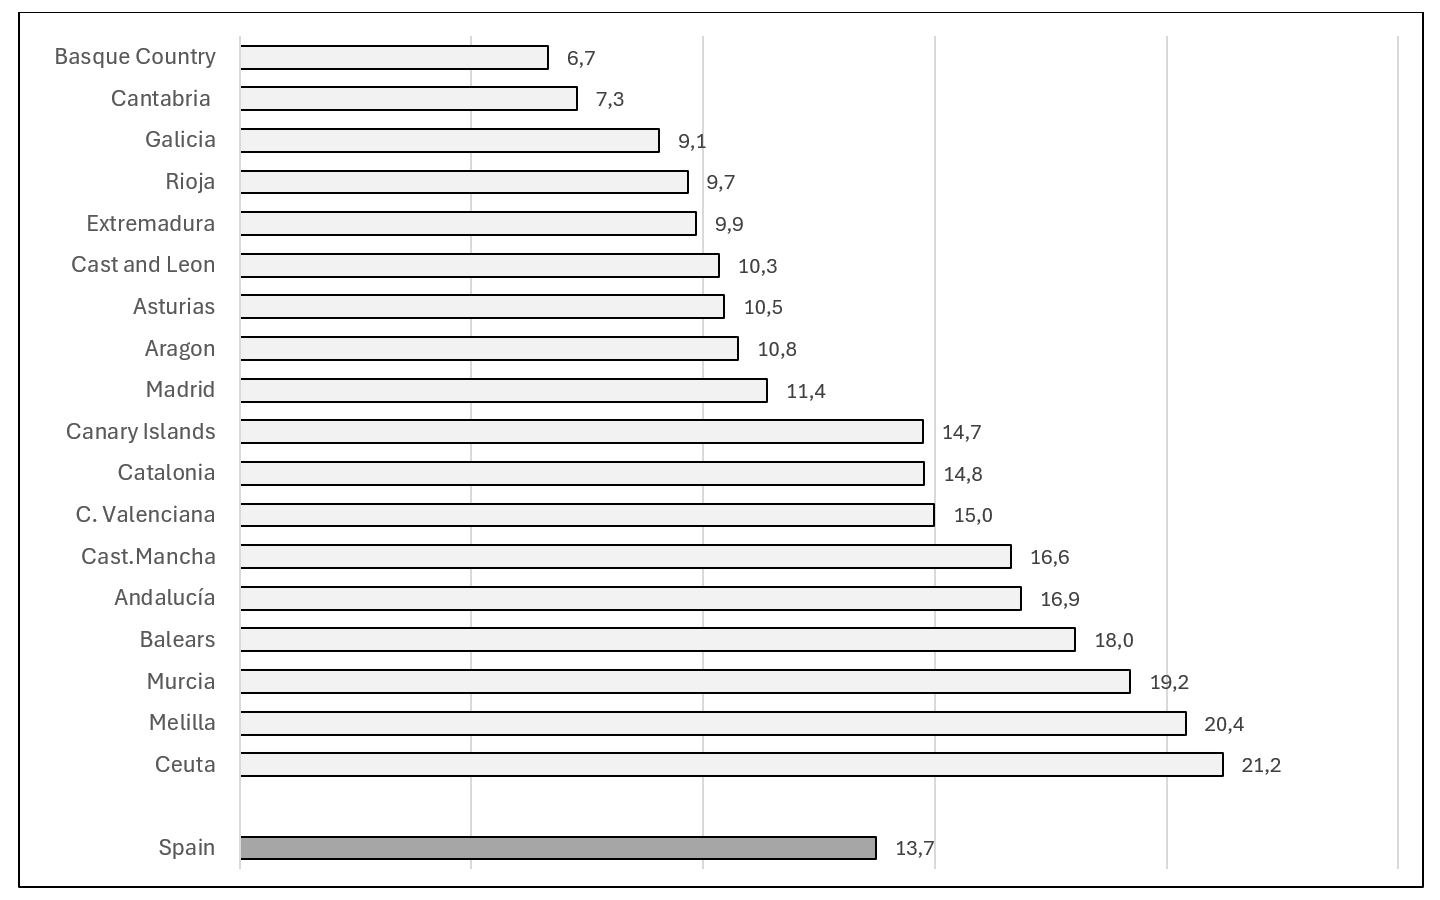
Source: Encuesta de Población Activa. I.N.E. Calculado con la metodología establecida por Eurostat
https://ec.europa.eu/eurostat/web/lfs/publications
At the opposite extreme, the two autonomous cities exceed 20% and seven autonomous communities are between 14% and 20%.
% and seven autonomous communities are between 14% and 20%.Educational outcomes in upper secondary education and in higher education
The figures for the gross graduation rates in Baccalaureate, Middle
Level VET
The high school graduation rate went from 33.1% in 1990-91 to 46.8% in 2000-2001. Between 2000 and 2005 there was a change in trend, which lowered the rate to 44.8%. From 2005-06 the growth returns until 2015-16, when the Baccalaureate degree rate reached 57.7%. In 2015 it dropped slightly to 55.5% and in 2020-21 the figure was very similar to that of the following academic year. It should be noted that throughout the period there is a difference in favor of the rate achieved by women: 8.5 percentage points higher than that of men in 1990-91 and 15 points in 2020-22.
FIGURE R6.1. Gross rate of population graduating from “Bachillerato” (%)
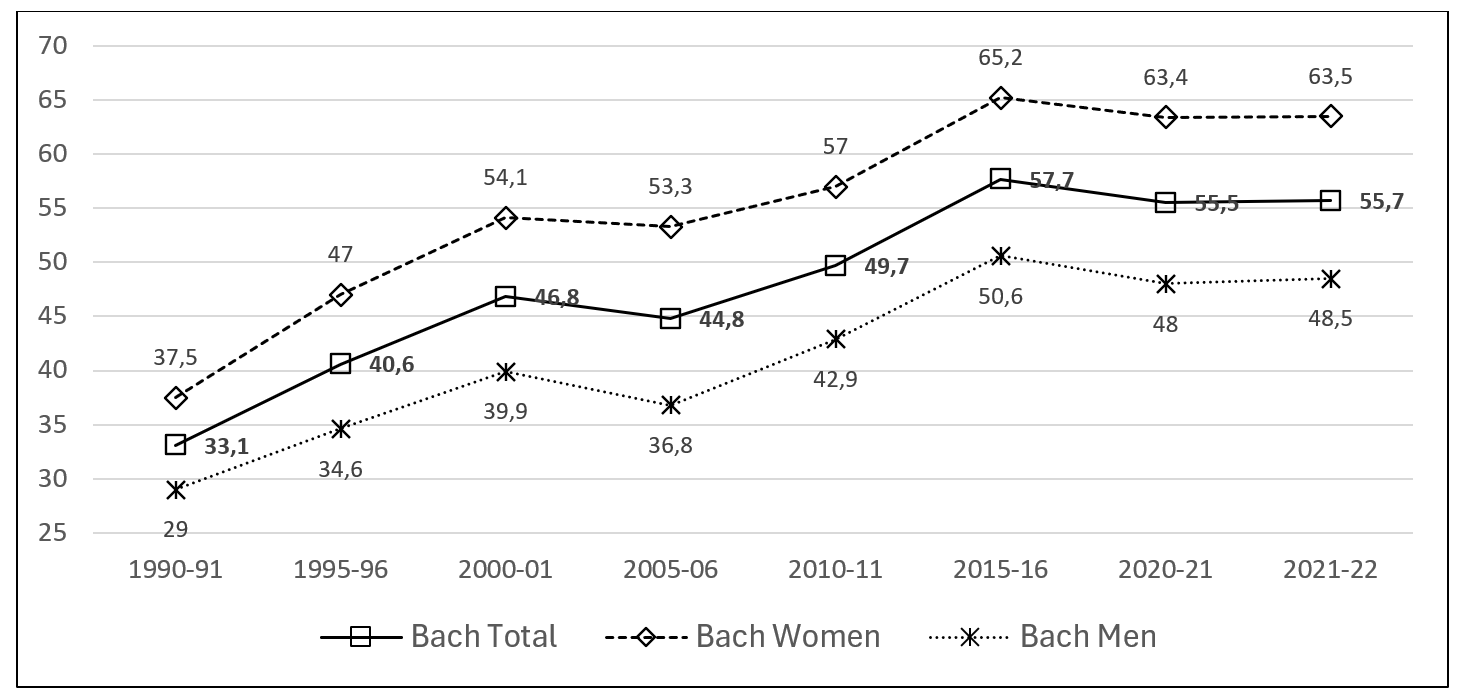
Source: Subdirección General de Estadística y Estudios. MEFPD.
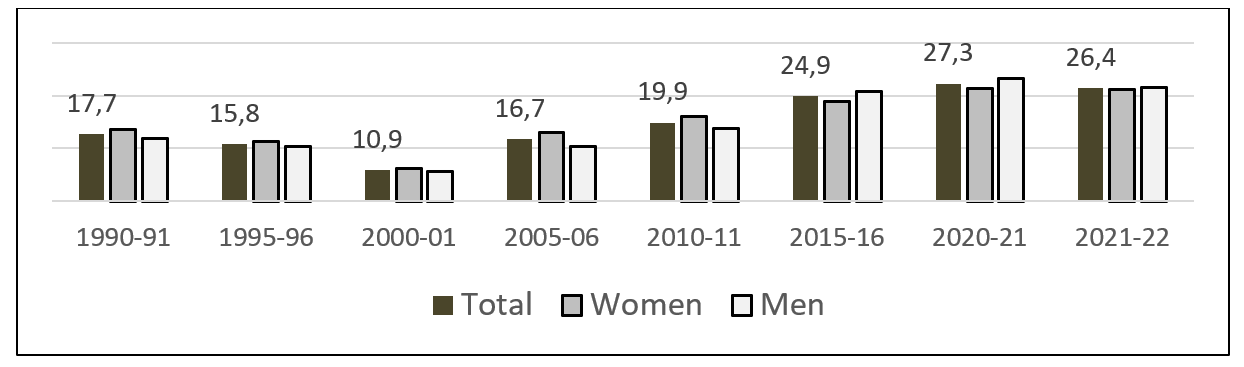
The figures for intermediate vocational training begin with a total
of 17.7% in 1990-91 and drop to 10.9% in 2000-01. It is necessary to
take into account the starting and finishing ages of vocational studies,
which changed significantly between the LGE and LOGSE studies. From
2000-01 onwards, there is a gradual growth in the rates of the new VET
until reaching a value of 27.3% in 2020-21 and a slight decrease in the
last course with available data
FIGURE R6.2. Gross rate of population graduating in intermediate vocational training (%)
Source: Subdirección General de Estadística y Estudios. MEFPD
Graduation rates in Basic Grade VET, starting in the 2015-16 academic year remains between 3 and 4.7% in the six years considered, with a percentage of women almost double that of men.
Thus, although the comparison is not rigorous due to the different statistical measures used, in the last 50 years we have gone in the last 50 years from figures of 30% of graduates in "intermediate studies" to figures which, when adding those of the Baccalaureate, those of Middle Level Vocational Training and those of Basic Level Vocational Training, and discounting duplications, are close to the 74% attainment of the population aged 25-34 years in education ISCED 3 presented above in Figure ED2. The labor force survey (INE) estimates that the population aged 20-29 years that had completed at least the 2nd Stage of Secondary Education in 2023 varied from 89.5% in the Basque Country to 67.1 in Murcia, with a state average of 77.8% (R6-Table 3.1. Annex).
Educational outcomes in upper secondary education and in higher education
The figures for the gross graduation rates in Baccalaureate, Middle
Level VET
The high school graduation rate went from 33.1% in 1990-91 to 46.8% in 2000-2001. Between 2000 and 2005 there was a change in trend, which lowered the rate to 44.8%. From 2005-06 the growth returns until 2015-16, when the Baccalaureate degree rate reached 57.7%. In 2015 it dropped slightly to 55.5% and in 2020-21 the figure was very similar to that of the following academic year. It should be noted that throughout the period there is a difference in favor of the rate achieved by women: 8.5 percentage points higher than that of men in 1990-91 and 15 points in 2020-22.
FIGURE R6.1. Gross rate of population graduating from “Bachillerato” (%)
Source: Subdirección General de Estadística y Estudios. MEFPD.
The figures for intermediate vocational training begin with a total
of 17.7% in 1990-91 and drop to 10.9% in 2000-01. It is necessary to
take into account the starting and finishing ages of vocational studies,
which changed significantly between the LGE and LOGSE studies. From
2000-01 onwards, there is a gradual growth in the rates of the new VET
until reaching a value of 27.3% in 2020-21 and a slight decrease in the
last course with available data
FIGURE R6.2. Gross rate of population graduating in intermediate vocational training (%)
Source: Subdirección General de Estadística y Estudios. MEFPD
Graduation rates in Basic Grade VET, starting in the 2015-16 academic year remains between 3 and 4.7% in the six years considered, with a percentage of women almost double that of men.
Thus, although the comparison is not rigorous due to the different statistical measures used, in the last 50 years we have gone in the last 50 years from figures of 30% of graduates in "intermediate studies" to figures which, when adding those of the Baccalaureate, those of Middle Level Vocational Training and those of Basic Level Vocational Training, and discounting duplications, are close to the 74% attainment of the population aged 25-34 years in education ISCED 3 presented above in Figure ED2. The labor force survey (INE) estimates that the population aged 20-29 years that had completed at least the 2nd Stage of Secondary Education in 2023 varied from 89.5% in the Basque Country to 67.1 in Murcia, with a state average of 77.8% (R6-Table 3.1. Annex).
R7 Population aged 25-34 with higher education grade (ISCED 5-8)
The European target for 2030 establishes that the percentage of
people aged 25-34 with higher education should be at least 45% in
2030
FIGURE R7.1. Evolution of population aged 25-34 with a higher education grade. Spain (ISCED 5 to 8)
Source: Labor Force Survey (INE). MEFPD
The highest percentage of young people with higher education in the EU is that of Ireland; Spain is close to that of the Netherlands and Sweden and above the EU average, Figure R7.2.
FIGURE R7.2. Percentage of 25-34 year-olds with higher education
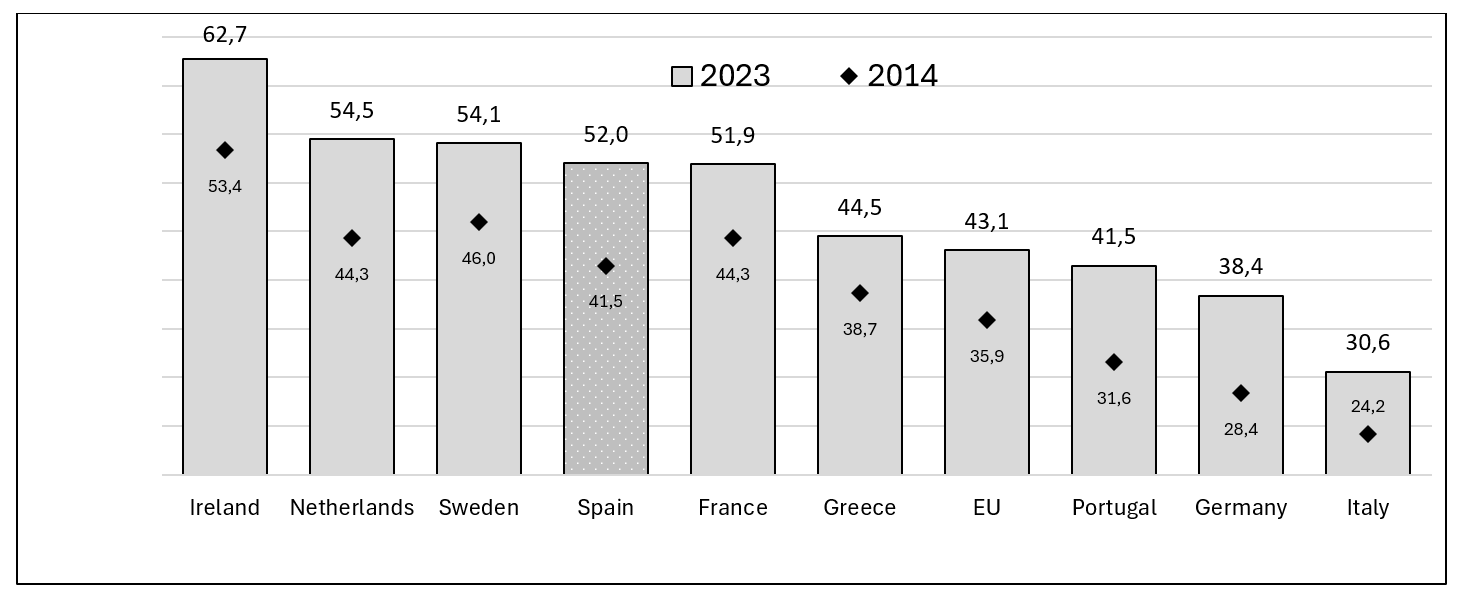
Source: Eurostat (EU Labour Force Survey).
R8 Activity and unemployment rates. Wage indexes
Figure R8.1 presents the activity and unemployment rates. Activity rates are, in the two years considered, lower for young people with only primary education and higher for those with higher education. Unemployment has declined markedly between 2013 and 2023; in the latter year, unemployment affecting young people with only primary education is triple that of those with higher education (MEFPD 2024a).
FIGURE R8.1. Activity and unemployment rates of the population between 25 and 34 years of age, by level of education attained
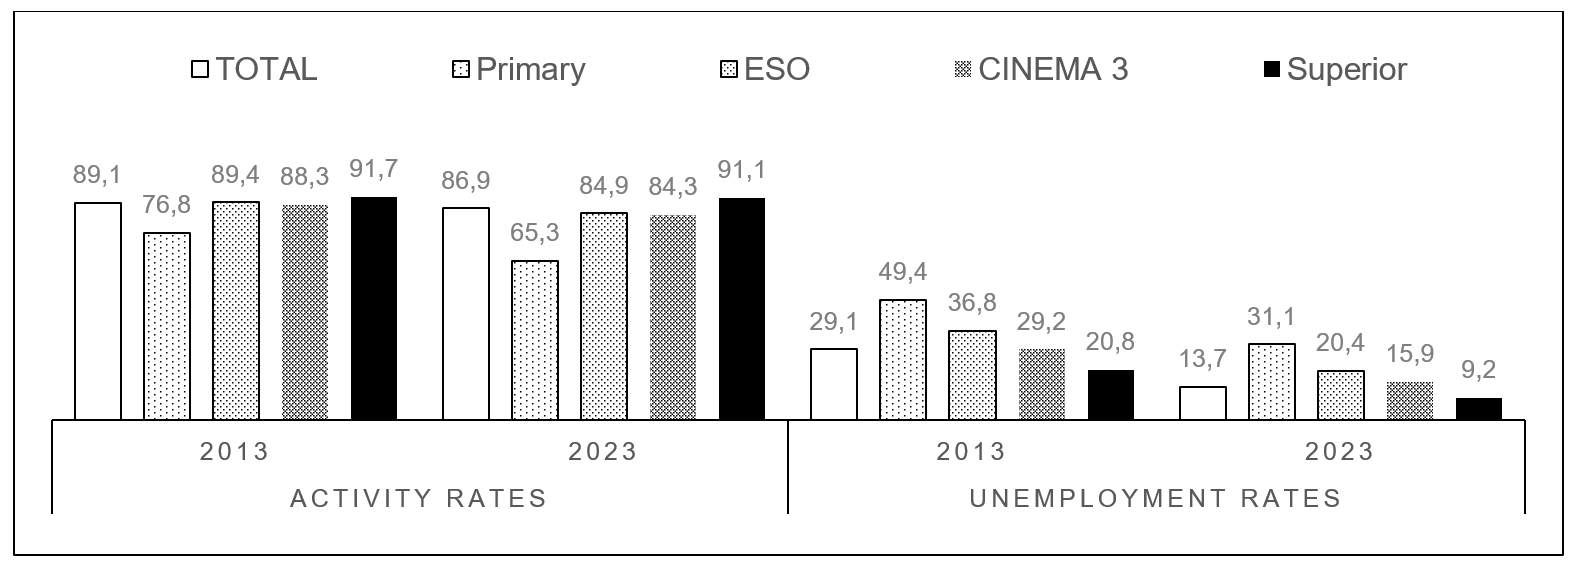
Source: Labor Force Survey. INE.
Figure R8.2 presents the annual salaries, valued on the index 100 that corresponds to the average of the total population and that of wage earners aged 25-34 years. In both populations, the wages of men with higher education (136-114) are higher than those of the rest of men with other levels of education in the two populations considered; and they are also higher than those of all women. The salaries of women with higher education (110-107) are higher than those of the rest of women and men in the two populations without higher education.
FIGURE R8.2. Annual wage indexes, by level of education attained. Year 2022
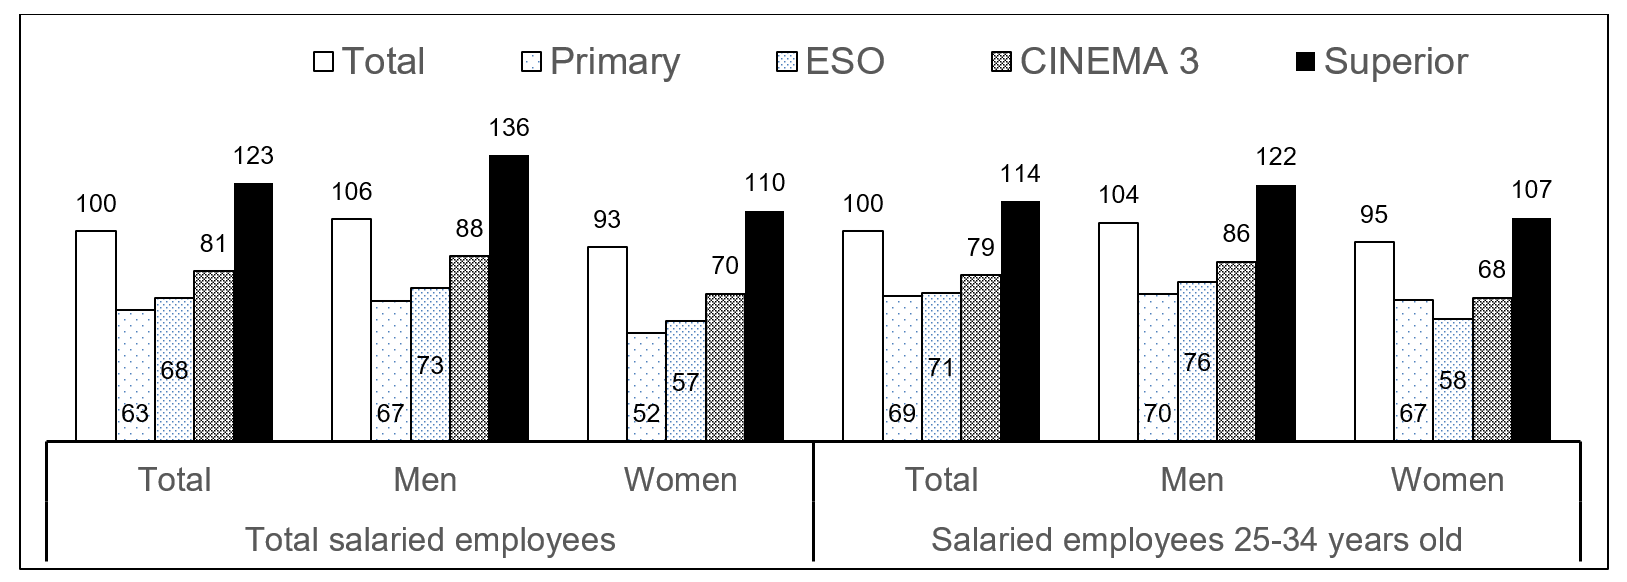
Source: Living Conditions Survey. INE.
Final consideration
The data for these last two indicators, as well as the evolution of the figures for the rest of the selected educational indicators for the years from 1970 to 2025, provide eloquent evidence of the importance of guaranteeing all children, young people and adults, without exception, the necessary resources so that they can achieve the highest level of education in accordance with their abilities and interests. More and better education for all makes it possible to improve the formation of citizens, that is, it provides individual wealth that, once acquired, cannot be alienated, subtracted or exploited for purposes other than the prosperity of the individuals who enjoy it. At the same time, more and better education for all means greater wealth for the societies in which they are integrated, greater human capital; education is truly the "wealth of nations and individuals" in the knowledge society of the 21st century.
Notes
The tables and data corresponding to the selected
indicators can be found in the file Include here the
I would like to thank its Director, Jesús Ibáñez,
for his review and suggestions for the indicators presented
here. The INEE´s State System of Indicators has been
published annually since 2000 and "offers the results of the
main national, regional and international educational
statistics". The figures and tables presented in this article
were prepared by the authors from the sources cited in each
case. In addition to the report for Spain, the
international situation and the corresponding comparison can be
found in the report Society at a Glance (OECD, 2024a) Education and Training Monitor 2021. Council
Resolution 2021 on a strategic framework for European cooperation in
the field of education and training in view of the European
Education Area. The 1997 data correspond to the percentage of
adults aged 55 to 64, born between 1933 and 1942, who had an upper
secondary education in 1997. The 2016 data correspond to the same
attainment of 25-34 year olds, born between 1982 and 1991. Finally,
the data for 2023 correspond to the attainment of young people aged
25 to 34, born between 1989 and 1998. At the same time, the OECD promoted a project
called DeSeCo, which addressed the definition and selection of basic
competencies proposed by this organization (Rychen and Salganik,
2001 and 2003). OECD (2000-2022). Data and graphs in this section
come from our own elaboration based on the OECD PISA Reports and the
corresponding Spanish INEE Reports. Ministry of Education. National Institute for
the Evaluation of Education (INEE). The last published report is for
2022 (MEFPD, 2023a). The study establishes between 5 and 7 levels of
performance in each competency and describes what students scoring
at each level are able to "do". The OECD, EU and most
developed country averages are at level 3. PISA does not describe
what characterizes different scores within a level. Everything related to VET is dealt with in
detail in the article by Clara Sanz in this Monograph. See the article by Clara Sanz in this monograph
for a better understanding of the meaning of these graduation rates
and the differences between the different VET studies, intermediate
and higher, in the different periods corresponding to the different
educational laws. This section does not offer degree rates due to
the complexity and differences between the different degrees. Education and Training Monitor 2021 The data in this and the following figure come
from the publication
References
Antón, V., Burgos, J. y Coll, P. (1992).
Carreras, A. y Tafunell, X. (coords). (2005).
Consejo Escolar del Estado (2020).
Consejo de la Unión Europea. (2003). Council conclusions of
5/6 May 2003 on Reference Levels of European Average Performance in
Education and Training (Benchmarks). 2003/C 134/02.
European Commission (2011). Progress towards the Lisbon objectives in
education and training. Indicators and benchmarks. 2009. Publications
Office.
European Commission (2024) Directorate-General for Education, Youth,
Sport and Culture, Education and training monitor 2024 – Comparative
report, Publications Office of the European Union, 2024.
Eurostat (2024a).
Eurostat (2024b).
Eurostat (2024c).
Eurostat (2024d). Early leavers from education and training by sex
and labour status
INEbase (2024a)
INEbase (2024b).
INEbase (2024c).
MEFPD (2023a).
(MEFPD, 2023b). Enseñanzas no universitarias / resultados académicos
/ series / alumnado que termina los estudios (Cifras absolutas y Tasas
de graduación). Tasa bruta de población que finaliza ESO (Graduado en
ESO) (porcentaje)
MEFPD (2024a).
MEFPD Educa base (2024b).
MEFPD Educa base (2024c). Estadística de las Enseñanzas no
universitarias. Subdirección General de Estadística y Estudios. Número
medio de alumnos por profesor en EE de Régimen General. 1990-2023
MEFPD Educa base, (2024d). Estadística de las Enseñanzas no
universitarias. Subdirección General de Estadística y Estudios.
Porcentaje de profesorado mujeres
MEFPD Educa base, (2024e). Alumnado de E. Infantil por titularidad
del centro, comunidad autónoma y periodo.
MEFPD Educa base, (2024f)
OCDE (2000-2022). Informes PISA (páginas web diferentes para cada edición).
OECD (2011) Education at a Glance 2011. 50 anniversary OECD. Progress
in attainment of upper secondary education over half a century, by
country. Chart 2.
OECD (2018) Education at a Glance 2018: OECD Indicators, OECD
Publishing, Paris.
OECD (2023), PISA 2022 Results (Volume II): Learning During – and
From – Disruption, PISA, OECD Publishing, Paris,
OECD (2024a).
OECD (2024b) Education at a Glance 2024. Tabla A1.2.
Prados de la Escosura, L. (2021).
Roca, E. (2010). El abandono temprano de la educación y la formación
en España.
Roca, E. (2012).
UE (2023)
UNESCO (1996).
UNESCO (2011). Conferencia General, 36ª Reunión. París.
Vilanova, M. y Moreno, X. (1992)
World Bank Open Data (2023)
World Bank Group (2024)
Información de contacto / Contact info: Enrique Roca. E-mail: erc.roca@gmail.com