Key Predictors of School Dropout in Paraguay: A Big Data Analysis
Predictores clave del abandono escolar en Paraguay: Un análisis de datos masivos
https://doi.org/10.4438/1988-592X-RE-2025-409-686
Jorge Daniel Mello-Román
Universidad Nacional de Concepción
https://orcid.org/0000-0003-2821-7538
Ricardo Daniel Escobar-Torres
Universidad Nacional de Concepción
https://orcid.org/0000-0001-8764-6784
Marina Segura
Universidad Complutense de Madrid
https://orcid.org/0000-0002-6068-960x
M. Covadonga de la Iglesia Villasol
Universidad Complutense de Madrid
https://orcid.org/0000-0001-5092-9932
Salvadora Giménez
https://orcid.org/0000-0003-0915-9328
Adolfo Hernández
Universidad Complutense de Madrid
https://orcid.org/0000-0003-1078-2328
Julio César Mello-Román
Universidad Nacional de Concepción
https://orcid.org/0000-0002-3698-4043
Pastor E. Pérez Estigarribia
https://orcid.org/0000-0003-3143-0751
Abstract
School dropout constitutes a structural challenge in Latin America, carrying profound implications for social and economic development. This study examines the factors associated with school dropout in the years preceding the completion of secondary education (known in Paraguay as Educación Media), utilising administrative data from the Registro Único del Estudiante (RUE), the educational data management system of the Ministry of Education and Science, for the period 2017-2023. A quantitative approach was employed, encompassing descriptive analyses and the application of machine learning models to identify dropout patterns and predict dropout risk. The study analyzed 706,785 student records, incorporating sociodemographic, academic, and institutional variables. The findings indicate a significant increase in dropout rates between 2019 and 2020, coinciding with the onset of the COVID-19 pandemic, with notable differences observed across gender, educational pathway, and geographic location, where grade overage and grade repetition emerged as critical determinants of dropout. Students enrolled in night shift and vocational training programs exhibited the highest dropout rates. In predictive terms, LASSO regression demonstrated the best performance, achieving an optimal balance between precision and sensitivity in identifying at-risk students. These results highlight the importance of leveraging extensive data analysis and advanced modelling techniques to strengthen school retention policies and develop evidence-based early intervention strategies. However, challenges remain concerning the quality and comprehensiveness of educational data, the need to explore emerging artificial intelligence methodologies, and the integration of psychosocial and economic factors to achieve a holistic understanding of school dropout and its determinants.
Keywords:
Dropouts, Secondary Education, Socioeconomic Background, Data Science, Predictor Variables
Resumen
El abandono escolar es un problema estructural en América Latina con profundas implicaciones en el desarrollo social y económico. Este estudio analiza los factores asociados al abandono escolar en los años previos a la finalización de la educación secundaria (denominada Educación Media en Paraguay), utilizando datos administrativos del Registro Único del Estudiante (RUE), el sistema de gestión de datos educativos del Ministerio de Educación y Ciencias, durante el período 2017-2023. A través de un enfoque cuantitativo, se realizaron análisis descriptivos y se aplicaron modelos de aprendizaje automático con el objetivo de identificar patrones de abandono escolar y predecir su riesgo. Se examinaron 706.785 registros estudiantiles, considerando variables sociodemográficas, académicas e institucionales. Los resultados evidenciaron un incremento en las tasas de deserción entre 2019 y 2020, coincidiendo con el impacto de la pandemia de COVID-19. Se observaron diferencias significativas según género, especialidad educativa y ubicación geográfica, identificándose la sobreedad y la repetición como factores críticos del abandono escolar. Los estudiantes matriculados en el turno nocturno y en programas de formación profesional presentaron las tasas de deserción más elevadas. En términos predictivos, la regresión LASSO mostró el mejor desempeño, logrando un equilibrio óptimo entre precisión y sensibilidad en la identificación de estudiantes en riesgo. Estos hallazgos subrayan la importancia del análisis de datos masivos y la aplicación de modelos avanzados para fortalecer las políticas de retención escolar y diseñar estrategias de intervención temprana basadas en evidencia. No obstante, persisten desafíos relacionados con la calidad y cobertura de los datos educativos, la necesidad de explorar metodologías emergentes de inteligencia artificial e integrar factores psicosociales y económicos para una comprensión integral de la deserción escolar y sus determinantes.
Palabras clave:
Abandono escolar, Educación secundaria, Nivel socioeconómico, Ciencia y análisis de datos, PredictoresIntroduction
Dropping out of school (also called early school leaving or student dropout) is a complex phenomenon that significantly impacts educational and social development (Zengin, 2021). Globally, millions of students discontinue their studies every year, posing challenges for sustainable development. In Latin America, school dropout rates exceed 30% in some countries, with 41.4% of the working-age population over 15 not completing secondary school (Economic Commission for Latin America and the Caribbean [ECLAC], 2024), a situation exacerbated by the pandemic. In contrast, the European Union has reduced dropout to 9.5 per cent by 2024, although Spain still reports 13 per cent (Eurostat, 2025).
In Paraguay, school dropout has received increasing attention, especially within the framework of the policies of the Ministry of Education and Science (MEC). According to the 2023 Permanent Continuous Household Survey of the National Institute of Statistics (INE, 2024), 98.1% of the population aged 10–14 attended an educational institution, a figure that drops to 71.4% in the 15–19 age group, with lower levels in rural areas (65.5%) compared to urban areas (75.2%).
This study focuses on school dropout during the years prior to the completion of secondary education, a critical stage for human capital development and preparation for the labour market and civic participation. Dropping out at this level has long-lasting consequences: at the individual level, it is associated with higher unemployment rates and lower-quality employment, while at the societal level it perpetuates cycles of poverty and inequality.
The increasing availability of big data and advances in machine learning techniques have proven to be effective tools for predicting dropout and academic performance (Krüger et al., 2023). However, in Latin America, studies evaluating these technologies at pre-tertiary levels are scarce (Rodríguez et al., 2023; Smith and Gutiérrez, 2022), and infrastructure and data quality remain challenges (Hernández-Leal et al., 2021).
Currently, Education Management Information Systems (EMIS) play a crucial role in academic monitoring and data-informed decision-making, although they face challenges of interoperability, quality, and coverage (Arias et al., 2021). Leveraging this massive data offers an opportunity to improve the efficiency of education policies.
In Paraguay, the Registro Único del Estudiante (RUE) is the main data management tool of the education system, developed by the MEC. This relational database, operational since 2017, uniquely identifies each student and tracks their academic trajectory, integrating variables such as academic history, family data, and socio-economic conditions (INE, 2024), although it has limitations in contextual variables.
This study aims to analyse dropout patterns in secondary education (known as Educación Media in Paraguay) using data from the RUE during the period 2017–2023. The following questions are posed: What are the main dropout patterns in secondary education in Paraguay? What sociodemographic and institutional variables critically affect dropout? What analytical and predictive techniques offer the greatest capacity for early identification of at-risk students?
The answer to these questions will generate an evidence-based diagnosis to strengthen school retention policies in Paraguay and contribute to the global debate on reducing educational inequality, providing comparable inputs for other countries and promoting the use of large-scale data in the improvement of education systems and in the formulation of inclusive strategies to ensure student access and retention.
Theoretical Framework
Dropping out of secondary education is a complex phenomenon affecting Latin America and Europe, with social, economic, and cultural implications. Despite some progress, it remains a challenge for both regions (ECLAC, 2024; European Education Area, 2022). It is defined as early school leaving before completing secondary education—a stage which, in Spain, corresponds mainly to post-compulsory education—limiting future prospects and reinforcing cycles of poverty and exclusion. Its explanatory factors are multiple and cumulative, so its prevention requires sustained and personalised interventions depending on the degree of student vulnerability (Khurram et al., 2023; Hernández & Alcaraz, 2018). Ramsdal and Wynn (2022) recommend positive psychology and collaborative work to prevent it, while Nait (2021) highlights the considerable effort required in rural areas.
Explanatory factors for school dropout
Poverty is one of the most relevant factors in Latin America: many students have to drop out of school to work and support their families. In Paraguay, more than 66 per cent of those who drop out do so for economic reasons. Child labour is also prevalent, affecting attendance and performance in children and adolescents. Similar challenges exist in Europe, but social protection systems have helped to mitigate them. Still, in countries such as Spain, the dropout rate reaches 13% in 2024 (Ministry of Education, Vocational Training and Sport [MEFPD], 2025).
Low academic performance and the lack of effective instructional methodologies are another determining factor. In Latin America, outdated curricula and a disconnection from students´ realities lead to demotivation, as they do not respond to their interests, vocations, or cultural contexts. In several countries in the region, including Paraguay, more than half of the 15-year-old population does not reach the minimum level of mathematical problem-solving proficiency (United Nations Educational, Scientific and Cultural Organization [UNESCO], 2022, p. 92).
The family and social environment also has an impact on school dropout. In Latin America, factors such as teenage pregnancy, relationships at an early age, poverty, and child labour significantly affect school retention, especially among adolescent girls. In addition, school dropout is higher among Indigenous and Afro-descendant youth (ECLAC, 2024). In Europe, however, comprehensive sex education has reduced dropout due to pregnancy, except in some migrant communities (European Education Area, 2022).
Institutional characteristics also play a role. In Latin America, significant infrastructure deficits and digital divides persist. In Paraguay, less than 50% of secondary schools have connectivity for pedagogical purposes (UNESCO, 2022, p. 80). This, coupled with the gap between state-funded and private education, favours the latter, with lower dropout rates. Although Europe presents more favourable conditions, disparities between countries and regions persist (Eurostat, 2025).
Consequences of dropping out of school
At the individual level, not completing secondary education limits the possibilities of accessing quality jobs and perpetuates conditions of poverty and exclusion. In Latin America, dropping out of school is linked to child labour and early entry into the informal labour market, which affects the right to quality education and reduces opportunities to exercise full citizenship (ECLAC, 2024).
At the social level, dropping out of school deepens structural inequalities and reinforces the intergenerational cycle of poverty reproduction. In Latin America, while 85% of young people in the highest income quintile complete secondary education, only 44% in the poorest quintile do so (UNESCO, 2022, p. 17). This gap has a direct impact on access to opportunities and places greater demands on social welfare and protection systems, increasing the demand for public support (ECLAC, 2024).
From an economic perspective, early school leaving undermines countries´ productivity and competitiveness. According to ECLAC (2024), each extra year of schooling raises incomes by 7–10%. At the macro level, countries with high dropout rates have lower GDP growth; reducing it by 10% could increase GDP by 0.5% per year. Secondary education provides essential skills to access skilled jobs; those who drop out have fewer opportunities in the formal market, entering precarious and low-paid jobs. In Paraguay, around 60% of young people who drop out of secondary education come from households linked to informal economic activities (Ministry of Education and Science [MEC], 2013, p. 61). While economic growth in Latin America is constrained by high non-regulated labour, in Europe, where school dropout rates are lower, economies have developed technology-based and knowledge-driven sectors (European Education Area, 2022).
Massive data on school dropout studies
The use of big data in education boosts dropout detection and prevention by processing large volumes of data in real time (Amaya-Amaya et al., 2020). Dropout is often preceded by absenteeism or grade repetition (Montero-Sieburth & Turcatti, 2022; Ajjawi et al., 2020). In this regard, the data analytics approach, machine learning techniques, and educational data mining (Flores, 2025; Serrano et al., 2024) have proven effective in detecting dropout, and their accuracy depends on the quality and diversity of the variables (Kocsis & Molnár, 2024).
Variables explaining dropout span personal, socio-economic, academic, and institutional domains (Alyahyan & Düştegör, 2020; Alladatin et al., 2023), and no single factor is decisive. Gutiérrez-de-Rozas et al. (2023) highlight academic-vocational orientation and personal aspects as triggers, while Zapata-Medina et al. (2024) and others find that academic variables tend to be the most predictive (Segura et al., 2022; Ortiz-Lozano et al., 2023). In Paraguay, Insfrán-Coronel et al. (2024) identify the critical role of poverty and child labour. Similarly, Abideen et al. (2023), together with Venkatesan and Mappillairaju (2023), corroborate the importance of data mining techniques to locate high-incidence areas, guiding more effective interventions.
Currently, most studies on big data and predictive models of dropout focus on higher education, with a significant gap regarding their implementation at earlier educational levels (Rodríguez et al., 2023; Smith & Gutiérrez, 2022). Ensemble methods, such as Random Forest, stand out for their predictive efficiency, while techniques such as logistic regression continue to be used for their interpretability. More complex models, such as neural networks, are less common (Venkatesan & Mappillairaju, 2023). In Latin America, the lack of structured and accessible data still limits their implementation, along with technological, quality, and coverage-related constraints (Hernández-Leal et al., 2021; Arias et al., 2021).
Method
-
Data processing
A general review of the internal consistency of the data was carried out, identifying contradictory, duplicate, or systematically erroneous records. Based on this, data cleaning and standardisation procedures were applied to resolve conflicts and eliminate non-representative values. The relevance of each variable in relation to the dropout phenomenon was also assessed, excluding those that showed no clear association or presented inconsistent reporting, in order to maximise analytical quality and minimise potential bias.
The construction of derived variables was based on the longitudinal tracking of students. Dropout was defined as students who, after their last recorded enrolment (between 2017 and 2021), neither graduated nor re-enrolled for at least two consecutive years. Conversely, school completion was defined as students reaching the final year of their educational phase without further enrolments. These operational definitions were essential for the subsequent analysis.
Focus of the study
This paper adopts a quantitative approach, combining a descriptive analysis of school dropout—exploring frequencies and rates segmented by sociodemographic, institutional, and temporal variables—and predictive modelling using machine learning techniques to estimate the probability of dropout, considering student-level, institutional, and socio-economic information.
The descriptive analysis aimed to characterise the study population and examine dropout distribution by sociodemographic, institutional, and geographic variables. Frequencies and dropout rates disaggregated by gender, area, type of institution, and educational modality were estimated and are presented in tables, charts, and maps. This initial exploration enabled the identification of the main dropout patterns in Paraguayan secondary education and served as the foundation for the subsequent analytical stages.
The predictive component focused on a cohort of students who began the first year of Secondary Education in Paraguay in 2017, aiming to assess the factors influencing non-completion of this educational level. After pre-processing and cleaning the dataset, a rigorous feature selection process was conducted and several predictive models were implemented. The procedures, models, and techniques used are described in detail in the following section.
Case Study: 2017 Cohort
A cohort of students entering the first year of Secondary Education in Paraguay in 2017 was analysed to assess the factors associated with school dropout and to examine the academic trajectory of the students. The target variable, called “dropout”, is defined based on the discontinuation of enrolment after initial registration, allowing for a clear identification of those students who do not continue in the system. The dataset integrates variables from different categories, such as demographic characteristics (gender, age and overage), academic background (repeated courses, type of educational pathway and school shift — session timing), institutional attributes (type of management and geographical location), socio-economic indicators (educational level and occupation of parents or guardians, household characteristics), and aspects related to access and mobility (travel time and means of transport used to reach school).
The first step in the analytical process was to carry out an exploratory analysis to identify variables with high percentages of missing data. Those variables with high levels of incompleteness were eliminated, given their limited reliability to contribute to the analysis. As for the individual records, the initial dataset contained 87,361 observations, which were cleaned by applying successive elimination thresholds for missing values. Starting with a threshold of 80% and progressively reducing it to complete records (0% missing data), a final dataset of 63,290 observations was obtained. During this process, a balance was maintained in the “dropout” variable (between 15% and 12% dropout), which supports the representativeness of the sample and ensures its suitability for the implementation of analytical models.
Institutional identifiers were excluded from the analysis after confirming that this decision did not affect the performance of the predictive models. Although an intraclass correlation coefficient (ICC) of approximately 33% was found—indicating that a considerable portion of the variability in dropout was attributable to differences between institutions—their exclusion prevents the models from overfitting to specific patterns and enhances their generalisability to new contexts. Additionally, given the marked imbalance in the “dropout” variable, an undersampling technique was applied to the majority class prior to model training to ensure an adequate balance with the minority class, thereby preserving the representativeness of critical instances.
Feature Selection **/*
With the selected variables, several classification algorithms were implemented to evaluate their predictive capacity in identifying school dropout, including linear models, tree-based approaches, and classical machine learning techniques. Prior to model training, a review and tuning of hyperparameters was conducted to optimise performance.
Logistic Regression was used as the baseline model due to its high interpretability. The coefficients estimated via maximum likelihood enable the computation of odds ratios, facilitating the evaluation of each predictor’s influence on the likelihood of dropout. LASSO Regression, incorporating L1 regularisation, was also applied to minimise fitting error. In this case, 10-fold cross-validation was used to determine the optimal value of λ, allowing the exclusion of irrelevant predictors and mitigating the risk of overfitting.
Additionally, tree-based algorithms were deployed, including Random Forest and Extreme Gradient Boosting (XGBoost). Random Forest was configured with an appropriate number of trees and tuned hyperparameters to reduce variance and enhance model stability, while XGBoost iteratively improved predictive accuracy through gradient boosting, using parameters designed to control overfitting. Classical machine learning methods such as Support Vector Machines (SVM) with radial basis function kernel were also included to capture non-linear relationships, along with a multi-layer artificial neural network (ANN) in which input features were standardised and weights optimised using backpropagation. The inclusion of a broad range of predictive models aims to enhance the generalisability of the findings, complementing the insights derived from the feature selection techniques.
Standard classification performance metrics were used to compare the models: Accuracy, Precision, Recall (Sensitivity), Specificity, and F1-Score. In the context of dropout prediction, Accuracy reflects the overall proportion of correct predictions. Precision indicates the proportion of correctly predicted positive cases, which is critical to minimise false positives in the identification of at-risk students. Recall (or Sensitivity) is especially important, as it captures the model’s ability to correctly identify students who actually drop out—key for the timely implementation of interventions. Specificity measures the model’s ability to correctly classify students who remain in school, and the F1-Score, which combines Precision and Recall, offers a balanced metric of model performance.
Several technological tools were used in the development of this study. The RUE database was managed using PostgreSQL. Python and R were employed for both descriptive analysis and predictive modelling, while Microsoft Excel supported exploratory calculations, data validation, and the presentation of results.
Results
The descriptive analysis is based on 706,785 students enrolled in Secondary Education in Paraguay (370,032 female and 336,753 male) during the period 2017–2023, revealing a slight predominance of female students. Table I shows a steady increase in enrolment numbers from 2017, peaking in 2021, followed by a slight decline in 2022 and 2023. Similarly, the number of dropouts increased, with peaks above 21,000 cases in 2019 and 2020, coinciding with the onset of the COVID-19 pandemic, which may have disrupted school continuity. In 2021, the number of dropouts decreased to 14,918, coinciding with the partial return to in-person learning and the implementation of contingency measures. Notably, dropout rates were initially higher among male students (2017–2019), but from 2020 onwards, the female dropout rate surpassed the male rate, reaching 52.25% in 2020 and 57.47% in 2021.
Distribution of Frequency and Percentage of Dropout in Secondary Education by Year and Gender (2017–2023).
| Year | Total Enrolment | Dropouts | Dropout Rate (%) | Female Dropouts | % Female Dropout | Male Dropouts | % Male Dropout |
| 2017 | 87,361 | 13,378 | 15.31 | 5,288 | 39.53 | 8,090 | 60.47 |
| 2018 | 93,061 | 13,450 | 14.45 | 5,809 | 43.19 | 7,641 | 56.81 |
| 2019 | 103,981 | 21,065 | 20.26 | 10,064 | 47.78 | 11,001 | 52.22 |
| 2020 | 106,497 | 21,969 | 20.63 | 11,479 | 52.25 | 10,490 | 47.75 |
| 2021 | 107,529 | 14,918 | 13.87 | 8,574 | 57.47 | 6,344 | 42.53 |
| 2022 | 105,019 | — | — | — | — | — | — |
| 2023 | 103,337 | — | — | — | — | — | — |
| Total | 706,785 | 84,780 | 41,214 | 48.61 | 43,566 | 51.39 |
Source: RUE database. Compiled by the authors.
Table II shows that the average age at enrolment in secondary education increased from 15.58 years in 2017 to 17.59 years in 2023, indicating a trend toward delayed entry into the educational phase. Similarly, the average age at dropout rose from 16.47 years in 2017 to 23.46 years in 2021, reflecting longer school retention prior to leaving. The most pronounced increases occurred in 2020 and 2021, again aligning with the pandemic context. In general, female students dropped out at a later age than male students, and this gender gap widened progressively over the study period.
Average Age at Enrolment and Dropout in Secondary Education by Year and Gender (2017–2023)
| Year | Avg. Enrolment Age | Avg. Dropout Age | Dropout Age (Female) | Dropout Age (Male) |
| 2017 | 15.58 | 16.47 | 16.18 | 16.65 |
| 2018 | 15.79 | 17.54 | 18.07 | 17.14 |
| 2019 | 16.62 | 20.47 | 22.01 | 19.06 |
| 2020 | 16.99 | 21.72 | 23.37 | 19.91 |
| 2021 | 17.40 | 23.46 | 24.72 | 21.78 |
| 2022 | 17.44 | — | — | — |
| 2023 | 17.59 | — | — | — |
Source: RUE database. Compiled by the authors.
.
As shown in Table III, dropout rates are on average higher in urban areas (17.39%) than in rural areas (15.95%) across the period. Although these values remain relatively stable, dropout peaks are again evident in 2019 and 2020, with urban zones being particularly impacted. In 2019 alone, urban dropouts rose from 9,979 to 16,037—an increase of over 60%. By 2021, dropout patterns appeared to return to levels observed at the start of the study period.
Frequency and Percentage of School Dropout by Year and Zone (2017–2023)
| Year | Rural Enrolment | Urban Enrolment | Rural Dropouts | Rural Dropout % | Urban Dropouts | Urban Dropout % |
|---|---|---|---|---|---|---|
| 2017 | 23,488 | 63,873 | 3,692 | 15.72 | 9,686 | 15.16 |
| 2018 | 24,698 | 68,363 | 3,471 | 14.05 | 9,979 | 14.60 |
| 2019 | 27,558 | 76,423 | 5,028 | 18.25 | 16,037 | 20.98 |
| 2020 | 27,978 | 78,519 | 5,424 | 19.39 | 16,545 | 21.07 |
| 2021 | 28,173 | 79,356 | 3,421 | 12.14 | 11,497 | 14.49 |
| 2022 | 26,415 | 78,604 | — | — | — | — |
| 2023 | 25,031 | 78,306 | — | — | — | — |
| Total | 183,341 | 523,444 | 21,036 | 15.95 | 63,744 | 17.39 |
Source: RUE database. Compiled by the authors.
Table IV shows that dropout is predominantly concentrated in state-funded (official) institutions, accounting for more than 80% of total cases, with a slight decrease in 2021 (78.50%). In contrast, private institutions have experienced a proportional increase in dropout throughout the analysis period (2017–2021), while grant-aided private institutions have remained relatively stable with a consistently low dropout rate.
Distribution of School Dropouts in Secondary Education by Type of Institution (2017–2021)
| Year | Official Dropouts | % Official | Private Dropouts | % Private | Grant-Aided Private Dropouts | % Grant-Aided Private |
| 2017 | 11,565 | 86.45 | 1,136 | 8.49 | 677 | 5.06 |
| 2018 | 11,116 | 82.65 | 1,727 | 12.84 | 607 | 4.51 |
| 2019 | 17,402 | 82.61 | 3,036 | 14.41 | 627 | 2.98 |
| 2020 | 18,375 | 83.64 | 2,856 | 13.00 | 738 | 3.36 |
| 2021 | 11,711 | 78.50 | 2,765 | 18.53 | 442 | 2.96 |
| Total | 70,169 | 82.77 | 11,520 | 13.59 | 3,091 | 3.65 |
Source: RUE database. Compiled by the authors.
The analysis of Table V reveals that the Scientific Pathway accounts for the highest enrolment (343,919) and the greatest number of dropouts in absolute terms (46,554 cases, or 54.91% of total dropouts). However, its relative dropout rate is moderate (13.54%), indicating that despite its popularity, it is not proportionally the most vulnerable. In contrast, the General Pathway shows the highest relative dropout rate (61.77%), representing 32.97% of total dropouts. Technical Pathways, such as the Industrial and Service Technical Pathways, show lower relative dropout rates (5.48% and 7.76%, respectively). Finally, Vocational Training, while low in enrolment and absolute dropouts, exhibits the highest relative dropout rate (63.48%).
School Dropouts in Secondary Education by Educational Pathway (2017–2021)
| Type of Pathway | Total Enrolment | Dropouts | % of Total Dropouts | Relative Dropout Rate (%) |
| Scientific Pathway | 343,919 | 46,554 | 54.91 | 13.54 |
| Service Technical Pathway | 80,374 | 6,241 | 7.36 | 7.76 |
| General Pathway | 45,257 | 27,956 | 32.97 | 61.77 |
| Industrial Technical Pathway | 14,568 | 798 | 0.94 | 5.48 |
| Agricultural Technical Pathway | 11,797 | 1,635 | 1.93 | 13.86 |
| Vocational Training | 2,514 | 1,596 | 1.88 | 63.48 |
Source: RUE database. Compiled by the authors.
Figure I illustrates the relative dropout rate by school shift, showing marked differences. The night shift registers the highest rate (42%), probably due to the workload or family responsibilities faced by its students. It is followed by the evening shift (20.8%) and the afternoon shift (15.7%), both with considerable dropout risk. In contrast, the morning-afternoon (10.3%) and morning (11.3%) shifts show lower dropout rates.
FIGURE I. Relative Dropout Rate by School Shift (2017–2021)
Source: RUE database. Compiled by the authors.
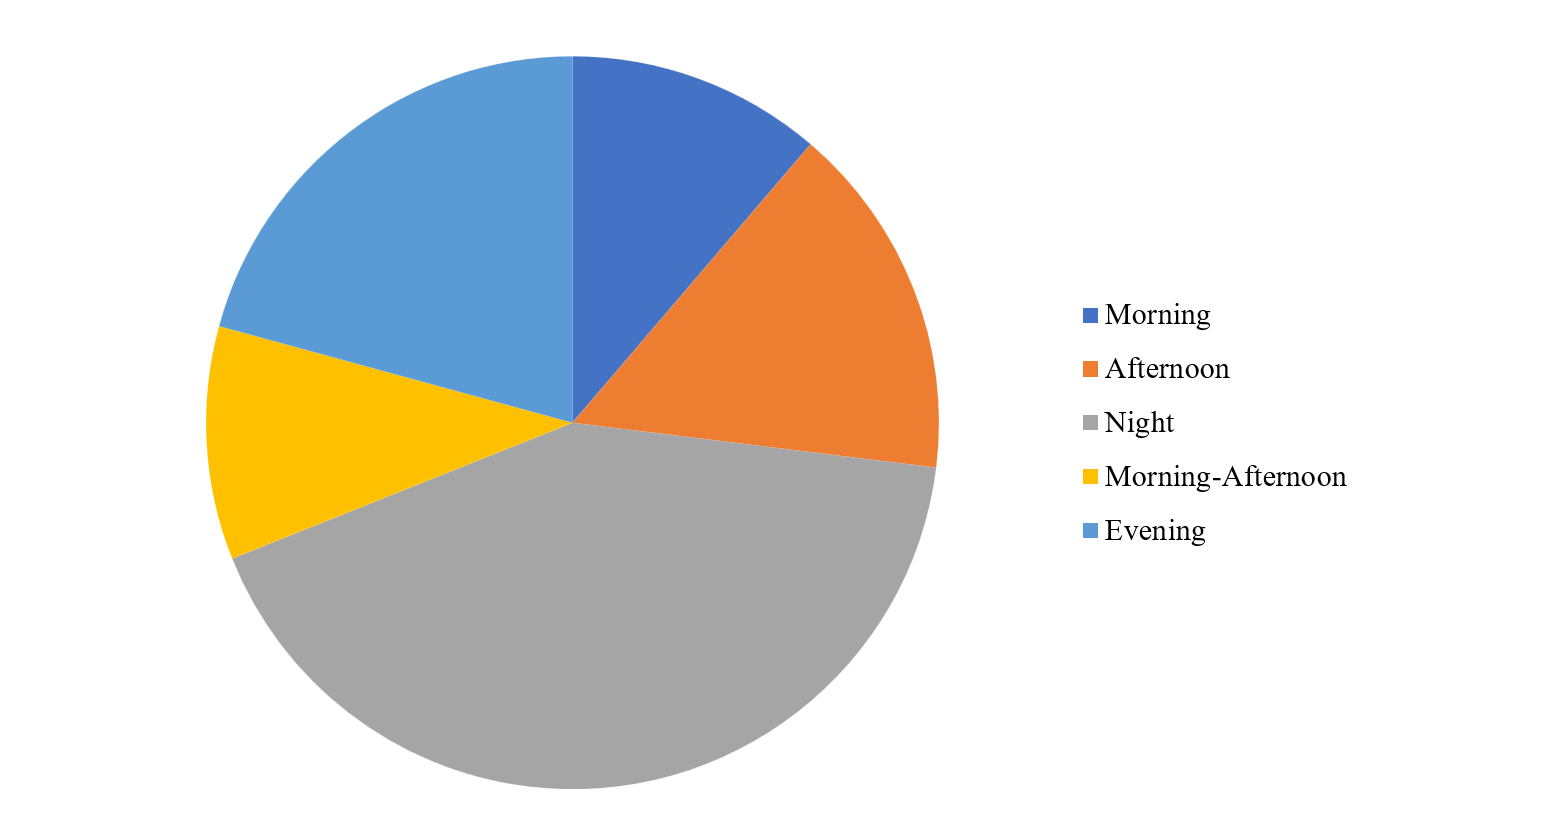
Table VI shows that students who have not repeated any academic year in secondary education have a dropout rate of 11.70%. In contrast, those who have repeated at least once show a significantly higher rate (24.92%), indicating that grade repetition is associated with a higher risk of dropping out. Similarly, the relative dropout rate remains at comparable levels for students who have repeated two or three times.
School Dropouts by Number of Repeated Academic Years (2017–2021)
| Number of Repeated Years | Total Students | No Dropout | Dropouts | Dropout Rate (%) |
|---|---|---|---|---|
| 0 | 690,499 | 609,743 | 80,756 | 11.70 |
| 1 | 14,926 | 11,207 | 3,719 | 24.92 |
| 2 | 1,214 | 937 | 277 | 22.82 |
| 3 | 133 | 106 | 27 | 20.30 |
| More than 4 | 13 | 12 | 1 | 7.69 |
Source: RUE database. Compiled by the authors.
Figure II shows the dropout rate by department in Paraguay. Alto Paraguay and Boquerón report rates exceeding 24%, likely due to geographic isolation and socio-economic disadvantages. In contrast, departments such as Central and Paraguarí exhibit lower dropout rates. It is also evident that departments with international borders—particularly those adjacent to Brazil and Argentina—tend to register higher dropout rates during the analysis period.
FIGURE II. Dropout Rates by Department (2017–2021)
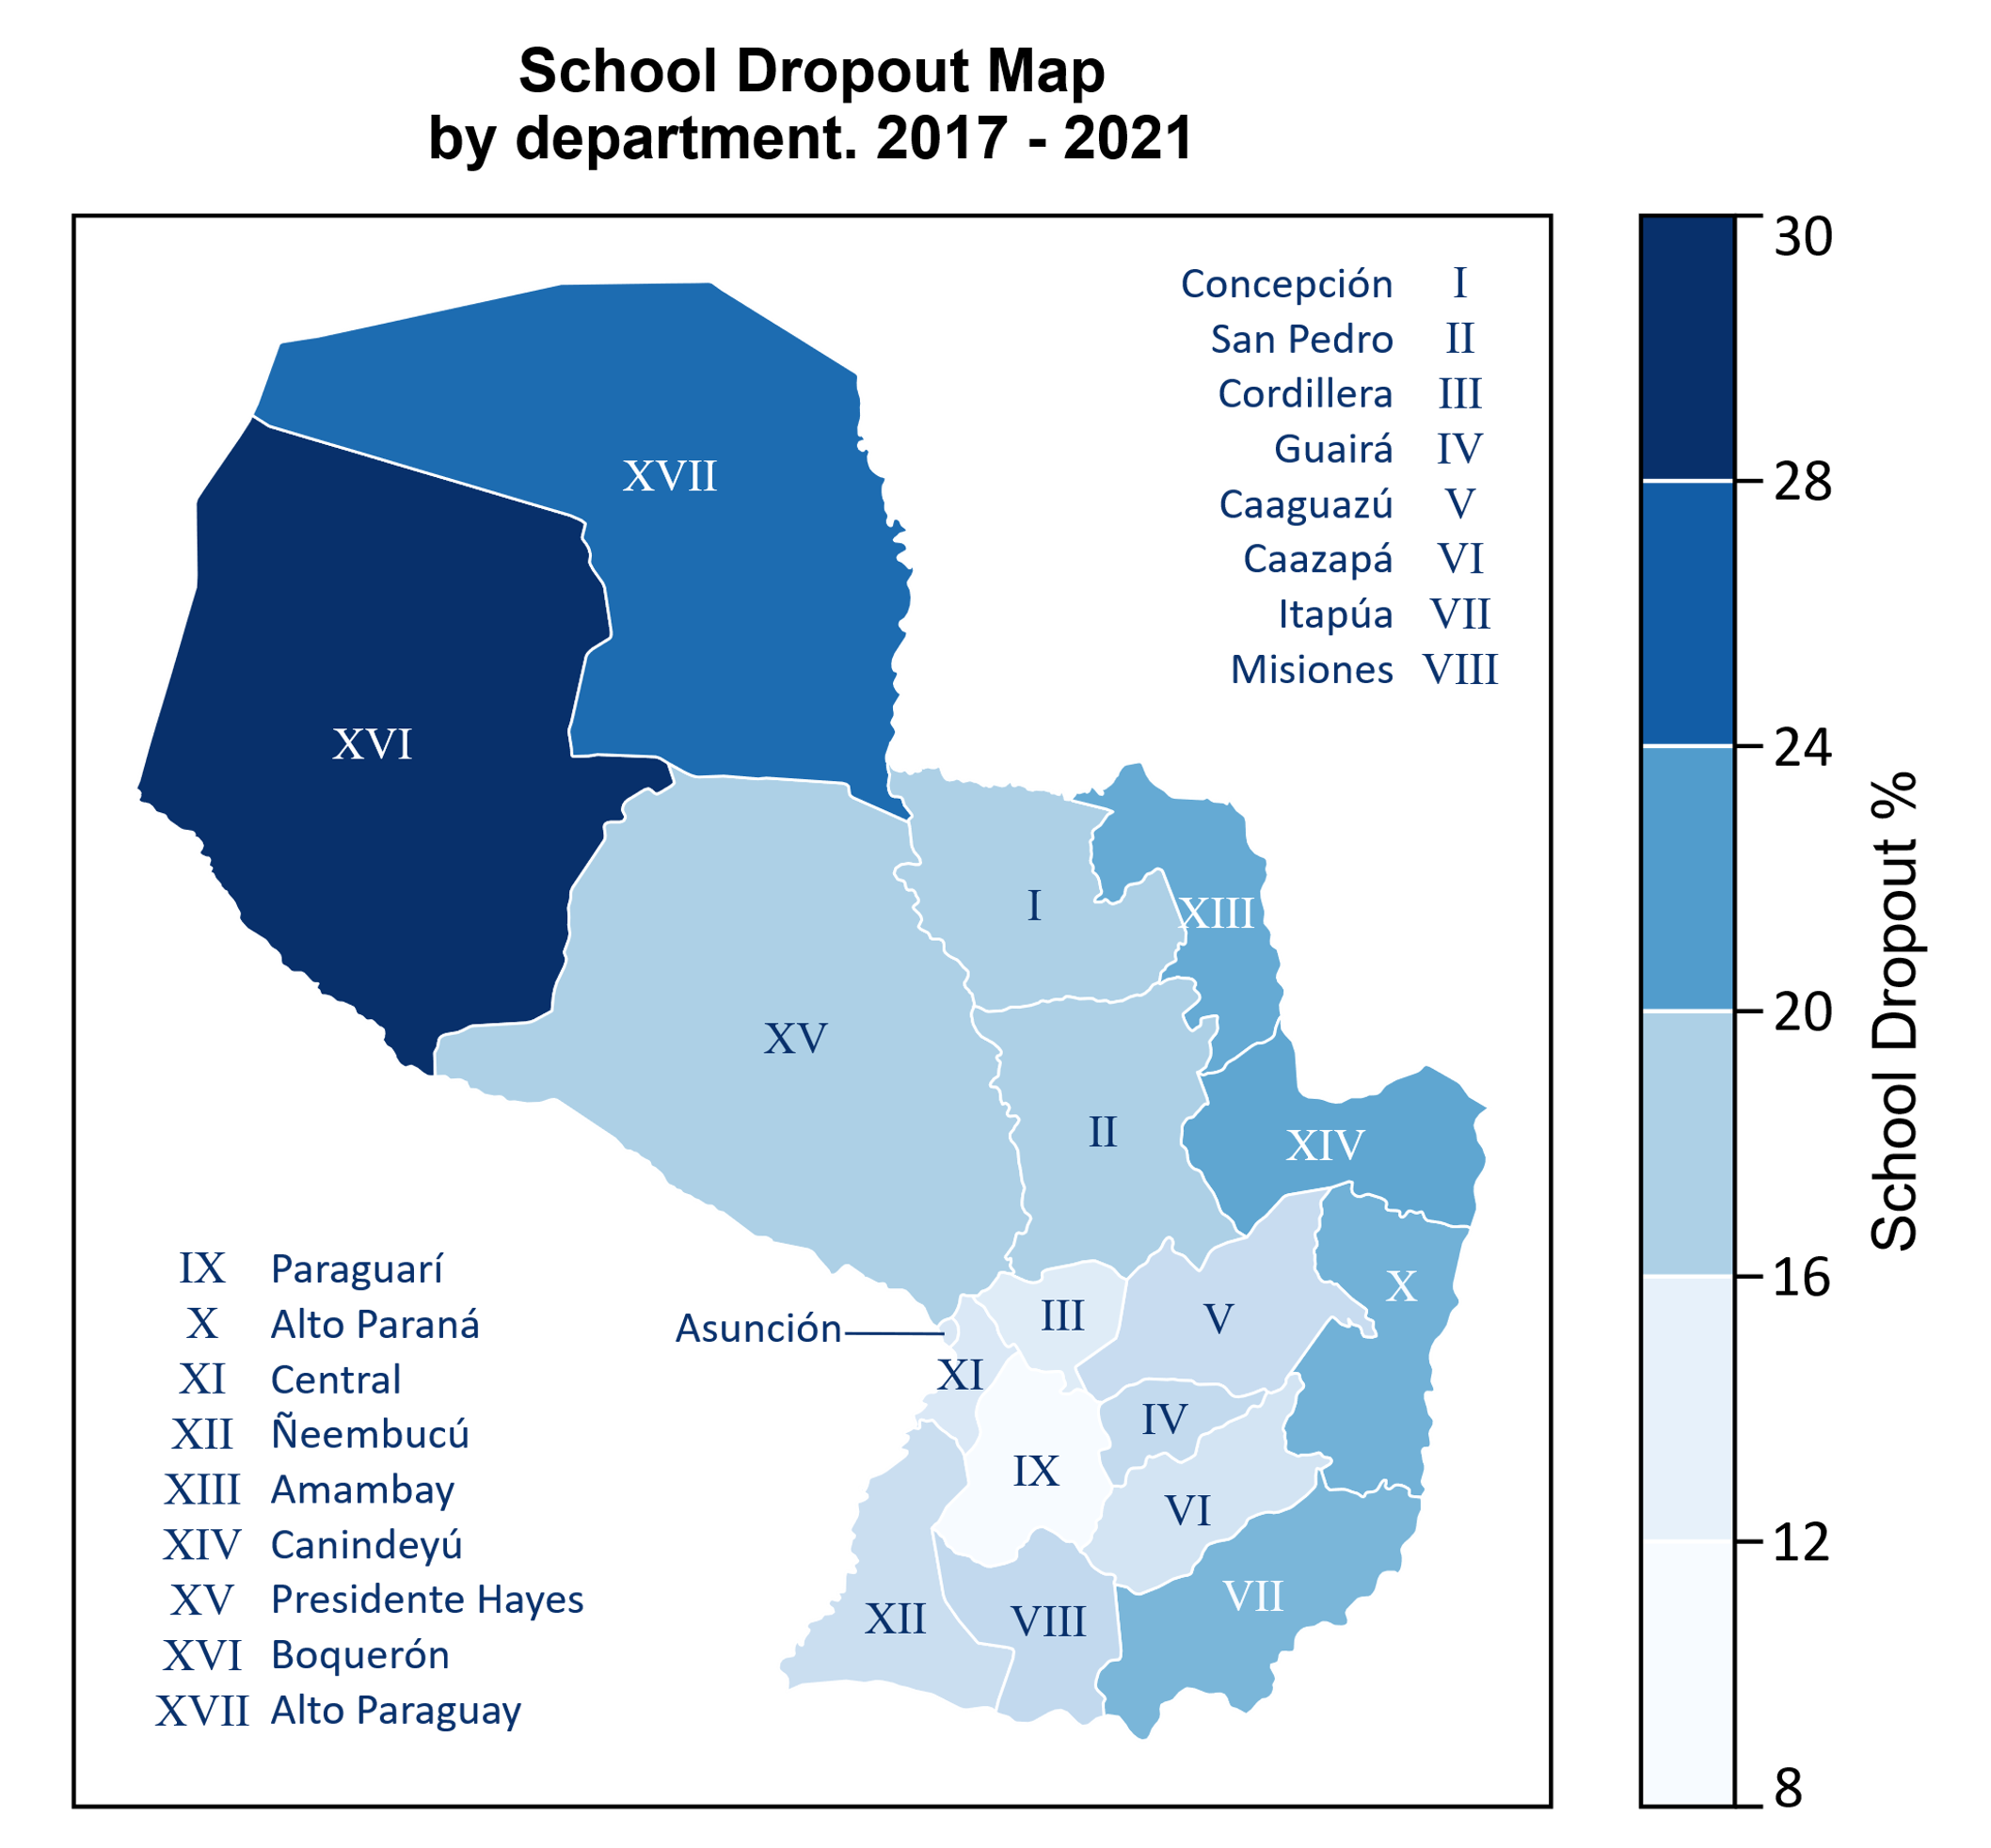
Source: RUE database. Compiled by the authors.
Case Study: 2017 Cohort
A predictive approach was developed based on the analysis of a cohort of students who entered the first year of upper secondary education (Educación Media) in Paraguay in 2017. A rigorous feature selection process was carried out, and several predictive models of school dropout were implemented; the results are presented below.
Feature Selection ***
This section summarises the metrics obtained from Logistic Regression, Random Forest (evaluated using the MDA and MDG criteria), and LASSO Regression for the five variables selected according to the four criteria. Table VII presents the numerical values for the most relevant variables identified by each method, allowing their relative importance to be assessed.
Feature selection metrics. Relevant variables for the implemented methods.
| Variable | Logistic Regression (Significance) | Random Forest (MDA) | Random Forest (MDG) | LASSO Regression (Coefficient) |
|---|---|---|---|---|
| Age (in years) | 15.7 | 34.03 | 492.42 | 0.611 |
| Pathway | 23.3 | 16.85 | 256.09 | 5.49 |
| Shift | 12.6 | 12.57 | 158.14 | 1.29 |
| Department | 6.71 | 8.54 | 390.69 | 2.33 |
| Overage | 2.59 | 22.27 | 216.42 | 0.201 |
Source: RUE database. Compiled by the authors.
The variables Age (in years), Pathway, School shift, Department, and Overage were selected consistently, capturing key dimensions of the student profile and institutional context. The literature supports that age, and especially overage, is a critical determinant of student retention, as academic lag increases the risk of dropping out. In addition, Pathway, Department, and School shift may be reflecting the effect of socio-economic and cultural inequalities on school continuity.
Other variables were moderately selected by three methods, such as Modality – which classifies the curriculum into Scientific, Technical, Vocational, and Open Pathways – School management type (official, private, or grant-aided), and household characteristics, such as availability of appliances, which reflect socio-economic status.
Finally, at least two methods consistently selected variables such as Student gender and Number of repeated grades – a classic indicator of academic difficulties and a variable associated with dropout – along with school type (e.g., Indigenous Educational Institution), zone (rural or urban), father’s employment status, mother’s or guardian’s educational attainment, and the district of the school. Although these variables were selected with less consistency, they complement the model by capturing indirect but relevant aspects of school persistence. For example, in this cohort, students whose mothers had completed primary education had a dropout rate of approximately 13%, which decreased to 8% if the mother had completed secondary education, and to only 4% when the mother held a university degree. Similarly, students whose parents held stable jobs (in the public or private sector, or as employers) exhibited dropout rates between 7% and 10%, while those in occupations with less job security reached rates as high as 15%–19%. These findings are consistent with literature highlighting the influence of socio-economic conditions on educational trajectories. The lower presence of these variables in some selection methods could be due to collinearity with other predictors capturing similar dimensions. Thus, even if mother’s education or father’s occupation are not explicitly included in all models, their effects may be reflected through correlated variables.
Predictive Models of School Dropout **
Table VIII summarises the performance metrics obtained by each of the models implemented for dropout prediction. They include: Accuracy, Precision, Recall, Specificity and F1-Score.
Performance of Predictive Models for Dropout Prediction.
|
|
|
|
|
|
|
|
|
|
|
|
|
|
< |
|
|
|
|
|
|
|
|
|
|
|
|
|
|
|
|
|
|
|
|
|
< |
|
|
|
|
|
Source: RUE database. Compiled by the authors.
Considering the results in Table VIII, Logistic Regression achieves the highest accuracy (0.7332), meaning that 73.32% of predictions (dropouts and non-dropouts) are correct, and its recall (0.5980) indicates that it identifies approximately 60% of students who actually drop out. However, its precision is low (0.2436), implying that a significant proportion of positive predictions correspond to students who do not drop out.
Random Forest and XGBoost show similar performance, with recall values above 0.62, which supports the identification of at-risk students. However, their precision is limited (≈0.22), reflected in relatively low F1-scores (≈0.33). SVM follows a similar pattern, with recall of 0.6107 and precision of 0.2227, along with comparatively lower accuracy and F1-score. Neural Networks reach an intermediate accuracy (0.7198) and recall (0.6154), results comparable to those of Logistic Regression.
LASSO Regression stands out for its high precision (0.9312) and recall (0.7288), resulting in an F1-score of 0.8177—the highest among all evaluated models. Although its accuracy is 0.7134, its sensitivity makes it a solid option for identifying students at risk, while its high precision helps minimise false positives. Based on the values in Table VIII, it can be concluded that LASSO offers the best overall performance for predicting dropout using the selected variables.
In addition to its strong predictive performance, LASSO Regression provides a parsimonious model by discarding coefficients with no significant effect, while maintaining the interpretability of Logistic Regression. For example, for the variable Age, the estimated coefficient (β ≈ 0.847) translates into an Odds Ratio of exp(0.847) ≈ 2.33, meaning that—holding all other variables constant—a student one year older is 2.33 times more likely to drop out.
The interpretation of the remaining variables is less direct, as they are categorical predictors converted into dummy variables. However, the Odds Ratio still allows us to intuitively assess their impact: the variable School shift is the second most influential (OR ≈ 1.13), while Department (OR ≈ 1.02) and Pathway (OR ≈ 0.99) have a more limited effect. In addition, the coefficient associated with Overage is reduced to zero (OR = 1), indicating that, in this penalised model, Overage does not contribute additional predictive value, likely because its effect is already captured by the Age variable.
In the context of this study, LASSO Regression demonstrates a particularly robust performance by combining high sensitivity and precision. Its ability to regularise through L1 penalisation facilitates the elimination of variables with lower relevance, resulting in a parsimonious and interpretable model that prioritises the predictors most strongly associated with dropout. Under these conditions, LASSO emerges as the most appropriate alternative for the early identification of students at risk, by minimising both false positives and model complexity.
Conclusions ***
This research was based on an extensive dataset from the Registro Único del Estudiante (RUE) of Paraguay’s Ministry of Education and Science (MEC), covering the period 2017–2023 and comprising a large volume of records. Its methodological strengths—particularly the use of official data and rigorous analytical techniques—provide solid evidence on secondary school dropout in Paraguay. Moreover, the limited number of Latin American studies using official administrative data focused on pre-university levels reinforces the contribution of this work.
The descriptive analysis reveals a steady increase in enrolment between 2017 and 2021, with dropout peaks in 2019 and 2020. The outbreak of the pandemic in 2020 exacerbated dropout in a context where education shifted to distance learning; in 2021, dropout declined under containment measures and a partial return to in-person classes. Regarding gender, although dropout was initially higher among male students, from 2019 onwards a progressive increase in the female share is observed. In addition, the average student age increased from 2017 to 2023, suggesting a rise in overage and academic lag.
Geographically, dropout patterns were similar across urban and rural areas; however, dropout rates were significantly higher in official institutions compared to private or grant-aided schools. There are marked differences across departments, with the night shift consistently showing the highest dropout rates. In terms of pathway, the General Pathway and Vocational Training Pathway recorded the highest dropout percentages. In addition, first-time repetition of a school year emerges as a critical factor and trigger for dropout.
The feature selection process underscored the relevance of age (especially overage), pathway, shift, and department as variables that consistently explain dropout. Older age within a given school year significantly increases dropout risk. Departments reflect territorial disparities, and the night shift in Paraguay is often associated with labour and family responsibilities. Pathways such as Vocational Training tend to concentrate students with immediate needs for labour market insertion or lower prospects of pursuing further studies, contributing to their higher dropout rates. While overage and grade repetition had already been identified as strong predictors (Conde et al., 2023), this study broadens the scope by clearly highlighting the influence of pathway and school shift, which have received relatively little attention in the literature.
Model performance comparisons show that LASSO Regression balances recall and precision in an outstanding way: it identifies approximately 73% of actual dropout cases (recall) and correctly classifies 93% of positive predictions (precision). This balance is reflected in an F1-score of ≈0.82, the highest among all models, making it the most promising technique for the early identification of at-risk students. Its robustness and interpretability make it suitable for guiding early warning systems, by effectively identifying students at risk while minimising false positives.
The practical implications of the study highlight the need to design interventions targeting both structural factors (territorial disparities, specific support for night shifts) and individual factors (grade repetition, overage, vocational guidance). Policy makers are encouraged to reinforce efforts in official institutions, where dropout is most concentrated—especially in the night shift, General Pathway, and Vocational Training Pathway—and to pay close attention to students with at least one repeated year. Additionally, it is essential to develop guidance and tutoring programmes involving families, ensuring coordinated actions inside and outside the school environment. As proposed by Gutiérrez-de-Rozas et al. (2023), these programmes should focus on non-cognitive dimensions (e.g., self-esteem, social and life skills, decision-making) and on teaching and learning strategies.
As a contribution to the literature, this study demonstrates the value of large-scale official administrative data for analysing school dropout in Latin America. By linking socio-demographic, academic, and institutional variables for over 700,000 students, it confirms that overage and school history (particularly repetition) remain strong predictors of dropout. It also shows that certain pathways, attendance in the night shift, and territorial inequalities reflect how structural factors continue to shape educational disengagement. This study not only contributes to international evidence on the role of socio-economic and school factors in school dropout (Hernández-Leal et al., 2021), but also underscores the analytical power of census data for informing student retention policies, especially in contexts where Education Information and Management Systems (EMIS) are still under development (Arias et al., 2021).
The limitations of the study include the coverage and quality of certain RUE fields, and the absence of psychosocial and economic factors, which could enhance model accuracy. As directions for future research, we suggest extending the time series to better assess the long-term effects of the pandemic on dropout in Paraguay, exploring qualitative variables (e.g., motivation, school climate, family involvement), and adopting alternative methodologies, such as time series models or causal inference techniques, while integrating external datasets (e.g., social programmes, health statistics) for a more comprehensive analysis of dropout risk. In addition, it would be valuable to compare these findings with results from emerging artificial intelligence methods, such as deep neural networks, recurrent networks, or transformer-based architectures, capable of capturing complex temporal patterns in educational trajectories (Kusumawardani & Alfarozi, 2023; Nguyen et al., 2024).
In sum, this paper contributes to the understanding of dropout in secondary education in Paraguay and Latin America, demonstrating the potential of data analytics for informing education policy. Implementing these recommendations and strengthening information systems may enhance the responsiveness of education authorities, leading to improved student retention and completion rates.
Referencias bibliográficas
Abideen, Z. U., Mazhar, T., Razzaq, A., Haq, I., Ullah, I., Alasmary,
H., & Mohamed, H. G. (2023). Analysis of Enrollment Criteria in
Secondary Schools Using Machine Learning and Data Mining Approach.
Ajjawi, R., Dracup, M., Zacharias, N., Bennett, S., & Boud, D.
(2020). Persisting students’ explanations of and emotional responses to
academic failure.
Alladatin, J., Lionel, R., & Insaf, A. C. (2023). School
principal’s training programs, challenges, and improvement
opportunities: rapid review.
Alyahyan, E., & Düştegör, D. (2020). Predicting academic success
in higher education: literature review and best practices.
Amaya-Amaya, A., Huerta-Castro, F., & Flores-Rodríguez, C. O.
(2020). Big Data, una estrategia para evitar la deserción escolar en las
IES.
Arias Ortiz, E., Eusebio, J., Pérez Alfaro, M., Vásquez, M. y Zoido,
P. (2021).
Conde Vélez, S., García Rodríguez, M. D. P., & Toscano Cruz, M.
D. L. O. (2023). Riesgo de abandono escolar: ¿cómo influyen las
características sociofamiliares percibidas por los estudiantes sobre sus
actitudes y comportamiento en el aula?.
Comisión Económica para América Latina y el Caribe (enero de 2024).
European Education Area (17 de junio de 2022).
EUROSTAT (19 de mayo de 2025).
Flores Satalaya, J. M. (2025). El machine learning para abordar el
abandono escolar: Una revisión de los modelos más innovadores.
Gutiérrez-de-Rozas, B., López-Martín, E., & Carpintero, E.
(2023). Análisis del abandono educativo temprano en España:
condicionantes del abandono y motivos para regresar al sistema
educativo.
Hernández-Leal, E., Duque-Méndez, N. D., & Cechinel, C. (2021).
Unveiling educational patterns at a regional level in Colombia: data
from elementary and public high school institutions.
Hernández Prados, M.A., & Alcaraz Rodríguez, M. (2018). Factores
incidentes en el abandono escolar prematuro.
Insfrán-Coronel, D.R., Enrique-Sánchez, E.M., Beck, F.,
López-Fernández, A., & García-Torres, M. (2024). Analysis of School
Dropout Rate in Paraguay Using a Machine Learning Approach en Quintián,
H., et al. (Eds.),
Ministerio de Educación y Ciencias (2013). La deserción escolar en
Paraguay: Características que asume en la educación media
Instituto Nacional de Estadística (26 de febrero de 2024).
Khurram, F., Hossain, M., Korobi, F., Khan, M., Talukder, M., Nath,
C., & Talukder, A. (2023) Understanding School Dropout and Its
Impact on the Community in the Khulna Region of Bangladesh.
Kocsis, Á., & Molnár, G. (2024). Factors influencing academic
performance and dropout rates in higher education.
Krüger, J. G., Britto Jr., A. de S., & Barddal, J. P. (2023).An
explainable machine learning approach for student dropout prediction.
Kusumawardani, S. S., & Alfarozi, S. A. I. (2023). Transformer
Encoder Model for Sequential Prediction of Student Performance Based on
Their Log Activities.
Ministerio de Educación, Formación Profesional y Deportes (7 de
febrero de 2025).
Montero-Sieburth, M., & Turcatti, D. (2022). Preventing
disengagement leading to early school leaving: pro-active practices for
schools, teachers and families.
Nait Belaid, Y. (2021). A critical analysis of policies to fight
illiteracy and school dropout in rural Morocco.
Nguyen Thi Cam, H., Sarlan, A., & Arshad, N. I. (2024). A hybrid
model integrating recurrent neural networks and the semi-supervised
support vector machine for identification of early student dropout risk.
Ortiz-Lozano, J. M., Aparicio-Chueca, P., Triadó-Ivern, X. M., &
Arroyo-Barrigüete, J. L. (2023). Early dropout predictors in social
sciences and management degree students.
Ramsdal, G. H., & Wynn, R. (2022). Theoretical Basis for a Group
Intervention Aimed at Preventing High School Dropout: The Case of
‘Guttas Campus’.
Rodríguez, P., Delgado Villanueva, A., Dombrovskaia, L., &
Valenzuela, J. P. (2023). A methodology to design, develop, and evaluate
machine learning models for predicting dropout in school systems: the
case of Chile.
Segura, M., Mello, J., & Hernández, A. (2022). Machine learning
prediction of university student dropout: Does preference play a key
role?.
Serrano, K., Sierra, Y., Rios-Cruz, S., & Pardo, F. (2024).
Machine Learning models for predicting academic withdrawal in college
students. En
Smith Uldall, J., & Gutiérrez Rojas, C. (2022). An Application of
Machine Learning in Public Policy: Early Warning Prediction of School
Dropout in the Chilean Public Education
System.
Organización de las Naciones Unidas para la Educación, la Ciencia y
la Cultura (2022).
Venkatesan R.G., & Mappillairaju, B. (2023). Detection of
hotspots of school dropouts in India: A spatial clustering approach.
Zapata-Medina, D., Espinosa-Bedoya, A., & Jiménez-Builes, J. A.
(2024). Improving the Automatic Detection of Dropout Risk in Middle and
High School Students: A Comparative Study of Feature Selection
Techniques.
Zengin, M. (2021). Investigation of High School students’ dropout
risk level.
Información de contacto / Contact info: Jorge Daniel Mello-Román. Universidad Nacional de Concepción. E-mail: jdmello@facet-unc.edu.py