Grade retention, socioeconomic determinants, and research quality
Repetición escolar, determinantes socioeconómicos y calidad de las investigaciones
https://doi.org/10.4438/1988-592X-RE-2025-409-687
Rubén Fernández-Alonso
Universidad de Oviedo
https://orcid.org/https://orcid.org/
Laura M. Cañamero
Universidad de Oviedo
https://orcid.org/0000-0001-5828-004X
Álvaro Postigo
Universidad de Oviedo
https://orcid.org/https://orcid.org/
José Carlos Nuñez
Universidad de Oviedo
https://orcid.org/https://orcid.org/
Abstract
The relationship between repeating school years and socioeconomic and cultural level has been widely studied in Spain. However, the results of those studies are varied and occasionally even conflicting. One reason for these differences may be the difficulty in neutralizing two types of biases inherent in studying repetition: selection bias and covariate control. The aim of this study was to estimate the probability of repeating a school year in three social status groups: low, middle and high. A sample of 5999 students was used, assessed at two timepoints (T1 = 4th grade; and T2 = 8th grade). At T1, the sample was from the same grade and were the same age: students had not repeated any school years and the first repetitions did not occur until the end of 6th grade. The study combined two analytical approaches: At T1, the groups (retention-promotion) were matched using a propensity analysis to control for pre-retention selection bias. At T2, the matched estimates were adjusted using multilevel logistic models, incorporating control for post-retention covariates. The predictions of three models were compared, defined by the degree of control included in their design: (1) descriptive, with no control variables or equivalent groups; (2) cross-sectional, with control for covariates only at T2; and (3) longitudinal, with dual control—pre-retention equivalent groups plus post-retention adjustment variables. The results showed that the model with better bias control (longitudinal) exhibited more moderate and partially significant effects. The data highlight the need to develop specific research in Spain on grade repetition that includes repeated measures before and after repetition with matched samples, or the alternative use of quasi-experimental approaches. In this way, the debate on grade repetition will be enriched by the contribution of fully valid data.
Keywords:
repetition, education, socio-economic status, hierarchical models, propensity score
Resumen
La relación entre repetición y nivel socioeconómico y cultural ha sido ampliamente estudiada en España, sin embargo, las estimaciones ofrecidas son variadas, incluso discordantes. Una razón de estas divergencias puede ser la dificultad de neutralizar dos tipos de sesgos inherentes a los estudios sobre repetición: el sesgo de selección y el control de covariables. El objetivo de esta investigación fue estimar la probabilidad de repetir en tres grupos de estatus social: bajo, medio y alto. Se manejó una muestra de 5999 estudiantes evaluados en dos momentos (T1 = 4º EP; y T2 =2º ESO). En T1 la muestra era del mismo grado y misma edad: el alumnado no habían repetido previamente y las primeras repeticiones no se produjeron hasta finalizar 6º EP. El trabajo combinó dos aproximaciones analíticas: en T1 los grupos (repetición-promoción) fueron equiparados mediante un análisis de propensión para controlar el sesgo de selección pre-repetición. En T2, las estimaciones equiparadas se ajustaron a modelos logísticos multinivel, lo que añade el control de covariables post-repetición. En concreto se compararon las predicciones de tres modelos, definidos por el grado de control incluido en su diseño: (1) descriptivo, sin variables de control ni grupos equivalentes; (2) transversal, solo con control de covariables en T2; y (3) longitudinal, con doble control, es decir, grupos equivalentes pre-repetición más variables de ajuste post-repetición. Los resultados evidenciaron que el modelo con mejor control de sesgos (longitudinal) presenta efectos más moderados y parcialmente significativos. Los datos ponen de manifiesto la necesidad de desarrollar, en nuestro país, investigaciones específicas sobre repetición que incluyan medidas repetidas pre y post-repetición con muestras equiparadas, o el uso alternativo de enfoques cuasi-experimentales. De este modo el debate sobre la repetición escolar se enriquecerá con la aportación de datos plenamente válidos.
Palabras clave:
repetición, educación, estatus socio-económico, modelos jerárquicos, análisis de propensiónIntroduction
Grade repetition is an educational measure rooted in the 19th
century. Graded schooling made mass education feasible in the emerging
liberal states, and repetition became the standard response for
students who deviated from group homogeneity or failed to meet
academic expectations (Shepard & Smith, 1989). It has been a
controversial measure since its inception, as indicated by the
earliest work (Ayres, 1909), compendiums of research in the first half
of the 20th century (Goodlad, 1954; Jackson, 1975), and by
what is probably the first monograph on the topic published by the
A second explanatory source of grade repetition lies in certain socio-demographic, family, and contextual characteristics. These include being male, an immigrant, or younger than one’s peers; coming from broken homes, reconstructed, or more diverse families; and having fewer economic and cultural incentives and resources (Cordero et al., 2014; Organisation for Economic Co-operation and Development [OECD], 2016; Urbano & Álvarez, 2019; Xia & Kirby, 2009). The present study focuses on examining the relationship between repetition and this second source of variation.
Various findings indicate that repetition is conditioned by culture. For example, the extent of repetition varies widely between countries, reflecting each society’s acceptance or rejection of the measure (e.g., OECD 2010, 2016). There are also differences in countries’ regulations concerning it (European Education and Culture Executive Agency, 2011) and how they manage student diversity, which seems to be associated with the effectiveness of the measure (Goos et al., 2021). Lastly, the effects of repetition seem to depend on the palliative measures that are available: in some education systems, repetition is not accompanied by additional support, whereas in others there are alternative complementary actions or special programmes (Fernández-Alonso et al., 2022¸Valbuena et al., 2021). This is justification for focusing the rest of this review on the Spanish context.
Compared to the English-speaking world, Spanish research on grade repetition is very recent, and has mostly been undertaken thanks to data produced by large-scale national (e.g., López-Agudo et al., 2024) and international evaluations (e.g., Agasisti & Cordero, 2017; Blanco-Varela & Amoedo, 2025). The conclusions about the relationship between repetition and social status do not seem to be unanimous. Duran-Bonavila et al. (2024) found that social status lost its predictive capacity over repetition when cognitive skills were controlled for, and Fernández and Rodríguez (2008) noted that socioeconomic level stopped being statistically significant when the results in PISA were considered. Along similar lines, Carabaña (2011) indicated that repetition was not a classist measure, and that it could be explained by what may be logically expected to explain it: school performance, also measured with PISA scores.
Nonetheless, Spanish research has mostly concluded that there is an
inverse relationship between measures of social status and the
probability of grade repetition (Arroyo et al., 2019; Cabrera et al,
2019; Carabaña, 2013, 2015; Choi et al., 2018; Cobreros &
Gortazar, 2023; Cordero et al., 2014; García-Pérez et al., 2014;
González-Betancor & López-Puig, 2016; López-Rupérez et al., 2021).
However, within this group, estimations of the strength of the
relationship vary. For example, Arroyo et al. (2019, p. 85) stated
that for repetition, the preponderance of socioeconomic variables was
not clear, while Carabaña (2015, p. 24) noted that social determinants
were much less important in explaining repetition. At the other
extreme, Cobreros & Gortazar (2023) and the OECD (2016) concluded
that, for equal levels of competency, the 25% of students from the
lowest socioeconomic level were almost four times more likely to
repeat a grade than the 25% of students from the highest socioeconomic
level. The data from Choi et al. (2018) allow us to estimate that the
probability repeating a year for a student at the median of the lower
quartile of social status is 4.4 times higher than students at the
median of the upper quartile. Official reports, which generally
contain descriptive analyses, offer even more sobering estimations
that are compatible with a system that is highly reproductive of
inequalities in school access (Instituto Vasco de Evaluación e
Investigación Educativa [IVEI], 2009). The High Commission for Child
Poverty [
This variability of results, which is less than useful for designing educational policy, may at least in part be explained by the quality of study designs: studies with little control over selection bias and covariable adjustment tend to overestimate the adverse effects of repetition (Allen et al., 2009; Jackson, 1975; Lorence, 2006). In Spain, with few exceptions (López-Agudo et al., 2024; Rodríguez-Rodríguez, 2022), most research on repetition has been based on cross-sectional designs (Choi et al., 2018), where the main independent variable (generally results of an external test) is measured after the dependent variable (Carabaña, 2015). This may contaminate the conclusions, as it is impossible to ensure group equivalence (repeaters and non-repeaters) before the repetition, thus introducing selection bias into the calculations.
The aim of the present study is to estimate the probability of repetition for three groups of sociocultural status. Although this is not an original objective, our study provides a new perspective in two ways. Firstly, it uses a database that meets all of the desired characteristics for a high-quality study on repetition (Goos et al., 2021; Valbuena et al., 2021): it deals with a representative sample, it has a set of substantive covariables measured pre- and post-repetition, and it uses propensity matching analysis to minimise selection bias before repetition.
Secondly, the aforementioned characteristics of the database allow for an additional, novel objective in the literature on repetition in Spain: showing how variations in plans of analysis of the same data offer different estimations of the strength of the relationship between repetition and sociocultural status. To that end, the results of three models will be compared:
- Model 1: descriptive. Does not include control variables and reproduces the calculations in official reports (e.g., IVEI, 2009) and lower quality analyses.
- Model 2: cross-sectional. Recreates the results of the most
usual analytical-methodological approach in Spanish research:
multivariate regression analysis of an
ex post facto descriptive design (e.g., Cobreros & Gortazar, 2023) with post-repetition adjustment of covariables. - Model 3: longitudinal. This is the highest quality design as it includes a dual control: post-repetition adjustment of covariables and pre-repetition matching of groups to minimise selection bias (Krestschmann et al., 2019).
To the best of our knowledge, there are no studies in Spain to date that have included dual control pre- and post-repetition on a single sample. In light of previous evidence (e.g., Allen et al., 2009) the model with least control of bias is expected to show greater effects, in other words to overestimate the probability of low social status students repeating a year. In contrast, better experimental control is expected to demonstrate more moderate effects, which in certain conditions may even dilute statistical significance.
Method
The initial sample was made up of the 7,479 students who in practice comprised the student population in the 4th year of primary education in the Principality of Asturias in academic year 2008/09. All students were assessed at two timepoints, in the 4th year of primary and in the 2nd year of secondary education (ESO), labelled T1 and T2. In order to achieve as homogeneous a sample as possible, the following cases were removed from the original sample: students with insufficient information from before T1 (N = 100); those who repeated a year before T1 (N = 677); those who repeated at the end of their 4th year of primary, i.e., six weeks after T1 (N = 140); and those who did not participate at T2 either because they had moved or they were absent on the day (N = 554). The final sample comprised 5,999 students, all born in 1999, who were the same age and in the same school year at T1. Out of that sample, 762 would repeat a year between T1 and T2.
Information for this study came from three sources: administrative records, cognitive tests, and student context questionnaires.
Eight sociodemographic variables were considered.
Two were at the individual level, from the administrative records:
gender (1 =
Schooling and academic performance
were defined with 12 variables. The schooling measure was
Two socio-emotional variables were considered:
self-concept and academic effort. Students completed a context
questionnaire containing five statements such as, “I learn lessons
easily”. Each statement was scored on a four-point Likert type
scale: never or almost never; sometimes; usually; always or almost
always. The responses were used to construct the academic
self-concept scale (
Lastly, the academic effort variable
(
Procedure
The study is a secondary exploitation of the Asturian Educational
Diagnostic Evaluation [
ata analysis
As noted previously, in order to mitigate the biases inherent to all studies on repetition, this study used a dual control strategy: matching scores and fitting multilevel models.
Scores were matched via propensity score matching analysis (PSM), which is the most widely used approach in psychoeducational research on repetition (Krestschmann et al., 2019; Wu et al., 2010;). The aim is to match an experimental group (repeaters) with a control group (non-repeaters) so that they are equivalent before the treatment (repetition) (Stuart, 2010; Zhao et al., 2021). PSM follows a series of steps (Ho et al., 2011) that can be summarised in three stages: planning, execution, and evaluation of results.
The following matching variables were first selected for T1:
(1) sociodemographic factors,
In the execution phase, students in each group were matched based on their propensity scores, which were expressed as the conditional probability of receiving treatment (i.e., repeating) given the vector of specific covariables (Zhao et al., 2021). There are a range of matching methods, and the literature recommends comparing various options and choosing the one which offers the best balance (Austin, 2014). In this case we compared two types of algorithms. The first were matching methods of one-to-one cases: nearest neighbour without replacement, optimal pair matching, and genetic matching. The second type were algorithms that used non-uniform weighting: nearest neighbour with replacement, generalised full matching, and subclassification. To improve the matching balance, and depending on the possibilities offered by each method, customisations were included such as matching in specific order, restricting the distance between pairs, or matching with k > 1.
Finally, the matching method was selected based on two
criteria: balance strength and sample size. Each criterion
minimises one type of bias which are occasionally in opposition:
treatment effect and sample selection. Better balance indicates
suitable matching and therefore less bias when estimating the
effect of the treatment. However, if severe restrictions are
needed to achieve robust matching (such as only matching cases
with small differences in propensity scores), that would increase
the likelihood of excluding matches, which may introduce sample
selection bias or bias due to incomplete matching. In the present
study, balance was considered satisfactory when the standardised
differences between groups, and the differences in the empirical
cumulative distribution function (eCDF) were close to zero; and
the ratio of variances were close to one. Bias due to incomplete
matching was assessed using the percentage of discarded, unmatched
cases and the size of the effective sample achieved by each
algorithm. The matching was done using the
School phenomena are multilevel and, logically, each level of the hierarchy has a different variability and errors are not independent (Gaviria & Castro, 2005). Hierarchical or multilevel models are specifically developed to analyse data with a nested structure and address the problem of the “design effect” in cases where errors are not independent (Fernández-Alonso & Muñiz, 2019). In addition, because the dependent variable in the study is binary, it is unrealistic to assume normality. Because of that, we used the multilevel binary logistic model (Bernouilli), which allows use of various types of predictor variables (continuous, discreet, binary…) in all levels of analysis.
As noted at the end of the Introduction, three models were specified in this study. Model 1, which estimated the probabilities of each ISEC group repeating without control variables, has two functions: it serves as a comparison for the other models and recreates the raw estimations from the descriptive analysis. Model 2 includes the sociodemographic, school, cognitive, and socio-emotional variables measured at T2 and reproduces the estimations of a cross-sectional design—the most common design in Spanish research on repetition. Model 3 adds the weightings from matching groups prior to repetition and therefore has a double statistical control: adjustment of post-repetition covariables from the cross-sectional design, and matching groups pre-repetition (Krestschmann et al., 2019).
The results of these models are presented in terms of odds and odds ratios (OR). The latter allow us to compare the odds of different values of an independent variable, quantifying and indicating the direction of the association between the dependent variable and its predictors in the binary logistic regression. The analysis was done using HLM 7.0 (Raudenbush et al., 2011).
The amount of missing data ranged from 0% to 12% depending on
the variable. Data was recovered in two stages: where a case had
incomplete data in one variable, the missing data was replaced
with the subject mean. For completely missing values, we used the
Results
Before presenting the results of the adjusted models, it is necessary to offer evidence of the quality of the group matching at T1. This is fundamental for interpreting the comparison of the subsequent models, especially model 3, where it is assumed that the correlation between repetition and predictors in T1 (pre-repetition) is equal to 0.
The two best-balanced matching procedures were nearest neighbour without replacement (NN), from the one-to-one matching algorithms, and generalised full matching (GFM) from the non-uniform weighting algorithms. Ultimately, GFM was chosen because, unlike NN, it allows all the cases in the control group to be used, which is a preferred criteria when two matching procedures offer similar balance (Sävje et al., 2021). The matched sample was made up of 762 repeaters and 5237 non-repeaters, which is equivalent to an effective control sample of 395 cases.
Figure 1 shows the differences in standardised means between the groups before and after matching. Before matching, the circles indicate highly significant differences, with higher scores generally for the non-repeater group. For example, the difference in school grades was around 1.5 standard deviations. With this imbalance it would be impossible to determine whether potential differences found at T2 were due to having repeated a year or merely indicative of an initial discrepancy.
FIGURE I. Difference in means (Z scores) between the groups before and after matching.
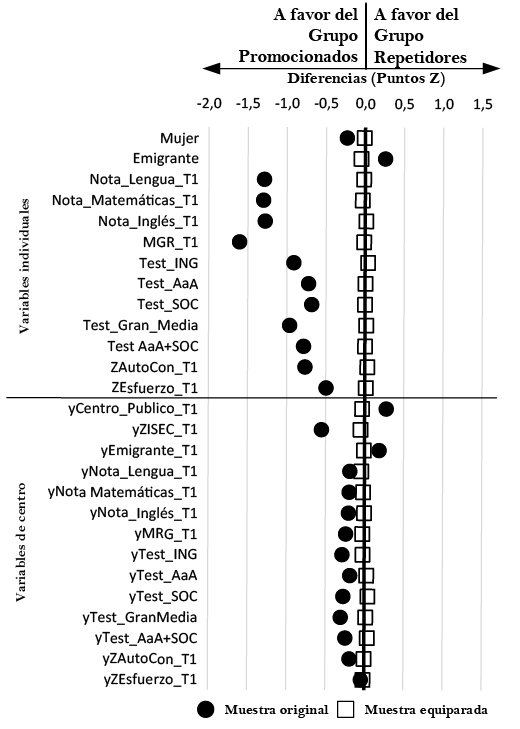
Note . GPA = Grade Point Average; ENG = English; LtL = Learn to Learn; CIV = Social and Civic Skills; ISEC = Socioeconomic and cultural index.Source: Compiled by the authors.
The squares show the differences after matching. All differences were smaller than |0.1|, hence the markers are around the value of Z = 0. The statistical matching created two groups that were comparable before any repetition in terms of previous performance, socio-emotional traits, and sociodemographic characteristics. This will allow us to discount any differences that may be found at T2 as being related to the matched variables at T1, minimising the bias of selecting the groups to compare.
Table 1 shows the results of the descriptive model. The intercept (-1.94) corresponds to the logit of ISEC_Medium, which had a low associated probability of repetition (OR = 0.14), and was quite precise given the narrow confidence intervals. The OR for the High_ISEC group (0.17) indicates a probability of repetition that was approximately 85% lower than the reference group, while the students in the Low_ISEC group were more than twice as likely to repeat a year than the Medium group and almost 13 times more likely (2.11 / 0.17) than the High group.
TABLE I. Model without adjustment covariables: prediction of repetition
| Fixed effects | Coefficient | Standard error | Odds Ratio | Confidence intervals |
|---|---|---|---|---|
| Intercept (Medium_ISEC) | -1.943 | 0.074 | 0.143 | (0.124;0.166) |
| High_ISEC | -1.792 | 0.154 | 0.167 | (0.123;0.225) |
| Low_ISEC | 0.749 | 0.088 | 2.114 | (1.781;2.511) |
Source: Compiled by the authors. |
||||
Table II shows the estimations of the cross-sectional model. On including the control variables, the probability of the Medium_ISEC group repeating fell by almost two thirds (OR = 0.06). The OR of the High group practically doubled (0.30), indicating that the probability of repeating fell by 70%, while in the Low_ISEC group, the probability of repeating was approximately 66% higher than the reference group, and 5.5 times higher than the High_ISEC group.
TABLE II. Cross-sectional model: prediction of repetition
| Fixed effects | Coefficient | Standard error | Odds Ratio | Confidence intervals | |
|---|---|---|---|---|---|
| Intercept (Medium_ISEC) | -2.901 | 0.148** | 0.055 | (0.041;0.074) | |
| Variables of interest | |||||
| High_ISEC | -1.207 | 0.185** | 0.299 | (0.208;0.430) | |
| Low_ISEC | 0.505 | 0.113** | 1.657 | (1.327;2.069) | |
| Individual variables | |||||
| Change school | 0.985 | 0.198** | 2.677 | (1.816;3.947) | |
| Girl | -0.266 | 0.098** | 0.766 | (0.632;0.929) | |
| Immigrant | 0.908 | 0.219** | 2.479 | (1.615;3.804) | |
| ZGPA_T2 | -1.389 | 0.103** | 0.249 | (0.204;0.305) | |
| ZSelf-Concept _T2 | -0.369 | 0.074** | 0.691 | (0.598;0.799) | |
| ZAcademic-Effort_T2 | -0.388 | 0.062** | 0.678 | (0.600;0.766) | |
| School variables | |||||
| yPublic_School_T2 | -1.055 | 0.202** | 0.348 | (0.234;0.519) | |
| yMigrant_T2 | 0.951 | 1.412 | 2.589 | (0.159;42.19) | |
| yZISEC_T2 | -0.756 | 0.149** | 0.469 | (0.350;0.630) | |
| yZGPA_T2 | -0.827 | 0.261** | 0.438 | (0.261;0.733) | |
| yZSelf-Concept _T2 | 0.004 | 0.436 | 1.004 | (0.424;2.380) | |
| yZAcademic-Effort_T2 | 0.177 | 0.304 | 1.194 | (0.655;2.179) | |
Source: Compiled by the authors. |
|||||
The main change in the longitudinal model (Table III) was in students in the Low_ISEC group. The coefficient was on the edge of statistical significance and the probability of them repeating was only 3% greater than the Medium_ISEC group. The effect when comparing the two extreme groups was also much reduced, practically by half. The OR of the Low_ISEC group was 2.4 times greater than the High_ISEC group. Some covariables at T2 lost their statistical significance due to the effect of the statistical matching at T1.
TABLE III. Longitudinal model: prediction of repetition
| Fixed effects | Coefficient | Standard error | Odds Ratio | Confidence intervals | |
|---|---|---|---|---|---|
| Intercept (Medium_ISEC) | -2.965 | 0.241** | 0.052 | (0.032;0.083) | |
| Variables of interest | |||||
| High_ISEC | -1.009 | 0.234** | 0.423 | (0.323;0.554) | |
| Low_ISEC | 0.410 | 0.172* | 1.030 | (0.872;1.217) | |
| Individual variables | |||||
| Change school | 0.554 | 0.272* | 0.807 | (0.443;1.468) | |
| Girl | 0.146 | 0.134 | 0.364 | (0.230;0.577) | |
| Immigrant | -0.215 | 0.305 | 1.507 | (1.075;2.111) | |
| ZGPA_T2 | -0.861 | 0.138** | 0.509 | (0.442;0.587) | |
| ZSelf-Concept _T2 | 0.030 | 0.085 | 1.158 | (0.890;1.505) | |
| ZAcademic-Effort_T2 | -0.675 | 0.073** | 0.807 | (0.443;1.468) | |
| School variables | |||||
| yPublic_School_T2 | -0.663 | 0.320* | 0.515 | (0.274;0.969) | |
| yMigrant_T2 | -2.748 | 2.133 | 0.064 | (0.001;4.342) | |
| yZISEC_T2 | -0.224 | 0.301 | 0.800 | (0.441;1.449) | |
| yZGPA_T2 | -0.734 | 0.476 | 0.480 | (0.187;1.230) | |
| yZSelf-Concept _T2 | -0.678 | 0.751 | 0.508 | (0.115;2.239) | |
| yZAcademic-Effort_T2 | 0.631 | 0.491 | 1.158 | (0.890;1.505) | |
Source: Compiled by the authors. |
|||||
Figure II shows an alternative way of comparing the models’ estimations. It shows the probability of each group repeating according to each model. The longitudinal model is the one that most reduces the probabilities of the Low and Medium groups repeating, while the probability of the High group repeating is relatively stable.
FIGURE II. Probability of repeating by model and ISEC group
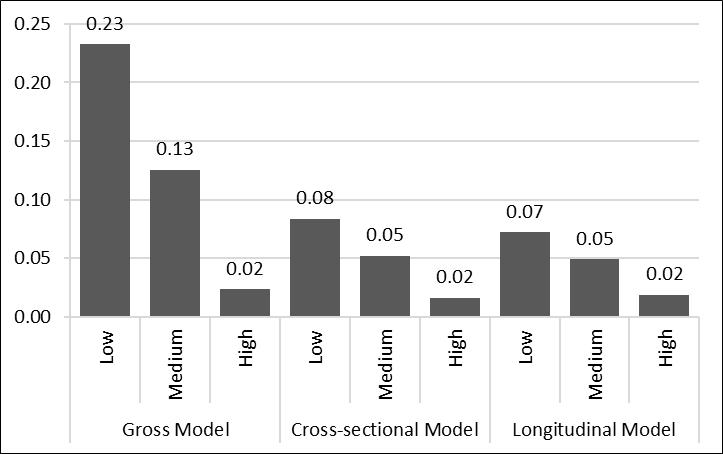
Source: Compiled by the authors.
Discussion
Educational research has mostly identified a negative relationship between indicators of social status and the likelihood of repetition. However, the conclusions have not been unanimous (e.g., Fernández & Rodríguez, 2008). Furthermore, in the studies that have found significant relationships, the estimations of the strength of the association have been varied (e.g., Carabaña, 2015; Cobreros & Gortazar, 2023). One plausible reason for these differences may lie in the design of these studies, as insufficiently controlling bias has been well documented to tend to lead to overestimation of the negative effects of repetition (Lorence, 2006).
In this context, the present study compared the probability of repetition according to socioeconomic and socio-cultural status, using a single database to estimate three analytical models that simulated a range of study designs: (1) descriptive, without controlling variables; (2) cross-sectional, with control of covariables post-repetition; and (3) longitudinal, with double control of bias, both pre- and post-repetition. To the best of our knowledge, this is the first study of its kind in Spanish research on the association between repetition and social status. The comparison was possible because the study was able to use a high-quality database allowing simulation of analysis conditions, gradually incorporating increased control of biases associated with repetition.
In line with most previous research (e.g., Choi et al., 2018; Cordero et al., 2014; García-Pérez et al., 2014; López-Rupérez et al., 2021), the study indicated that repetition is affected by social class. This has also been confirmed by research in various different education systems (e.g., Bastos & Ferrão, 2019; Ferrão et al., 2017; Klapproth & Schaltz, 2015; Salza, 2022; Xia & Kirby, 2009). However, our data suggest that, at least in the Spanish context, there is nuance to the relationship between repetition and social class. As one might expect, socio-cultural status had a strong impact on the probability of repetition in the descriptive model. Students in the Low ISEC group were more likely to repeat a year than their classmates in the Medium ISEC group, while those students in the High ISEC group were significantly more protected against the risk of repetition. Model 2 reproduced the estimations of cross-sectional analysis, the most common design in Spanish research. All of the covariables at T2 were significant, and once they were controlled for, the probability of Low_ISEC students repeating was 5.5 times higher than High_ISEC students doing so. This is similar to the calculations for Asturias (6.2 times higher) using data from the two most recent PISA tests (Cobreros & Gortazar, 2023).
The third model produced interesting changes, which can be
summarised in three conclusions. Firstly, compared to the
cross-sectional model (Model 2), the longitudinal model (Model 3)
reduced the difference in probabilities of repetition between the two
extreme ISEC groups (Low vs. High) by 56%, from 5.5 times to 2.4
times. This would seem to confirm that better control of biases
produces more conservative estimations of repetition’s negative
effects (Allen et al., 2009). Although there are Spanish studies that
have gone beyond adjusting for covariables in descriptive
Secondly, in the longitudinal model, the difference in Odds Ratios between the Low and Medium ISEC groups practically disappeared. This adds detail to previous conclusions on the relationship between repetition and social class. There is some consensus (e.g., Carabaña, 2015; García-Pérez et al., 2014) that repetition tends to be concentrated in children of mothers with little education, or in the minority whose parents had very low levels of education. Our data indicate an alternative interpretation, as the Low and Medium ISEC groups had very similar probabilities of repeating a year. In the Spanish context, where around a third of the school population repeat a year, this is not really surprising; with such a proportion, it would be unlikely that the middle class would be spared. So in light of the results of the longitudinal model, it seems more correct to say that in Spain, any child may end up having to repeat a year, except those from high socio-cultural status households.
Lastly, apart from the effect of social status, the longitudinal model identified two highly significant personal variables at T2, school grades and academic effort. In other words, the two fundamental criteria used by teaching teams to propose repetition. In this regard, the model offers a picture that is consistent with what one would expect (Carabaña, 2011).
These details should not hide the fact that our study’s overall conclusion is concerning. In Spain, given the same levels of learning difficulties, levels of effort, and other sociodemographic characteristics, social class has a different impact on teachers’ proposals for repetition. This should invite reflection about the context these decisions are made in and the consequences for equality in the system. Repetition is categorised as an extraordinary attention to diversity measure. However, something that affects 30% of students should not be considered so extraordinary. Our results reiterate the need to make such decisions cautiously in order to not contribute to increasing inequality in terms of accessing and remaining in the education system, or, as our data suggest, not reproducing the privileged situation of the minority with the highest socio-cultural status.
Finally, the data from our study must be interpreted in light of various limitations. Firstly, the two measurements were taken four school years apart. Having an intermediate timepoint would have allowed better monitoring of schooling pathways. Such a long time between the two timepoints may have allowed variations to be introduced that could have affected the results (Kretschmann et al., 2019). In addition, although the set of adjustment variables was relatively large, there were no specific measures of cognitive abilities and social relationships, and it was therefore impossible to know any effects of these types of variables, which seem to modulate the relationship between repetition and social status (Duran-Bonavila et al, 2024; Wu et al., 2010). Furthermore, the socio-emotional measures used in the study (self-concept and effort) were self-reported by the students, with all of the items worded positively. This means being unable to discount acquiescence bias in the socio-emotional scores (Hernández-Dorado et al., 2025; Primi et al., 2019). To address these limitations, future studies on repetition in Spain will need to use specific study designs that include following cohorts throughout their schooling and repeated measures pre- and post- repetition. This means designs using matched samples or some quasi-experimental approach (regression discontinuity, methods based on instrumental variables, or difference-in-difference analysis) and connecting repetition with medium- to long-term results, such as early dropout from education or employment outcomes.
In countries with high rates of repetition, such as Spain, there is
a
Supplementary Material
This paper has online supplementary material, which provides
details of the PSM analysis (comparison of matching algorithms,
evaluation of balance, and code examples):
Notes
Referencias bibliográficas
Agasisti, T., & Cordero, J. M. (2016). The determinants of
repetition rates in Europe: Early skills or subsequent parents’ help?
Allen, C. S., Chen, Q., Willson, V. L., & Hughes, J. N. (2009).
Quality of research design moderates effects of grade retention on
achievement: A meta-analytic, multi-level analysis.
Alto Comisionado contra la Pobreza Infantil (2020).
Arroyo, D., Constante, I. A., & Asensio, I. (2019). La
repetición de curso a debate: Un estudio empírico a partir de PISA
2015.
Austin, P. C. (2014). A comparison of 12 algorithms for matching on
the propensity score.
Ayres, L. P. (1909).
Bastos, A., & Ferrão, M. E. (2019). Analysis of grade
repetition through multilevel models: A study from Portugal.
Biegler, C. D., & Green, V. P. (1993). Grade retention: A
current issue.
Blanco-Varela, B., & Amoedo, J. M. (2025). Efectos de la
repetición escolar según el perfil socioeconómico del
estudiante.
Cabrera, L., Pérez, C., Santana, F. & Betancort, M. (2019).
Desafección escolar del alumnado repetidor de segundo curso de
Enseñanza Secundaria Obligatoria.
Calderón-Garrido, C., Navarro-González, D., Lorenzo-Seva, U., &
Ferrando, P. J. (2019). Multidimensional or essentially
unidimensional? A multi-faceted factor-analytic approach for assessing
the dimensionality of tests and items.
Carabaña, J. (2011). Las puntuaciones PISA predicen casi toda la
repetición de curso a los 15 años en España.
Carabaña, J. (2013). Repetición de curso y puntuaciones PISA ¿cuál
causa cuál? En Ministerio de Educación, Cultura y Deporte (Ed.),
Carabaña, J. (2015). Repetir hasta 4º de Primaria: determinantes
cognitivos y sociales según PIRLS.
Choi, Á., Gil, M., Mediavilla, M., & Valbuena, J. (2018).
Predictors and effects of grade repetition.
Cobreros, L, & Gortazar, L. (2023).
Consejería de Educación del Principado de Asturias (2016). La
repetición escolar: hechos y creencias.
Cordero, J. M., Manchón, C., & Simancas, R. (2014). La
repetición de curso y sus factores condicionantes en España.
du Toit, M. (2003).
Duran-Bonavila, S., Rodríguez-Gómez, A., & Becerril-Galindo, M.
(2024). Determinants of grade repetition in Spain. Analysis of
cognitive and socio-economic, mediated by ethnic factors.
European Education and Culture Executive Agency. (2011).
Fernández, J. J., & Rodríguez, J. C. (2008). Los orígenes del
fracaso escolar en España: Un estudio empírico.
Fernández-Alonso, R., Suárez-Álvarez, J., & Muñiz, J. (2012).
Imputación de datos perdidos en las evaluaciones diagnósticas
educativas [Imputation methods for missing data in educational
diagnostic evaluation].
Fernández-Alonso, R., & Muñiz, J. (2019). Calidad de los
sistemas educativos: modelos de evaluación.
Fernández-Alonso, R., Postigo, Á., García-Crespo, F. J., Govorova,
E., & Ferrer, Á. (2022).
Ferrando, P. J., & Lorenzo-Seva, U. (2017). Program FACTOR at
10: Origins, development and future
directions.
Ferrão, M. E., Costa, P. M., & Matos, D. A. S. (2017). The
relevance of the school socioeconomic composition and school
proportion of repeaters on grade repetition in Brazil: A multilevel
logistic model of PISA 2012.
García-Pérez, J. I., Hidalgo-Hidalgo, M., & Robles-Zurita, J.
A. (2014). Does grade retention affect students’ achievement? Some
evidence from Spain.
Gaviria, J. L., & Castro, M. (2005).
González-Betancor, S. M., & López-Puig, A. J. (2016). Grade
retention in primary education is associated with quarter of birth and
socioeconomic status.
Goodlad, J. I. (1954). Some effects of promotion and non-promotion
upon the social and personal adjustment of children.
Goos, M., Pipa, J., & Peixoto, F. (2021). Effectiveness of
grade retention: A systematic review and meta-analysis.
Greifer, N. (2023).
Heffernan. H., Gilbertson, E., Greenblatt, E., & Hills, J. A.
(1952). What research says about nonpromotion.
Hernández-Dorado, A., Ferrando, P. J., & Vigil-Colet, A.
(2025). The impact and consequences of correcting for acquiescence
when correlated residuals are present.
Ho, D. E., Imai, K., King, G., & Stuart, E. A. (2011). MatchIt:
Nonparametric Preprocessing for Parametric Causal Inference.
Holmes, C. T. (1989). Grade level retention effects: A
meta-analysis of research studies. In L. A. Shepard, & M. L. Smith
(Eds.),
Holmes, C. T., & Matthews, K. M. (1984). The effects of
nonpromotion on elementary and junior high school pupils: A
meta-analysis.
Hong, G., & Yu, B. (2008). Effects of kindergarten retention on
children´s social-emotional development: an application of propensity
score method to multivariate, multilevel data.
Hunt, C. S., & Seiver, M. (2017). Social class matters: Class
identities and discourses in educational contexts.
Instituto Nacional de Evaluación Educativa (2019).
Instituto Vasco de Evaluación e Investigación Educativa (IVEI).
(2009)
Jackson, G. B. (1975). The research evidence on the effects of
grade retention.
Jimerson, S. R. (2001a). Meta-analysis of grade retention research:
Implications for practice in the 21st century.
Jimerson, S. R. (2001b). A synthesis of grade retention research:
Looking backward and moving forward.
Klapproth, F., & Schaltz, P. (2015). Who is retained in school,
and when? Survival analysis of predictors of grade retention in
Luxembourgish secondary school.
Kretschmann, J., Vock, M., Lüdtke, O., Jansen, M., & Gronostaj,
A. (2019). Effects of grade retention on students’ motivation: A
longitudinal study over 3 years of secondary school.
López-Agudo, L.A., Latorre, C.P. & Marcenaro-Gutierrez, O.D.
(2024). Grade retention in Spain: The right way?
López-Rupérez, F., García-García, I., & Expósito-Casas, E.
(2021). La repetición de curso y la graduación en Educación Secundaria
Obligatoria en España. Análisis empíricos y recomendaciones políticas.
Lorence, J. (2006). Retention and academic achievement research
revisited from a United States perspective.
Mejía-Rodríguez, A. M., Luyten, H., & Meelissen, M. R. (2021).
Gender differences in mathematics self-concept across the world: An
exploration of student and parent data of TIMSS
2015.
Méndez, I., & Cerezo, F. (2018). La repetición escolar en
Educación Secundaria y factores de riesgo asociados.
Michavila, F., & Narejos, A. (2021).
Mullis, I. V. S., von Davier, M., Foy, P., Fishbein, B., Reynolds,
K. A., & Wry, E. (2023).
OECD (2010).
OECD (2016).
Peña-Suárez, E., Fernández-Alonso, R., & Fernández, J. M.
(2009). Estimación del valor añadido de los centros escolares.
Postigo, Á., Cuesta, M., Fernández-Alonso, R., García-Cueto, E.,
& Muñiz, J. (2021a). Academic grit modulates school performance
evolution over time: A latent transition analysis.
Postigo, Á., Cuesta, M., Fernández-Alonso, R., García-Cueto, E.,
& Muñiz, J. (2021b). Temporal stability of grit and school
performance in adolescents: A longitudinal
perspective.
Primi, R., Santos, D., De Fruyt, F., & John, O. P. (2019).
Comparison of classical and modern methods for measuring and
correcting for acquiescence.
R Core Team (2023).
Raudenbush, S. W., Bryk, A. S., Cheong, Y. F., Congdon, R. T.,
& Du Toit, M. (2011).
Rodríguez-Rodríguez, D. (2022). Grade Retention, Academic
Performance and Motivational Variables in Compulsory Secondary
Education: A Longitudinal
Study.
Salza, G. (2022). Equally performing, unfairly evaluated: The
social determinants of grade repetition in Italian high schools.
Sävje, F., Higgins, M., & Sekhon, J. (2021). Generalized Full
Matching.
Sekhon, J. S. (2011). Multivariate and propensity score matching
software with automated balance optimization: The matching package for
R.
Shepard, L. A., & Smith, M. L. (1989).
Shepard, L. A., & Smith, M. L. (1990). Synthesis of research on
grade retention.
Stuart, E. A. (2010). Matching methods for causal inference: A
review and a look forward.
Timmerman, M. E., & Lorenzo-Seva, U. (2011). Dimensionality
assessment of ordered polytomous items with Parallel Analysis.
Urbano, A., & Álvarez, L. (2019). La repetición de curso en la
adolescencia: Influencia de variables sociofamiliares.
Valbuena, J., Mediavilla, M., Choi, Á., & Gil, M. (2021).
Effects of Grade Retention Policies: A Literature Review of Empirical
Studies Applying Causal Inference.
Wu, W., West, S. G., & Hughes, J. N. (2010). Effect of grade
retention in first grade on psychosocial outcomes.
Xia, N., & Kirby, S. N. (2009).
Zhao, Q. Y., Luo, J. C., Su, Y., Zhang, Y. J., Tu, G. W., &
Luo, Z. (2021). Propensity score matching with R: conventional methods
and new features.
Información de contacto / Contact info: Laura M. Cañamero. Universidad de Oviedo, Facultad de Psicología, Departamento de Psicología. E-mail: lauramcanamero@uniovi.es