Contextual and non-cognitive variables and peer effect as factors associated with grade repetition in Spain
Variables contextuales, no cognitivas y el efecto pares como factores asociados a la repetición de curso en España
https://doi.org/10.4438/1988-592X-RE-2025-409-692
Fernando Martínez-Abad
Instituto Universitario de Ciencias de la Educación, Universidad de Salamanca
https://orcid.org/0000-0002-1783-8198
Susana Nieto-Isidro
Instituto Universitario de Ciencias de la Educación, Universidad de Salamanca
https://orcid.org/0000-0002-6751-9398
María José Rodríguez-Conde
Instituto Universitario de Ciencias de la Educación, Universidad de Salamanca
https://orcid.org/0000-0002-2509-1901
Abstract
Although it has slightly decreased in recent years, Spain remains one of the countries with the highest repetition rates. This study aimed to analyze the relationship between grade retention and both contextual and non-cognitive student factors in the Spanish PISA 2022 sample, with particular attention to the peer effect exerted by classmates on repetition. Using a sample of over 30,000 students and almost 1,000 schools, predictive variables were included both individually and aggregated at the school level to examine peer effects. Following a selection of variables associated with grade repetition based on their correlations, multilevel logistic regression models with fixed slopes and random intercepts were applied. The results contribute to previous studies by highlighting a significant impact of the student’s school environment on grade repetition. 15% of the variability associated with grade repetition can be explained by the grouping of students in schools. At the individual level, the contextual variables most strongly associated with repetition are family socioeconomic status and migration background. Among non-cognitive variables at the student level, the results indicate the significant protective effect of academic expectations, punctuality, perseverance, regular school attendance, and family support, as well as the risks associated with bullying, having numerous household responsibilities, or excessive use of ICT for leisure during the week. Additionally, the association between variables aggregated at the school level and individual repetition stands out. A higher percentage of female students in the school, high overall academic expectations, good overall levels of assertiveness among students, and appropriate use of ICT were found to exert a protective peer effect against grade repetition. Moreover, widespread poor eating habits or excessive domestic responsibilities emerge as risk factors displaying peer effects. The impact of these peer effects on grade retention raises questions about the strategies implemented within the educational system to promote academic success.
Keywords:
Grade retention, non-cognitive factors, contextual factors, multilevel logistic regression, compulsory secondary education
Resumen
Aunque ha disminuido ligeramente en los últimos años, España sigue
siendo uno de los países con una mayor tasa de repetición. El objetivo
de este estudio fue analizar la relación entre la repetición de curso y
tanto factores contextuales como no cognitivos del estudiante en la
muestra española de PISA 2022, incluyendo el análisis del efecto pares
que ejercen los compañeros sobre la repetición. Con una muestra superior
a 30000 estudiantes y casi 1000 escuelas, se incluyeron variables
predictoras tanto individualmente como agregadas al nivel escuela para
estudiar el efecto pares. Tras una selección de variables asociadas a la
repetición a partir de sus correlaciones, se aplicaron modelos
logísticos multinivel de pendientes fijas e interceptos aleatorios. Los
resultados aportan a los estudios previos que existe un impacto
significativo del entorno escolar del estudiante sobre la repetición de
curso. El 15% de la variabilidad asociada a la repetición de curso puede
explicarse por la agrupación de los estudiantes en escuelas. A nivel
individual, las variables contextuales de mayor asociación con la
repetición son el nivel socioeconómico familiar y el estatus migratorio.
Como variables no cognitivas, los resultados indican el importante
efecto protector de las expectativas académicas junto con la
puntualidad, la perseverancia, acudir siempre a clase o el apoyo
familiar, así como el riesgo asociado a recibir
Palabras clave:
Repetición de curso, factores no cognitivos, factores contextuales, regresión logística multinivel, educación secundaria obligatoriaIntroduction
Grade repetition is a complex phenomenon that can be analysed from
different perspectives and distinct levels (Bronfenbrenner, 1979). The
first level of analysis (
Thus, based on the CIPO model (Scheerens, 1990), the output (in this
case, grade repetition) causes contextual factors (demographic,
biological, cultural and socioeconomic inputs of students and their
surroundings), non-cognitive factors such as attitudes, beliefs,
personality, social and emotional qualities or learning processes
(Fonteyne et al., 2017) and cognitive
factors
Considering that recent papers delve into grade repetition at
exo-macro levels in the context of Spain (Nieto-Isidro &
Martínez-Abad, 2023), this study proposes advancing in knowledge of
factors associated with grade repetition at school and student levels
(
Data from the Organization of Economic Cooperation and Development (OECD) PISA 2022 assessment will be used for this study. Applying multi-level logistic regression models will be proposed for a multivariate analysis of the phenomenon of grade repetition, taking into account the existing interrelationship between meso- and micro-level factors.
Cultural, socioeconomic and political components of repetition
Grade repetition can be studied from a
In view of international assessments, it is clear that the percentage of students repeating grade varies greatly from country to country. In the specific case of the European Union, grade repetition policies vary greatly by country, from those that do not contemplate this option in legislation with automatic promotion during compulsory schooling, to countries with a high rate of repetition such as Spain (García-Merino et al, 2024). The 34-country study by Goos et al (2013), using data from PISA 2009, TALIS 2007 and education policy reports drafted by the OECD, also shows that up to 25% of grade repetition variability is at country/region level. Goos et all (2021) state that there is a cultural, social component that contemplates repetition as one of the valid tools in education systems to ensure students acquire the necessary knowledge and skills. On the other hand, repetition has consequences on educational, economic and social structures in countries and regions: repetition has been linked with academic failure, dropping out and less choice of university studies, as highlighted in various studies focusing on Spain (Calero et al, 2010; Calero et al, 2012; Choi, 2018; López-Rupérez et al, 2021; Suberviola, 2025) and other countries, for example Contini and Salza (2024) in Italy, Hughes et al (2028) and Jacob and Lefgren (2009) in the United States or Van Canegen et al (2023) in Belgium. Also, from a macro-level education policy-maker perspective, grade repetition is a highly ineffective measure from an economic point of view as it increases the cost of education and increases inequality (Calero et al,2012; López-Agudo et al 2014; López-Rupérez, 2021; OECD, 2011).
In the specific case of Spain, the study of factors related with
repetition from a
Repetition and schools
Secondly, a
How school characteristics affect repetition is also underlined in some studies in other countries: the most consistent outcome is the relationship between average school socioeconomic level, as in the study by Ferrão et al (2017) with PISA 2012 data in Brazil. The international review study by López et al. (2023) also identifies a low socioeconomic level and high percentage of immigrants as the most important school factors linked with repetition in public schools.
Repetition and student characteristics
Finally, at
These outcomes obtained with data from Spain are corroborated by different studies on repetition in other countries: for example, in a longitudinal study by Contini and Salza (2024) in Italy, repeating students are mostly male, immigrants and with parents with a low level of studies. Likewise, the longitudinal study by Klapproth and Schaltz (2015) with students from Luxembourg, adds following a lower academic path to the factors of gender, nationality and socioeconomic status. Goos et al. (2013) with PISA 2009 data in the 24 OECD countries, also find a direct relationship between grade repetition and gender (male), being an immigrant, low level of parent studies and language spoken at home. However, in the study by Ikeda and García (2014) with the same PISA 2009 data, the relationship between repetition and socioeconomic status is heterogeneous in the 30 countries analysed; the same occurs with the relationship between repetition and gender, immigration status or age. López et al. (2023) find a series of student-level variables linked with repetition; some are contextual, such as gender or being an immigrant, and others non-cognitive, like motivation problems and frequently playing video games. An inverse relationship between using computers for homework is also observed and a direct relationship with not having their own computer and having lower educational expectations to continue studying.
Among the non-cognitive factors, there is solid evidence that links repeating with educational and/or job expectations. In the case of Spain and with PISA 2015 data, Choi (2018) has demonstrated not only the role that academic expectations play on academic performance, but the relationship between these aspirations with family socioeconomic factors and with peer expectations, as well as the inverse relationship between grade repetition and expectations to complete higher studies and the direct relationship with expectations of abandoning the education system early. Also with PISA 2015 data in Spain, the study by Arroyo et al. (2019) indicates that students with lower educational aspirations are more likely to repeat. An analysis by Constante-Amores et al. (2022), with PISA 2018 data from Spain, points out that expected student status is a significant predictor of grade repetition both in primary and compulsory secondary education. In the study mentioned by Álvarez-García et al. (2024) with the Spanish PISA 2022 sample, the group of students with a higher rate of repeaters also has lower future aspirations.
Is repeating beneficial for students?
Scientific research on the possible benefits or detriments of repeating is far from conclusive and depends greatly on the methodological quality of the studies (Allen et al., 2009).
By analysing the effect of repeating on performance, one of the difficulties found is the difference between comparing repeating students with their classmates (younger) or comparing them with their peers (a grade higher). Thus, Bonvin et al. (2008) found a positive effect in short- and medium-term performance in primary education students in Switzerland when comparing students of the same level, but the effect is negative when comparing students of the same age. In a longitudinal study, Wu et al. (2008) also found interesting effects: repeating students, when compared with their peers of the same age, show lower short-term performance in mathematics and reading, but this performance is higher in the long term, while if compared with students in the same grade, increased performance is higher in the short term but reduces in the long term.
Some longitudinal studies show certain positive effects of repeating, with a slight increase in academic performance that generally drops over time (Allen et al., 2009; Klapproth et al., 2016; Marsh, 2016). Many voices both in Spain (Calero et al, 2010; Calero et al., 2012; Choi et al., 2018; León & Martínez-Abad, 2025; López-Agudo et al., 2024; Rodríguez, 2022; Rodríguez & Batista, 2021) and in other countries (Allen et al., 2009; Bonvin et al., 2008; Contini & Salva, 2024; Ehmke et al., 2010; Lamote et al., 2014, OECD, 2011) point to repeating a grade as an ineffective method for improving medium- and long-term student performance (Goos et al., 2021; Valbuena et al., 2021).
Studies on the relationship between repeating and non-cognitive variables also show a negative effect. In Spain, the study by Rodríguez and Batista (2021) with compulsory secondary education students in the Canary Islands, found a lower academic self-concept in repeating students compared to those who did not repeat; the study by León and Martínez-Abad (2025), with data from the Spanish PISA 2022 sample, shows a negative causal effect of repetition on student mathematical self-efficiency.
These same results are reproduced in other countries. Martin (2011) uses Australian students to show the relationship between grade repetition and lower academic motivation, engagement and self-concept, as well as the negative effects in relations with classmates and self-esteem; Peixoto et al. (2916) also found a drop in academic self-concept and self-esteem among repeating Portuguese students compared to their non-repeating peers. The study by Klapproth et al. (2016) with secondary students in Luxembourg found a slight decrease in the self-esteem of repeating students compared to their non-repeating classmates. In the longitudinal study by Kretschmann, et al. (2019) with German compulsory secondary education students found no improvement in student academic self-concept after repeating.
Other studies report beneficial outcomes of repeating at short-term, non-cognitive level: Ehmke et al. (2010) with secondary students in Germany found positive effects one year later in the mathematical self-concept of repeating students; Bonin et al. (2008) found a rise in academic self-concept, social acceptance and attitudes towards school in repeating students in Switzerland when compared to low-performance students passing grade, although this effect diminishes over the academic year. Meanwhile, when studying mathematical self-concept with PISA 2003 data in 41 countries, Marsh (2016) found a positive effect in the case of repeating grade and negative for moving up a grade. In the paper by Pipa et al. (2023) with Portuguese students, repeating students show no difference in self-esteem or short-, medium- and long-term aspirations; they do, however, show a short-term increase in academic self-concept that drops over time. This short-term rise in self-concept is also an outcome of the study by Lamote et al. (2014) with secondary students in Belgium.
Study objectives
Although studies on factors associated with repeating in Spain are numerous, they fundamentally focus on detecting contextual factors at school and student levels. However, while literature on the effect of non-cognitive student factors is more limited, few studies are available that pay attention to the role peers play in grade repetition. So the primary objective of this study is to analyse the relationship between the main contextual and non-cognitive personal factors and grade repetition, differentiating between the effect of these factors on repetition at individual student level and the peer effect exerted by the characteristics of their classmates.
The specific study objectives are:
- Student’s grade repetition status was used as a criterion
variable (
REPEAT in PISA). This variable is dichotomous, with values 0 (non-repeater) and 1 (has repeated at least one grade). - Relevant contextual variables (gender, immigration status, socioeconomic level, school ownership, student-teacher ratio, school resources available, etc.) and non-cognitive variables (academic and job expectations, class attendance, school climate, socio-emotional skills, use of ICTs, personal well-being, etc.) were included as predictor variables to respond to the objectives proposed.
Method
Secondary quantitative analyses were applied using PISA 2022 databases following a positivist research approach. PISA is the most important large-scale assessment worldwide in terms of number of participating countries. It allows us to monitor and compare the quality, equity and efficiency levels of national education systems (OECD, 2022), establishing a competency-based approach when measuring academic performance (OECD, 2023). Given that PISA tests offer panel data of participating countries every three years, a non-experimental, cross-sectional design was used to analyse panel data.
Population and sample
Based on the population of 15-16-year-old students at Spanish schools offering compulsory secondary education, a sample of n=30,800 students and m=966 schools was included.
PISA 2022 ensures population representativeness by applying stratified probability sampling (by ownership and subregion) by clusters (schools) in two stages with probabilities proportional to size. In fact, the Spanish sample was the largest of all countries assessed in PISA 2022 as it included representative samples for each autonomous region and city. Table I shows sample distribution by some characterisation variables.
TABLE I. Sample characterisation
| Variable | Distribution |
|---|---|
| Grade repetition (REPEAT) | Never repeated: 78.3% Repeated at least once: 21.7% |
| Gender (GENDER) | Woman: 49.5% Man: 50.5% |
| Immigration status (IMMIG) | Native: 84.9% Second-generation immigrant: 8.8% First-generation immigrant: 6.3% |
| Skipping class (SKIPPING) | No class skipped (last two weeks): 58.1% At least one class skipped (last two weeks): 41.9% |
| Late for class (TARDYSD) | Always on time (last two weeks): 59.7% Occasionally late (1-2 times in last two weeks): 26.1% Frequently (3 or more times in last two weeks): 14.2% |
|
Compulsory secondary education: 4.2% Intermediate VT: 3.6% Baccalaureate: 13.0% Advanced VT: 13.0% Undergraduate degree: 18.0% Master’s degree: 28.1% Doctoral thesis: 20.0% |
| Job prospects (SISCO) | No clear idea about future work: 15.2% Clear idea about future work: 84.8% |
| School ownership (SCHLTYPE) | Public school: 58.1% State-subsidised private school: 31.5% Private school: 10.4% |
Source: Prepared by authors
Variables and instruments
Given the secondary nature of this study, instrumentation for
obtaining outcomes is defined and implemented by the OECD. While some
variables included are simple indicators obtained directly from the
context questionnaires applied, others are compound factors obtained
from blocks of items applied to students and management teams. The full
instrumentation and items including compound factors are explained in
detail in the OECD
More specifically, in this study we can differentiate between criterion and predictor variables:
Procedure and data analysis
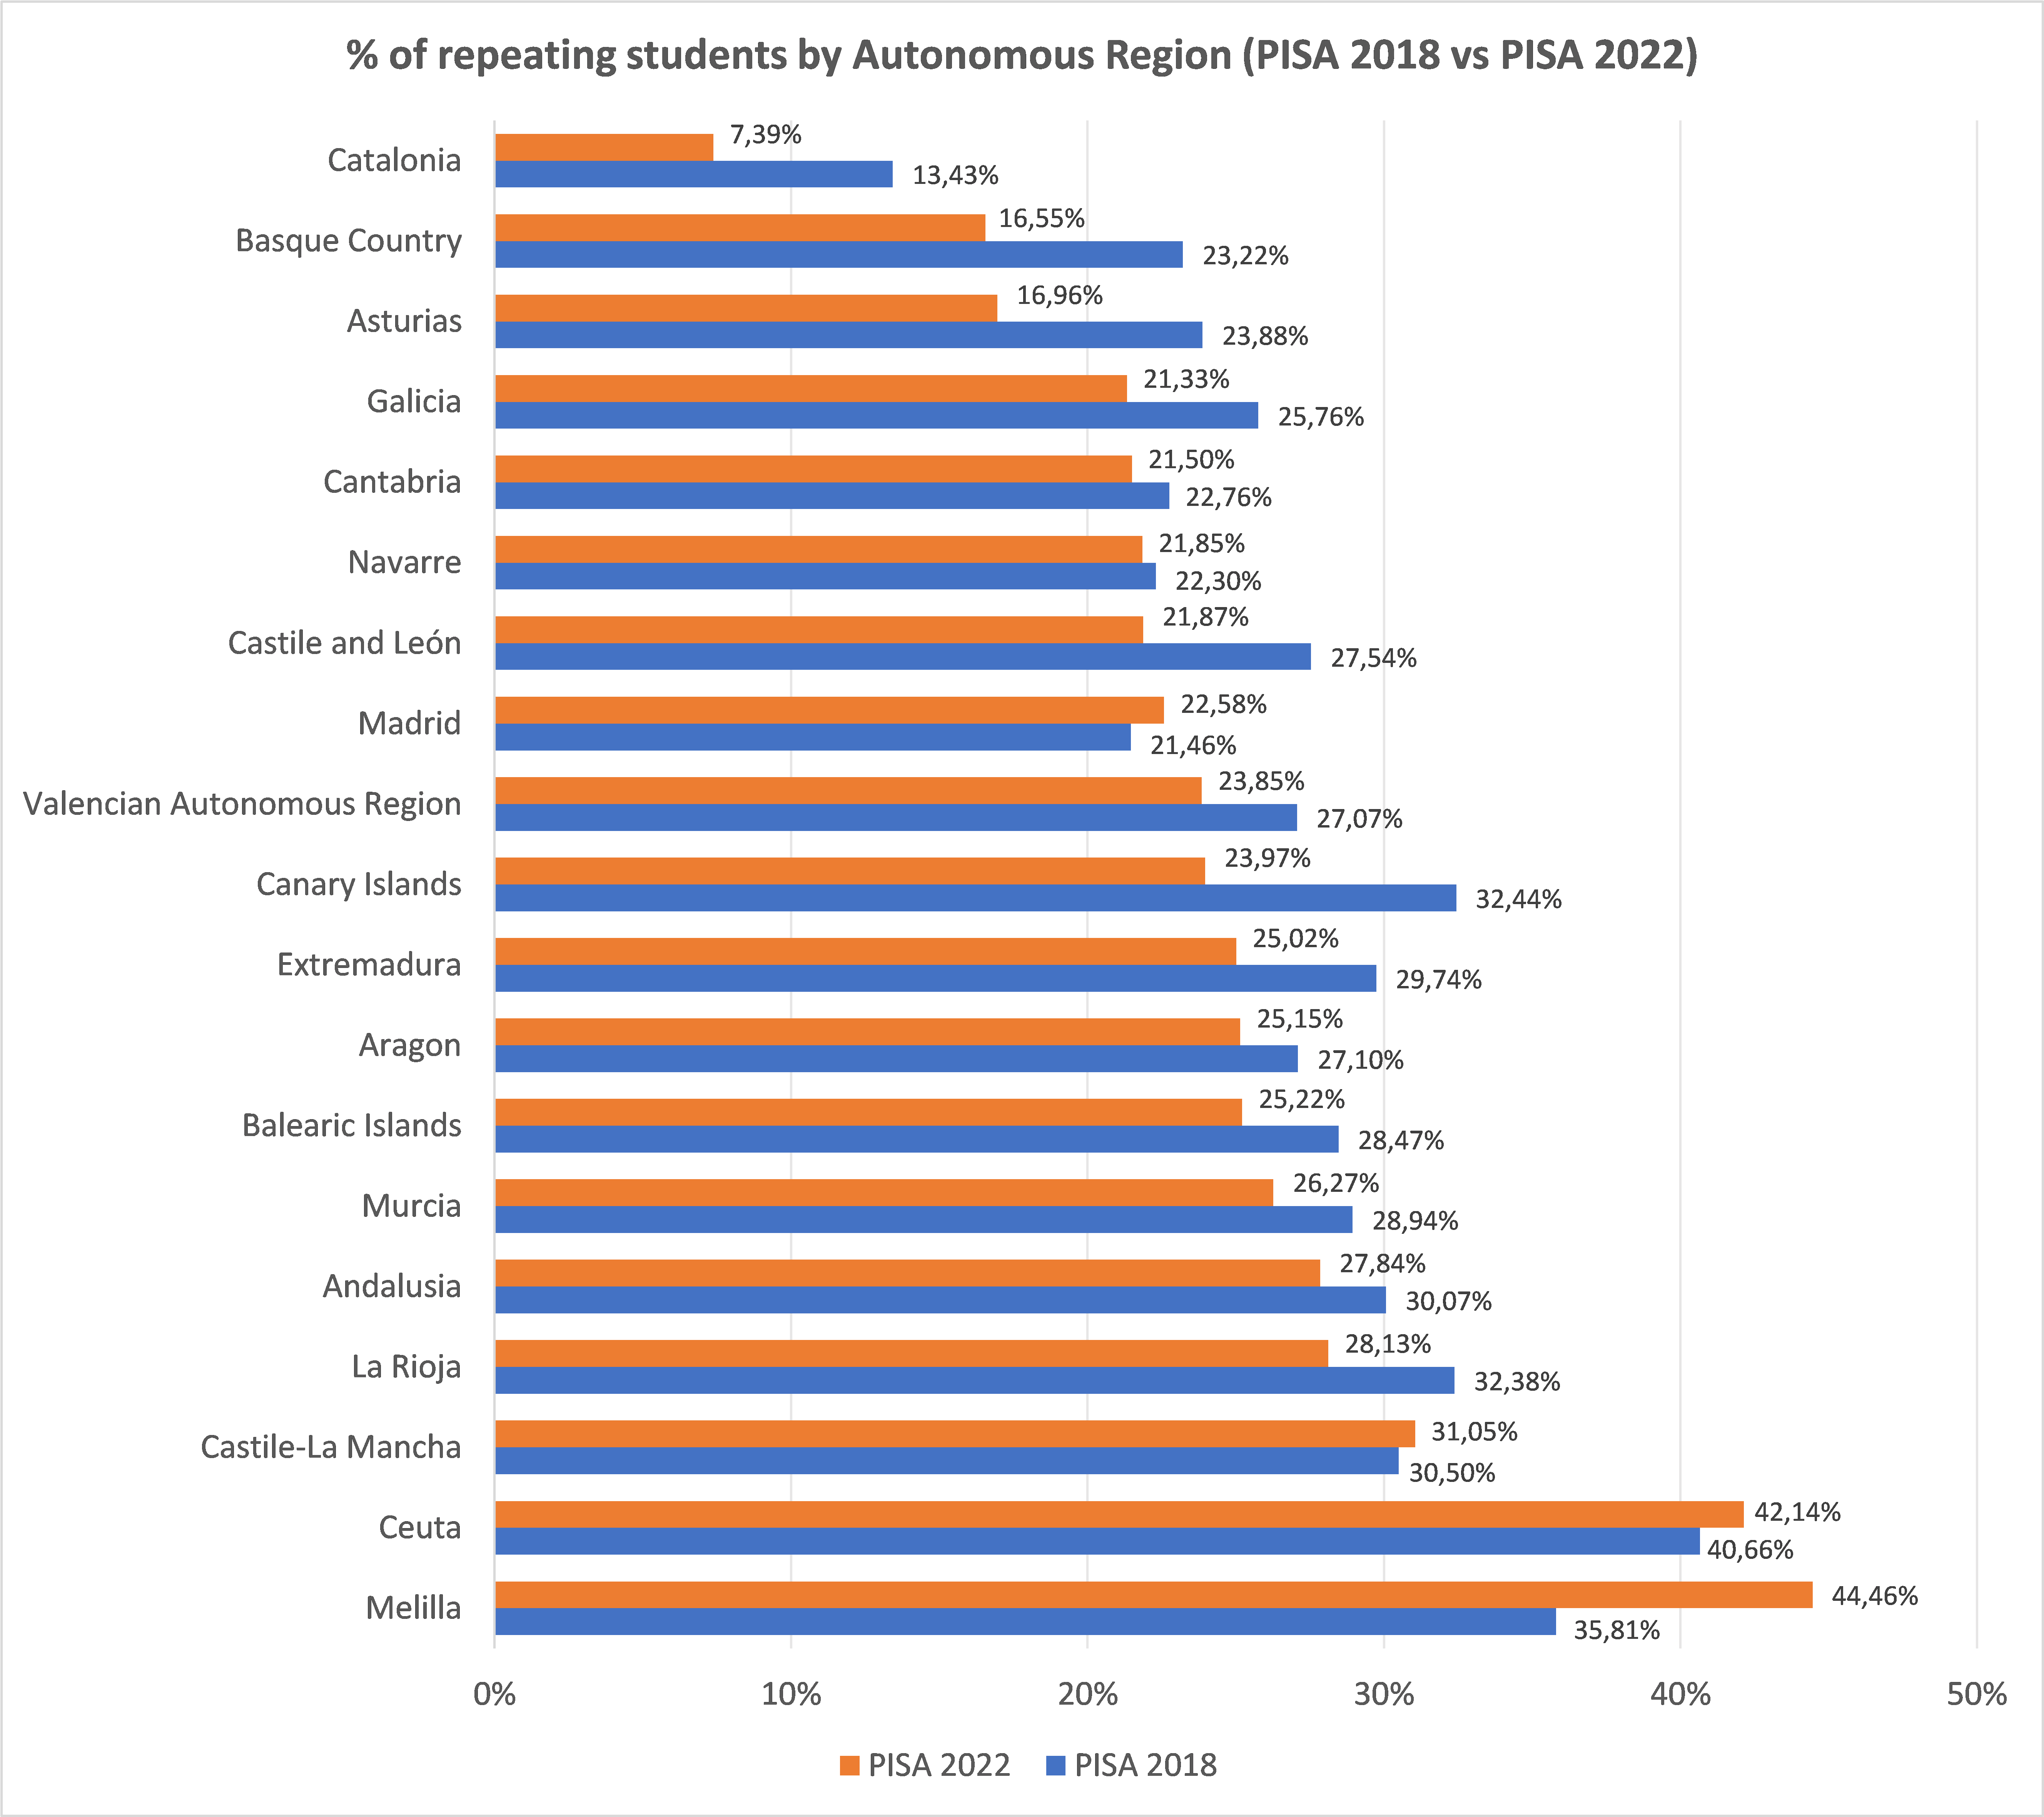
According to PISA 2022 data, students in the Spanish sample have a grade repetition rate in the 2022 wave of 21.7%. This figure is a slight improvement compared to the PISA 2018 rate, which was 28.7%, but continues to rank Spain fourth in repetition percentage only behind Colombia, Belgium and the Netherlands and far exceeding the OECD average of 9.1%.
Figure 1 shows the percentage of repeating students by Autonomous Region in the last two PISA waves (2018 and 2022). The greatest reductions can generally be observed in Regions that already had the lowest levels in 2018, increasing the gap between regions, especially compared to the autonomous cities of Ceuta and Melilla where the percentage rises considerably.
FIGURE I. Percentage of repeating students by Autonomous Region in Pisa 2018-2022
Source: Prepared by authors based on PISA data
Procedure and data analysis
According to PISA 2022 data, students in the Spanish sample have a grade repetition rate in the 2022 wave of 21.7%. This figure is a slight improvement compared to the PISA 2018 rate, which was 28.7%, but continues to rank Spain fourth in repetition percentage only behind Colombia, Belgium and the Netherlands and far exceeding the OECD average of 9.1%.
Figure 1 shows the percentage of repeating students by Autonomous Region in the last two PISA waves (2018 and 2022). The greatest reductions can generally be observed in Regions that already had the lowest levels in 2018, increasing the gap between regions, especially compared to the autonomous cities of Ceuta and Melilla where the percentage rises considerably.
FIGURE I. Percentage of repeating students by Autonomous Region in Pisa 2018-2022
Source: Prepared by authors based on PISA data
Correlational study results
Table II shows the significant bivariate correlations obtained
between grade repetition and the student’s personal contextual factors
at both individual (L1) and school level (L2) where at least one is of
high intensity: the full table is available in
Of all the variables included, only two show moderate or high intensity associations at both student and school levels: immigration status (IMMIG) and socioeconomic level (ESCS). While lower socioeconomic levels are clearly associated with grade repetition, being an immigrant is also linked to repeating.
Notable correlations can be observed at school level in the case of gender and age. While schools with a higher proportion of women have a lower rate of repeating students, a higher proportion of younger students is associated with a higher grade repetition rate.
TABLE II. Bivariate correlation between grade repetition and personal contextual variables
| Student contextual variables | Personal level (L1) | School level (L2) |
|---|---|---|
| Gender (GENDER) | .079* | .330 |
| Age (AGE) | -.073* | -.126 |
| Immigration status (IMMIG) | .160 | .243 |
| Socioeconomic level (ESCS) | -.322 | -.542 |
| ICTs available in the school (ICTSCH) | .008* | .113 |
| ICTs available in the home (ICTHOME) | -.069* | -.222 |
| Quality of ICT access (ICTQUAL) | -.038* | -.154 |
| Body mass (STUBMI) | .086* | .396 |
| COVID-19 problems (PROBSELF) | .074* | -.150 |
* Very low-intensity correlation
Source: Prepared by authors
Table III shows significant bivariate correlations obtained between
grade repetition and moderate or high-intensity school level contextual
factors
TABLE III. Bivariate correlation between grade repetition and school contextual variables
| Student contextual variables | School level (L2) |
|---|---|
| School ownership (SCHLTYPE) | .171 |
| Teachers with PhD (PROPAT8) | -.107 |
| Support teachers (PROPSUPP) | -.122 |
| Preparation for digital learning (DIGPREP) | -.120 |
Source: Prepared by authors
Table IV shows bivariate correlations between grade repetition and non-cognitive personal factors in L1 and L2, where at least one of the two levels has moderate or high-intensity associations4. Non-cognitive variables have a less intense and clear trend than contextual variables in their association with grade repetition.
So, some factors such as bullying suffered (BULLIED), perseverance (PERSEVAGR) or academic support from family (FAMSUP) exert a significant effect at student level but very low or insignificant at school level. The different variables linked with handling ICTs (ICTFEED, ICTWKEND, ICTWKDY, ICTREG) appear to have more important effects at school level than student level, as do other variables such as assertiveness (ASSERAGR), physical exercise (EXERPRAC), doing homework (STUDYHMW) or job expectations (SISCO). Meanwhile, other variables affect student and school level to a similar degree, such as skipping classes (SKIPPING) or being late (TARDYSD), doing household chores (WORKHOME) or connection with the family (SOCONPA). Academic expectations (EXPECEDU) is the non-cognitive variable with the greatest bivariate association with repeating at both student and school level. The association is very intense at school level, therefore, schools where the academic expectations of students are generally high clearly have a lower repetition rate.
TABLE IV. Bivariate correlation between grade repetition and non-cognitive variables
| Non-cognitive variables | Personal level (L1) | School level (L2) |
|---|---|---|
| Skipping class (SKIPPING) | .113 | .145 |
| Late for class (TARDYSD) | .145 | .196 |
| Exercise (EXERPRAC) | .068* | -.199 |
| Homework (STUDYHMW) | -.038* | -.144 |
| Household chores (WORKHOME) | .103 | .154 |
| Academic expectations (EXPECEDU) | -.274 | -.573 |
| Job prospects (SISCO) | -.027* | .126 |
| Bullying suffered (BULLIED) | .109 | -.039* |
| Perseverance (PERSEVAGR) | -.116 | -.068* |
| Assertiveness (ASSERAGR) | -.078* | -.317 |
| Academic support from family (FAMSUP) | -.112 | -.002** |
| Feedback by ICT (ICTFEED) | -.025* | -.255 |
| ICT use for leisure at weekend (ICTWKEND) | .079* | .092 |
| ICT use for leisure during week (ICTWKDY) | .112 | .234 |
| School ICT regulation (ICTREG) | -.027* | -.128 |
| Connection with family (SOCONPA) | -.116 | -.175 |
* Very low-intensity correlation
**Insignificant correlation
Source: Prepared by authors
Multi-level analysis results
Note that initially more than 15% of variability of the repeater variable can be explained by student grouping in schools (ICI=15.21%), so it is appropriate to create a multi-level model including school-level variables.
As for the multi-level models applied (Table V), the initial contextual model, which only includes student contextual variables in L1 and aggregated to L2, mainly maintains variables added to L2, except immigration status (which only affects L1) and socioeconomic level (with significant effects in both levels). There is therefore a clear peer effect in explaining grade repetition, which emerges along with the significant known effects of individual student characteristics, fundamentally contextual.
As expected, personal contextual variables have the highest effect on grade repetition in the complete model, primarily family socioeconomic level (ESCS), which significantly reduces the likelihood of repeating; a single-unit increase in this variable reduces likelihood by 65.3%. Immigrant status (IMMIG) is another high-impact factor; if all other variables remain stable, immigrant students are 67.6% more likely to repeat than other students.
As noted above, a relevant finding is the importance of peer effect in grade repetition as numerous student contextual variables aggregated in L2 have significant effects, such as proportion of male students (GENDER), which potentially increases likelihood of repeating by more than 10% at individual level. Other variables exerting an interesting peer effect seem to indicate a direct link between grade repetition and school contexts with bad eating habits (STUBMI) or an inverse association with the students’ average month of birth (AGE). As for purely school contextual variables, first we find that school ownership (SCHLTYPE) has practically no effect in the complete model. On the other hand, teacher training (PROPAT8) and school preparation for digital teaching (DIGPREP) appear to be factors that protect from grade repetition.
Non-cognitive factors include important factors associated with a higher risk of grade repetition, such as the student’s obligations at home (WORKHOME), bullying suffered (BULLIED) or daily ICT use for leisure activities (ICTWKDY). The main factors that protect from grade repetition are punctuality (TARDYSD-never), not skipping class (SKIPPING-never), student’s own academic expectations (EXPECEDU), academic support from family (FAMSUP) and perseverance (PERSEVAGR).
Interesting peer effects can also be found in non-cognitive factors that exercise a protective peer effect against grade repetition. Mainly: general educational expectations, punctuality, physical exercise (EXERPRAC), good student relationships with their families (SOCONPA) and general levels of assertiveness (ASSERAGR) among students. Other protective factors aggregated at school level including the use of ICTs to give students feedback (ICTFEED) and clear regulation on ICT use in school (ICTREG), as well as use of ICTs for leisure activities restricted to the weekend (ICTWKEND).
At the other end of the spectrum we find aggregated non-cognitive factors that increase the risk of grade repetition. This is the case of excessive homework (STUDYHMW), a significant proportion of students with household obligations and the use of ICTs for leisure on school days (ICTWKDY).
TABLE V. Multi-level logistic regression (logit) models
| Contextual model | Complete model | |||||
|---|---|---|---|---|---|---|
| t | P | POR* | t | P | POR* | |
| Intercept | -36.443 | <.001 | -30.161 | <.001 | ||
| L1-IMMIG (natives) | -15.288 | <.001 | -.448 | -16.184 | <.001 | -.607 |
| L1-IMMIG (immigrants) | 14.410 | <.001 | .597 | 12.876 | <.001 | .676 |
| L1-ESCS | -78.998 | <.001 | -.837 | -54.768 | <.001 | -.653 |
| L1-GENDER (aggr.) | 17.600 | <.001 | .131 | 10.971 | <.001 | .107 |
| L1-AGE (aggr.) | -14.053 | <.001 | -.106 | -5.393 | <.001 | -.049 |
| L1-ESCS (aggr.) | -11.205 | <.001 | -.110 | |||
| L1-ICTSCH (aggr.) | 14.283 | <.001 | .131 | 13.090 | <.001 | .123 |
| L1-ICTHOME (aggr.) | -3.385 | .001 | -.026 | |||
| L1-ICTQUAL (aggr.) | -2.633 | .008 | -.022 | 9.361 | <.001 | .116 |
| L1-STUBMI (aggr.) | 24.246 | <.001 | .191 | 8.919 | <.001 | .090 |
| L1-PROBSELF (aggr.) | -10.496 | <.001 | -.071 | -6.800 | <.001 | -.069 |
| L2-SCHLTYPE (public) | 10.321 | <.001 | .206 | -2.369 | .018 | -.055 |
| L2-PROPAT8 | -16.657 | <.001 | -.147 | -7.395 | <.001 | -.077 |
| L2-PROPSUPP | -3.990 | <.001 | -.031 | |||
| L2-DIGPREP | -8.207 | <.001 | -.070 | -5.570 | <.001 | -.058 |
| L1-SKIPPING (never) | -16.217 | <.001 | -.335 | |||
| L1-TARDYSD (never) | -20.417 | <.001 | -.515 | |||
| L1-TARDYSD (frequent) | 4.225 | <.001 | .123 | |||
| L1-WORKHOME | 33.156 | <.001 | .349 | |||
| L1-EXPECEDU | -53.563 | <.001 | -.572 | |||
| L1-BULLIED | 17.112 | <.001 | .164 | |||
| L1-PERSEVAGR | -10.302 | <.001 | -.110 | |||
| L1-FAMSUP | -13.503 | <.001 | -.127 | |||
| L1-ICTWKDY | 18.307 | <.001 | .202 | |||
| L1-TARDYSD (aggr.) | -4.310 | <.001 | -.048 | |||
| L1-EXERPRAC (aggr.) | -9.356 | <.001 | -.085 | |||
| L1-STUDYHMW (aggr.) | 13.614 | <.001 | .142 | |||
| L1-WORKHOME (aggr.) | 2.379 | .017 | .024 | |||
| L1-EXPECEDU (aggr.) | -17.317 | <.001 | -.212 | |||
| L1-ASSERAGR (aggr.) | -17.414 | <.001 | -.195 | |||
| L1-ICTFEED (aggr.) | -19.459 | <.001 | -.268 | |||
| L1-ICTWKEND (aggr.) | -11.337 | <.001 | -.202 | |||
| L1-ICTWKDY (aggr.) | 10.347 | <.001 | .194 | |||
| L1-ICTREG (aggr.) | -3.169 | .002 | -.029 | |||
| L1-SOCONPA (aggr.) | -4.158 | <.001 | -.047 | |||
* Proportion increase in the likelihood of repeating by increasing the predictor variable by 1 unit.
Source: compiled by authors
Both models had a good fit (Table VI) with prediction accuracy levels over 80% in both cases, although the complete model achieved significantly higher overall accuracy than the contextual model. Specifically, while the true negative rate (specificity) is around 98% in both models, the true positive rate (sensitivity) increases from just over 12% in the contextual model to almost 20% in the complete model. This low level of sensitivity is because the percentage of repeating students represents approximately one fifth of all students in the sample used, which makes it difficult to identify these subjects in the model.
TABLE VI. Regression model confusion matrix
| Observed scores | Contextual model | Complete model | ||||
|---|---|---|---|---|---|---|
| Predicted scores | Predicted scores | |||||
| Non-repeater | Repeater | Non-repeater | Repeater | |||
| Non-repeater | Freq. | 125701 | 2862 | 107292 | 2533 | |
| rows % | 97.8% | 2.3% | 97.7% | 2.3% | ||
| Repeater | Freq. | 25851 | 3573 | 16471 | 4009 | |
| rows % | 87.9% | 12.1% | 80.4% | 19.6% | ||
| Accuracy | 81.8% | 85.4% | ||||
Conclusions
The main goal was to study the relationship between contextual and non-cognitive factors and grade repetition in secondary education in Spain, distinguishing between the direct effect these factors exert at student level (L1) and the peer effect, i.e., the effect mediated by the contextual and non-cognitive characteristics of classmates. Our results indicate that, in addition to the great importance of individual factors already studied in prior literature such as family socioeconomic and cultural level, peer effect exerts a key influence on grade repetition. In view of the importance given to this matter in prior literature, we understand it to be the primary contribution of this paper.
A series of individual contextual and non-cognitive factors are related with the likelihood of repeating grade. Contextual variables include socioeconomic level and immigration status. Based on our results, gender is not associated with grade repetition in Spain —at least at individual level—, the same as ICTs available in school or in the home. In this sense, there are some discrepancies with the recent study by Álvarez-García et al. (2024), which uses a data mining analytical approach and in which socioeconomic status and ICT use in the home and at school are the three main predictors of categorisation of Spanish students who completed PISA 2022. These discrepancies may be because the study by Álvarez-García et al. (2024) focuses on student grouping by similar profiles and not on identifying factors associated with grade repetition.
As for individual non-cognitive variables, the most important variables that protect from grade repetition are academic expectations, punctuality and attendance, and not having a significant load of household chores. In line with Álvarez-García et al. (2024), these results along with other, less relevant associated factors such as family support and control of ICT use for leisure at the weekend reveal how important it is for the student to be surrounded by a stable, motivating family environment that favours their personal and academic development and actively controls their academic activities.
When analysing the role of schools, the most significant contribution of this study is ascertaining that there is a significant peer effect on grade repetition in compulsory secondary education in Spain. Along with immigration status, socioeconomic level, academic expectations and attendance —variables with significant effects at student level—, aggregated school characteristics have a major link with the likelihood of repetition. This result, which apparently contradicts the results obtained by Constante et al. (2024), where individual variables gained a much higher weight than school variables in predicting grade repetition, is explained because these authors did not aggregate L1 variables at school level. In fact, this interpretation is reaffirmed when taking into account that student grouping by school explains more than 15% of total grade repetition variability in our study. So our results confirm that, while factors exclusive to the school level (such as ownership, teacher training or support teacher availability) are marginally associated with grade repetition (Constante et al., 2024), there are school environments related with general student characteristics that exert a protective or risk effect on a student repeating a grade.
The main individual contextual characteristics that exert a peer effect on grade repetition when aggregated, with effects superior to school contextual characteristics, are the proportion of male students, presence of ICTs in the school and school activities, and bad student eating habits. These results delve deeper into the claims made by authors such as Choi (2018) who, with regard to the association between gender and grade repetition, state: not only is being male directly associated with grade repetition, but being in a school with a higher proportion of male students is associated with a higher individual likelihood of repeating a grade, regardless of the student’s gender. Evidence on the peer effect of using ICTs and diet are new additions and open up new lines for future research.
As for aggregated non-cognitive variables, academic expectations again play one of the most relevant roles. Not only are personal expectations associated with repetition (Choi, 2018), but attending a school where students have low aggregate expectations increases the likelihood of grade repetition. Again we find factors linked with ICT use, although in this case with controversial results that merit more in-depth analysis in future studies: while contexts with widespread use of ICTs for leisure during the week individually increase the likelihood of grade repetition, school environments that generally use them at the weekend and to receive academic feedback from teachers exert a protective effect at individual level. This once again reveals the importance of effective parental control and support (Álvarez-García et al., 2024) and that ICT use in school is a resource for learning rather than an end in itself (Alé-Ruiz et al., 2024).
In summary, although the results obtained are in line with the literature review regarding individual factors associated with grade repetition, the fundamental development of this study is that it reveals a significant peer effect associated with grade repetition in Spain. In line with prior studies that already pointed to this peer effect in relation to aggregated contextual factors (Ferrão et al., 2017; López et al., 2023; Nieto-Isidro & Martínez-Abad, 2023), our paper adds that aggregated non-cognitive characteristics of a school’s students also exert this effect and with even more intensity than the peer effect observed in contextual factors.
The results of this study encourage us to reflect on whether grade repetition is the most appropriate measure to compensate for academic difficulties and how to use healthy school environments to develop the maximum individual potential of each and every student in our education systems.
Limitations and future studies
The main limitations of this study are related with the characteristics of PISA studies (González-Such et al, 2016; Jornet, 2016). Firstly, unlike other international assessments such as TIMSS or PRILS, PISA tests do not identify the student’s classroom level, which makes it difficult to properly characterise the student’s school environment. This limits the results obtained on the peer effect and future research is necessary on these results with more systematic data. Another essential issue is the cross-cutting nature of PISA assessments. Longitudinal student and school monitoring is not possible as PISA offers 3-yearly panel data, which limits the analysis of non-cognitive factor evolution when grade repetition occurs, making it impossible to draw causal conclusions. Finally, PISA also suffers from limitations in the context questionnaires used. In addition to being self-reported questionnaires, linked to problems of social desirability, given their length and scope, they attempt to measure complex traits and factors with a very limited number of items, affecting their validity.
The specific limitations of this study include that only data from the Spanish sample were used given the particular prevalence of grade repetition in our education system. This may make it difficult to generalise results. Also, variables were pre-selected due to the volume of variables available in PISA 2022. Furthermore, PISA 2022 does not include information on cognitive factors such as intelligence or basic psychological processes so some relevant variables may have been omitted, an issue that can be addressed in future studies.
Taking into account these results and current debate on the use of ICTs in education, future studies on the role of ICTs in repetition would be of unquestionable interest as their individual and aggregated effects are unclear in this study. Future longitudinal studies that focus on studying how the change in group levels of non-cognitive factors whose peer effect has been detected in this study individually affect grade repetition are also recommended.
Acknowledgement
Grant PID2021-125775NB-I00 funded by MCIN/AEI/10.13039/501100011033/ and by ERDF A Way of Making Europe
Referencias bibliográficas
Alé-Ruiz, R., Martínez-Abad, F., & Moral-Marcos, M. T. del.
(2024). Academic engagement and management of personalised active
learning in higher education digital ecosystems.
Allen, C.S., Chen, Q., Willson, V.L., & Hughes, J.N. (2009).
Quality of research design moderates effects of grade retention on
achievement: A meta-analytic, multilevel analysis.
Alvarez-Garcia, M., Arenas, M., & Ibar, R. (2024). Uncovering
student profiles. An explainable cluster analysis approach to PISA 2022.
Arroyo, D.; Constante, I.A. & Asensio, I. (2019). La repetición
de curso a debate: un estudio empírico a partir de PISA 2015.
Bonvin, P., Bless, G. & Schuepbach, M. (2008) Grade retention:
decision-making and effects on learning as well as social and emotional
development.
Bronfenbrenner, U. (1979).
Calero, J., Choi, Á., & Waisgrais, S. (2010). Determinantes del riesgo de fracaso escolar en España: una aproximación a través de un análisis logístico multinivel aplicado a PISA-2006.
Calero, J., Escardíbul, J.O., & Choi, Á. (2012). El fracaso
escolar en la Europa mediterránea a través de PISA-2009: radiografía de
una realidad latente.
Choi, Á. (2018). De padres a hijos: expectativas y rendimiento
académico en España.
Choi, Á., Gil, M., Mediavilla, M., & Valbuena, J. (2018).
Predictors and effects of grade repetition.
Cohen, J. (1988).
Constante, A., Arroyo, D., Sánchez-Munilla, M., & Asensio, I.
(2024). Contribution of machine learning to the analysis of grade
repetition in Spain: A study based on PISA data.
Contini, D., & Salza, G. (2024). Children left behind. New
evidence on the (adverse) impact of grade retention on educational
careers.
Cordero, J.M., Manchón, C., & Simancas, R. (2014). La repetición
de curso y sus factores condicionantes en España.
Ehmke, T., Drechsel, B., & Carstensen, C.H. (2010). Effects of
grade retention on achievement and self-concept in science and
mathematics.
Ferrão, M. E., Costa, P.M., & Matos, D.A.S. (2017). The relevance
of the school socioeconomic composition and school proportion of
repeaters on grade repetition in Brazil: a multilevel logistic model of
PISA 2012.
Fonteyne, L., Duyck, W., & De Fruyt, F. (2017). Program-specific
prediction of academic achievement on the basis of cognitive and
non-cognitive factors.
Gamazo, A., Martínez-Abad, F., Olmos-Migueláñez, S., &
Rodríguez-Conde, M. J. (2018). Evaluación de factores relacionados con
la eficacia escolar en PISA 2015. Un análisis multinivel.
García-Merino, Y., Ferreira, C., & González-Rodríguez, D. (2024).
La promoción automática en la Educación Primaria: comparación entre
países de la Unión Europea.
González-Such, J., Sancho-Álvarez, C., & Sánchez-Delgado, P.
(2016). Background questionnaires of PISA: A study of the assessment
indicators.
Goos, M., Schreier, B.M., Knipprath, H.M.E., De Fraine, B., Van
Damme, J., & Trautwein, U. (2013). How can cross-country differences
in the practice of grade retention be explained? A closer look at
national educational policy factors.
Goos, M., Pipa, J., & Peixoto, F. (2021). Effectiveness of grade
retention: A systematic review and meta-analysis.
Hughes, J.N., West, S.G., Kim, H., & Bauer, S.S. (2018). Effect
of early grade retention on school completion: a prospective study.
Ikeda, M., & García, E. (2014). Grade repetition: A comparative
study of academic and non-academic consequences.
Jacob, B.A., & Lefgren, L. (2009). The effect of grade retention
on high school completion.
Jakubowski, M., & Gajderowicz, T. (2022). Application of
Multilevel Models to International Large-Scale Student Assessment Data.
En M. S. Khine (Ed.),
Jornet, J. (2016). Methodological analysis of the PISA project as
international assessment.
Klapproth, F., & Schaltz, P. (2015). Who is retained in school,
and when? Survival analysis of predictors of grade retention in
Luxembourgish secondary school.
Klapproth, F., Schaltz, P., Brunner, M., Keller, U., Fischbach, A.,
Ugen, S., & Martin, R. (2016). Short-term and medium-term effects of
grade retention in secondary school on academic achievement and
psychosocial outcome variables.
Kretschmann, J., Vock, M., Lüdtke, O., Jansen, M., & Gronostaj,
A. (2019). Effects of grade retention on students’ motivation: A
longitudinal study over 3 years of secondary school.
Lamote, C., Pinxten, M., Van Den Noortgate, W., & Van Damme, J.
(2014). Is the cure worse than the disease? A longitudinal study on the
effect of grade retention in secondary education on achievement and
academic self-concept.
Lee, V. E. (2000). Using Hierarchical Linear Modeling to Study Social
Contexts: The Case of School Effects.
León, J., & Martínez-Abad, F. (2025). The effect of grade
retention on performance in Spanish students: a propensity score
matching approach.
López, L., González-Rodríguez, D. y Vieira, M-J. (2023). Variables
que afectan la repetición en la educación obligatoria en España.
López‐Agudo, L.A., de Guevara Rodríguez, M.L., &
Marcenaro‐Gutiérrez, O. D. (2024). The influence of grade retention on
students´ competences in Spain.
López-Rupérez, F., García-García, I., & Expósito-Casas, E.
(2021). La repetición de curso y la graduación en Educación Secundaria
Obligatoria en España: análisis empíricos y recomendaciones políticas.
Marsh, H. W. (2016). Cross-cultural generalizability of year in
school effects: Negative effects of acceleration and positive effects of
retention on academic self-concept.
Martin, A. J. (2011). Holding back and holding behind: Grade
retention and students’ non-academic and academic outcomes.
Nieto-Isidro, S., & Martínez-Abad, F. (2023). Repetición de curso
y su relación con variables socioeconómicas y educativas en España.
OECD (2011), “When Students Repeat Grades or Are Transferred Out of
School: What Does it Mean for Education Systems?”,
OECD. (2022).
OECD. (2023).
Paloyo, A. R. (2020). Chapter 21 - Peer effects in education: Recent
empirical evidence. En S. Bradley & C. Green (Eds.),
Pedraja, F., Santín, D., & Simancas, R. (2016). The impact of
immigrant concentration in schools on grade retention in Spain: a
difference-in-differences approach.
Peixoto, F., Monteiro, V., Mata, L., Sanches, C., Pipa, J., &
Almeida, L.S. (2016). “To be or not to be retained… that’s the
question!” Retention, self-esteem, self-concept, achievement goals, and
grades.
Pipa, J., Daniel, J.R., & Peixoto, F. (2024). Effects of grade
retention in lower secondary education on students´ self‐concept,
self‐esteem, goal orientations, and school career.
Rodríguez, D. (2022). Grade retention, academic performance and
motivational variables in Compulsory Secondary Education: a longitudinal
study.
Rodríguez, D. & Batista, F.J. (2021). La repetición de curso en
educación secundaria y su relación con variables motivacionales.
Scheerens, J. (1990). School Effectiveness Research and the
Development of Process Indicators of School Functioning.
Suberviola, I. (2025). La influencia de la historia escolar en el
Abandono Escolar Temprano.
Valbuena, J., Mediavilla, M., Choi, Á., & Gil, M. (2021). Effects
of grade retention policies: A literature review of empirical studies
applying causal inference.
Van Canegem, T., Vandelannote, I., Van Houtte, M., & Demanet, J.
(2024). Retained for life: A longitudinal study on the effects of grade
retention in secondary education on higher education enrollment and
self-efficacy.
Wu, W., West, S.G., & Hughes, J.N. (2008). Effect of retention in
first grade on children´s achievement trajectories over 4 years: A
piecewise growth analysis using propensity score matching.
Información de contacto / Contact information: Fernando Martínez-Abad. Universidad de Salamanca, Instituto Universitario de Ciencias de la Educación. Paseo Canalejas, 169 37008 Salamanca. E-mail: fma@usal.es