Cognitive demand in Mathematics assessment criteria of the Galician curriculum: teaching implications
Demanda cognitiva en criterios de evaluación de Matemáticas del currículo de Galicia: implicaciones docentes
https://doi.org/10.4438/1988-592X-RE-2025-409-699
Laia Francina Tugores Blanco
Universidade de Vigo
https://orcid.org/0000-0001-7679-7683
Manuela Raposo-Rivas
Universidade de Vigo
https://orcid.org/0000-0001-7781-7818
Olalla García Fuentes
Universidade de Vigo
https://orcid.org/0000-0001-9084-0078
Abstract
The purpose of this research is to identify and quantify the
cognitive demand associated with the assessment criteria of Mathematics
subjects in the Secondary Education curriculum of the Autonomous
Community of Galicia, in order to detect possible imbalances regarding
mathematical domains and academic years, whose correction leads to an
improvement in curriculum implementation. The study analyzes the
cognitive processes from Bloom’s taxonomy, as revised by Anderson and
Krathwohl, and those of the PASS model (
To achieve this, a multimethod investigation with a concurrent nested
design is conducted, comprising a descriptive content analysis and a
statistical treatment of the data. An
The results show that the
Keywords:
cognitive processes, assessment criteria, curriculum, mathematics, Secondary Education
Resumen
El propósito de esta investigación es identificar y cuantificar la
demanda cognitiva asociada a los criterios de evaluación de las
asignaturas de Matemática del currículo de Educación Secundaria
Obligatoria de la Comunidad Autónoma de Galicia, para detectar posibles
desequilibrios respecto a los sentidos matemáticos y cursos académicos,
cuya corrección lleve a mejorar la implementación del currículo. Se
analizan los procesos cognitivos de la taxonomía de Bloom, revisada por
Anderson y Krathwohl, y del modelo PASS (
Para ello, se realiza una investigación multimétodo con un diseño
anidado concurrente que consta de un análisis de contenido de enfoque
descriptivo y un tratamiento estadístico de los datos. Se utiliza una
ficha de registro elaborada
Los resultados muestran que los procesos
Palabras clave:
procesos cognitivos, criterios de evaluación, currículo, matemáticas, Educación SecundariaIntroduction
Cognitive processes are "the procedures carried out by human
beings to acquire knowledge, in which very diverse faculties are
involved, such as intelligence, attention, memory, and language, which
may operate either consciously or unconsciously" (Suárez, 2016, p.
5). Regarding those involved in learning, the American psychologist and
pedagogue Benjamin Bloom publishes, in the mid-20th century (1956), a
taxonomy bearing his name, based on two types of thinking skills:
lower-order thinking skills (LOST), namely
In the field of mathematics, the cognitive processes involved in the Revised Bloom’s Taxonomy incorporate characteristics specific to the area of knowledge as direct complements. For instance, symbols, concepts, formulas, propositions, or operational procedures are recalled; reasoning processes, theorems, or explicit data from exercises are understood; mechanical procedures or methods for solving similar tasks are applied; abstract expressions, the rationale behind hypotheses, or relationships between different notions are analyzed; various approaches to reaching a solution or techniques for tackling the same problem are evaluated; and interpretative graphs, innovative proposals, or extrapolations to other mathematical contexts and scientific-social disciplines are created. According to Radmehr and Drake (2018), this taxonomy holds the greatest potential for the entire educational process in mathematics.
On the other hand, the so-called PASS theory of intelligence,
formulated by Das et al. (1994), postulates the existence of four
cognitive processes involved in mental activity, which typically operate
in an interrelated manner:
These PASS processes are closely linked to the actions required for
solving mathematical tasks. Thus,
Different studies have examined the enhancement of PASS processes in
mathematical learning. Chronologically, Kirby and Williams (1991)
identify difficulties related to
At the same time, the level of complexity of thinking required of
students to complete a given task is referred to as cognitive demand or
For its part, the
The Webb, SS models, and the RBT and PASS cognitive processes exhibit certain interconnections. In the field of mathematics, considering the actions specified in each of them, we establish the correspondences presented in Figure I.
FIGURE I. Correspondences between the RBT, Webb, SS, and PASS models
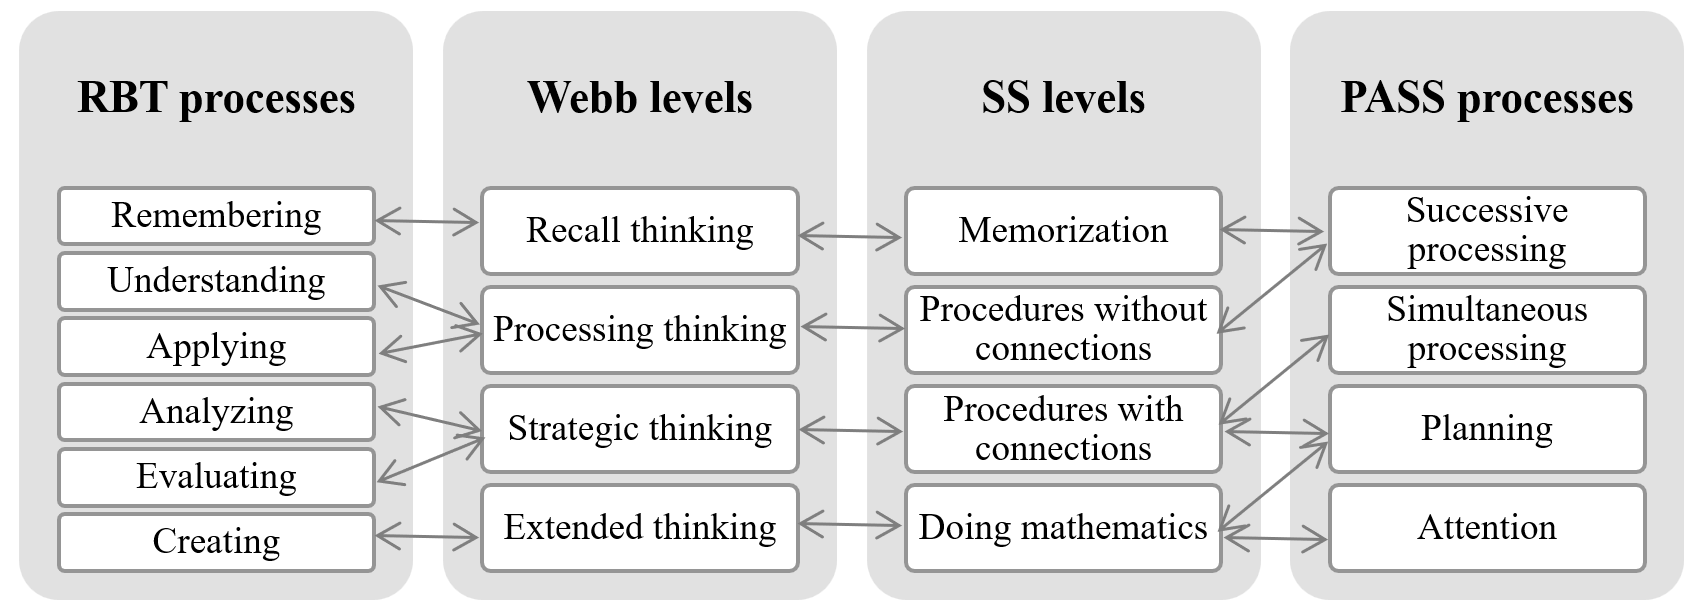
Source: Compiled by the authors
Regarding curricular aspects, Sarmiento and Sarmiento (2023) conducted a study linking the RBT cognitive processes with the descriptors of key competencies in the Primary Education curriculum, to highlight their relationships with knowledge areas and identify potential groupings. Their results show five groups: 1) Artistic Education, related to Linguistic Communication Competence and Cultural Awareness and Expression Competence; 2) Digital Competence; 3) Mathematics and Physical Education, linked to Mathematical, Science, Technology, and Engineering Competence (STEM) and Entrepreneurial Competence; 4) Natural, Social, and Cultural Environment Knowledge, along with Civic and Ethical Values Education, grouped under Citizenship Competence, Personal, Social, and Learning-to-Learn Competence; 6) Spanish Language and Literature and Foreign Language, associated with Multilingual Competence. Thus, their findings confirm that Mathematics contributes to the development of two key competencies: STEM and Entrepreneurial Competence.
Concerning the Secondary Education curriculum (ESO), the study
highlights the importance of
In the field of mathematics, real-life problems are solved concerning
quantity, the shape and size of objects, and the randomness of events.
Each of these variables requires specific knowledge and skills,
collectively known as
Ruiz-Hidalgo et al. (2019) highlight the inherent global nature of mathematical domains, as it places equal emphasis on conceptual understanding and the development of computational skills and techniques. Furthermore, the interaction between mathematical content and domains has been analyzed by the Spanish Mathematics Committee (2021), which presented a study identifying the content areas that should receive more or less focus at different educational stages to effectively develop mathematical domains.
With the aforementioned references, the present research aims, as a general objective, to identify the cognitive processes associated with the Revised Bloom’s Taxonomy and the PASS model, within the assessment criteria of Mathematics in the ESO curriculum in the Autonomous Community of Galicia. All of this with the purpose of identify potential “cognitive mismatches” in this educational stage and propose relevant recommendations for improving their implementation in the classroom. Accordingly, the specific objectives are:
- To determine the predominant cognitive demand within the assessment criteria for each mathematical domain.
- To quantify the cognitive demands present in the assessment criteria in relation to the academic year.
Method
The present study is part of a broader research project (Tugores, 2024) aimed at determining the relationship between cognitive processes and the mathematics curriculum in ESO, knowing and analyzing both its curriculum and the most commonly used didactic materials by teachers for the instruction of the subject. The present study focuses exclusively on the curricular perspective.
A multimethod research approach is adopted, following a concurrent nested design with a dominant model (Hernández-Sampieri, 2006). The method guiding the study, used to identify cognitive demand, is qualitative and is enriched with quantitative data and a descriptive approach, allowing for the quantification of the demands present in the assessment criteria and facilitate the characterization and manifestation of a given phenomenon by assessing various components or dimensions (Hernández-Sampieri, 2006).
In Spain, each autonomous community establishes its own ESO academic curricula; for this study, the curriculum of Galicia is selected. A content analysis of Decree 156/2022 is conducted, where the units of analysis correspond to the assessment criteria in mathematics. These criteria are categorized according to mathematical domains and academic years. As noted by Colás and De Pablos (2012), content analysis is the most appropriate methodological approach for the study of legislation. Thus, a total of 186 assessment criteria are analyzed, whose distribution by academic years and domains is shown in Table I.
TABLE I. Assessment criteria by academic years and mathematical domains
| Academic years | Total | ||||||
|---|---|---|---|---|---|---|---|
| 1st | 2nd | 3rd | 4st A | 4st B | |||
| Domains | Numerical | 5 | 5 | 6 | 6 | 7 | 29 |
| Measurement | 5 | 5 | 4 | 3 | 5 | 22 | |
| Spatial | 7 | 7 | 6 | 6 | 6 | 32 | |
| Algebraic | 8 | 8 | 8 | 9 | 8 | 41 | |
| Stochastic | 8 | 8 | 8 | 8 | 7 | 39 | |
| Socio-affective | 5 | 5 | 5 | 4 | 4 | 23 | |
| Total | 38 | 38 | 37 | 36 | 37 | 186 | |
Source: Compiled by the authors
Instrument
For data collection, an
The application of the RBT and PASS scales to the units of analysis yielded Cronbach’s alpha coefficients of .748 and .726, respectively, confirming their reliability. The rubric was independently applied to the assessment criteria by two of the authors, achieving a high level of inter-rater agreement (Cohen’s kappa coefficient = .821), and, in cases of discrepancy, the assessment of a third evaluator was considered.
The development of this instrument is based on multiple sources:
Decree 156/2022, the cognitive processes defined in RBT, the processes
of the PASS model, and the corresponding cognitive actions outlined in
Anderson and Krathwohl (2001). For instance, a definition corresponds to
Data Analysis
The data analysis is carried out based on two categories (RBT and
PASS) and ten subcategories: six from the RBT category
(
TABLE II. RBT and PASS categories
| Category | Subcategory | Meaning |
|---|---|---|
| RBT | Remembering | Utilizing memory to generate or retrieve definitions, facts, or lists, or to recite previously learned information. |
| Understanding | Constructing meaning from different types of functions, whether through written or graphical messages, or activities such as interpreting, exemplifying, classifying, summarizing, inferring, comparing, or explaining. | |
| Applying | Carry out or use a procedure through execution or implementation. | |
| Analyzing | Decomposing materials or concepts into their constituent parts to determine how these parts relate to each other, how they interconnect, or how they correspond to a broader structure or overarching purpose. | |
| Evaluating | Making judgments based on criteria and standards through verification and critique. | |
| Creating | Assembling elements to form a coherent or functional whole; reorganizing components into a new pattern or structure through generation, planning, or production. | |
| PASS | Planning | The use of effective strategies to achieve the desired goal and self-regulation, which is explained through functions such as cognitive control in selecting the appropriate function. |
| Attention | The capability to perform functions that enable focused and selective cognitive activity, within a defined time frame. | |
| Simultaneous processing | The ability to integrate separate stimuli into a unified whole and recognize the relationships between them, as well as to make analytical inferences that may result from higher-order thinking. | |
| Successive processing | A process in which stimuli are recalled by placing them in a specific sequential order, defined as memory. |
Source: Adapted from Anderson & Krathwohl (2001) and Ergin (2021).
Numerical cognitive scales are defined for the RBT and PASS
processes. Unlike the scale proposed by Benedicto (2018), these scales
are applicable to all types of mathematical problems. The levels of
cognitive demand are quantified by assigning a numerical value to each
RBT and PASS process within respective ordinal scales, which serve as
measurement instruments. The RBT processes are ranked according to their
position in the cognitive hierarchy:
Regarding PASS processes, the assessments of Pérez-Álvarez and
Timoneda-Gallart (2000) are considered: “Sequential processing is less
complex, less intricate, and more primitive than simultaneous
processing, which, in turn, is less intricate than the planning
function, the most phylogenetically advanced” (p. 612) and Turégano
(2019): “In the PASS model, attention is a more complex process because,
in addition to focusing resources on the stimulus to be processed and
resisting interference from irrelevant ones, it also involves the
minimal necessary mental activation required for a specific task to
occur” (p. 10). Accordingly, PASS processes are ranked from least to
most complex as follows:
A frequency analysis of the cognitive processes is carried out, by
mathematical domains and academic years, using the χ² test; the
calculation of the mean scores of cognitive demand, along with their
confidence intervals, and the comparisons of such scores, using the
Kruskal-Wallis H test and the Mann-Whitney U test. Statistical
computations are carried out using SPSS software. In all hypothesis
tests, decisions are made at a .05 significance level. A difference is
considered statistically significant when the
Procedure
All assessment criteria in the mathematics curriculum for all academic years of Compulsory Secondary Education are labelled, identifying the associated level of cognitive demand. In the curriculum for the fourth year, a distinction is made between Mathematics A (applied mathematics) and Mathematics B (academic mathematics), which are denoted as 4th A and 4th B, respectively. Following the guidelines of Decree 156/2022, each label consists of the prefix CE (Assessment Criterion), followed by two digits. The first digit corresponds to a mathematical domain (1 = numerical, 2 = measurement, 3 = spatial, 4 = algebraic, 5 = stochastic, and 6 = socio-affective), while the second digit indicates the criterion’s order within the list. Examples of this labelling system are presented in Tables III and IV. These tables illustrate the process of mapping the cognitive processes from RBT and PASS, respectively, to the assessment criteria in two mathematical domains, for this implementation and analysis, Excel is used.
TABLE III. RBT cognitive processes in an assessment criterion for 1st and 2nd year of ESO
| Block 2: Measurement domain | ||||||
|---|---|---|---|---|---|---|
Remembering 1 |
Understanding 2 |
Applying 3 |
Analyzing 4 |
Evaluating 5 |
Creating 6 |
|
| 1st and 2nd year | ||||||
| CE2.1. Investigate and verify simple conjectures in a guided manner, by analyzing patterns, properties and relationships. | x | x | ||||
Source: Compiled by the authors.
TABLA IV. PASS cognitive processes in an assessment criterion for 1st, 2nd and 3rd year of ESO
| Block 6: Socio-affective domain | ||||
|---|---|---|---|---|
Successive processing 1 |
Simultaneous processing 2 |
Planning 3 |
Attention 4 |
|
| 1st, 2nd and 3rd year | ||||
| CE6.2. Manage personal emotions and develop mathematical self-concept as a tool for fostering positive expectations when facing new mathematical challenges. | x | x | ||
Source: Compiled by the authors.
Results
In the Mathematics subjects of ESO, a total of 186 assessment criteria have been analyzed, but considering their propaedeutic nature, only 57 are distinct (30.6%). Within these criteria, a total of 678 cognitive processes have been identified. Next, the frequencies and the existence of significant differences in cognitive demand presented by the evaluation criteria are examined, according to the RBT and PASS processes.
RBT Cognitive Processes in the Assessment Criteria
Overall, the
Table V presents the distribution of RBT cognitive processes across different mathematical domains.
TABLE V. Frequencies of RBT processes by mathematical domains
| Domains | Numerical | 10 | 5 | 16 | 13 | 5 | 11 |
| Measurement | 4 | 4 | 20 | 8 | 8 | 10 | |
| Spatial | 14 | 6 | 24 | 8 | 10 | 13 | |
| Algebraic | 14 | 7 | 22 | 11 | 15 | 19 | |
| Stochastic | 16 | 6 | 25 | 16 | 12 | 18 | |
| Socio-affective | 5 | 5 | 15 | 10 | 15 | 5 | |
| Total | 63 | 33 | 122 | 66 | 65 | 76 | |
Source: Compiled by the authors
In each mathematical domain, the predominant process is
In some cases, the
Actions such as debating, expressing opinions, or making judgments
are actions closely linked to the formulation of strategies for solving
mathematical tasks, particularly, to the cognitive process of
The distribution of RBT cognitive processes across academic years is presented in Table VI.
TABLE VI. Frequencies of RBT processes in assessment criteria by academic year
| Academic years | 1st | 14 | 7 | 22 | 12 | 12 | 13 |
| 2nd | 15 | 6 | 22 | 12 | 11 | 12 | |
| 3rd | 15 | 6 | 23 | 12 | 10 | 13 | |
| 4th A | 10 | 8 | 27 | 15 | 17 | 19 | |
| 4th B | 9 | 6 | 28 | 15 | 15 | 19 | |
| Total | 63 | 33 | 122 | 66 | 65 | 76 | |
Source: Compiled by the authors
In all academic years,
TABLE VII. Frequencies of RBT processes by grouped academic years
| Academic years | 1st, 2nd and 3rd | 44 | 19 | 67 | 36 | 33 | 38 |
| 4th A and 4th B | 19 | 14 | 55 | 30 | 32 | 38 | |
| Total | 63 | 33 | 122 | 66 | 65 | 76 | |
Source: Compiled by the authors
In the first three years, the predominant process is
The RBT cognitive demand, considering the mean score based on the
uniform gradation of all processes within the assessment criteria, is
3.62 (
GRAPH I. Mean level of RBT cognitive demand for each mathematical domain
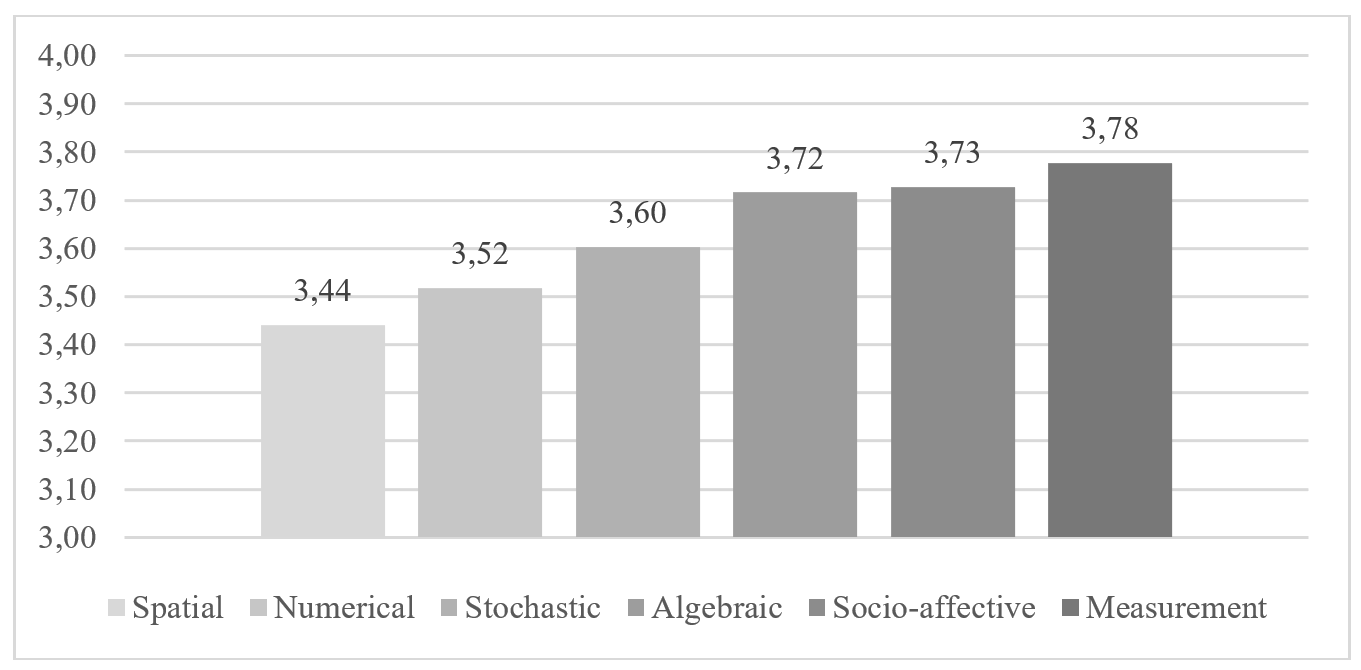
Source: Compiled by the authors
The measurement domain (3.78) exhibits the highest RBT cognitive
demand, primarily due to the minimal involvement of
For the combined first three years of ESO, the mean score on a
0-to-10 scale is 4.92, while for the two fourth-year courses, it is
5.66. The Mann-Whitney
PASS Cognitive Processes in the Assessment Criteria
TABLE VIII. Frequencies of PASS processes by mathematical domains
| Domains | Numerical | 8 | 8 | 10 | 7 |
| Measurement | 4 | 6 | 13 | 6 | |
| Spatial | 9 | 10 | 18 | 4 | |
| Algebraic | 19 | 17 | 11 | 9 | |
| Stochastic | 16 | 14 | 13 | 16 | |
| Socio-affective | 5 | 5 | 15 | 10 | |
| Total | 61 | 60 | 80 | 52 | |
Source: Compiled by the authors
An example of
Table IX displays the distribution of PASS process frequencies by course levels, grouping the first three years together and, separately, the two fourth-year courses corresponding to Applied Mathematics and Academic Mathematics.
TABLE IX. Frequencies of PASS processes by grouped academic years
| Academic years | 1st, 2nd and 3rd | 37 | 35 | 53 | 33 |
| 4st A and 4st B | 24 | 25 | 27 | 19 | |
| Total | 61 | 60 | 80 | 52 | |
Source: Compiled by the authors
Regarding PASS cognitive demand, the mean score across all processes
is 2.51 (
GRAPH II. Mean level of PASS cognitive demand for each mathematical domain
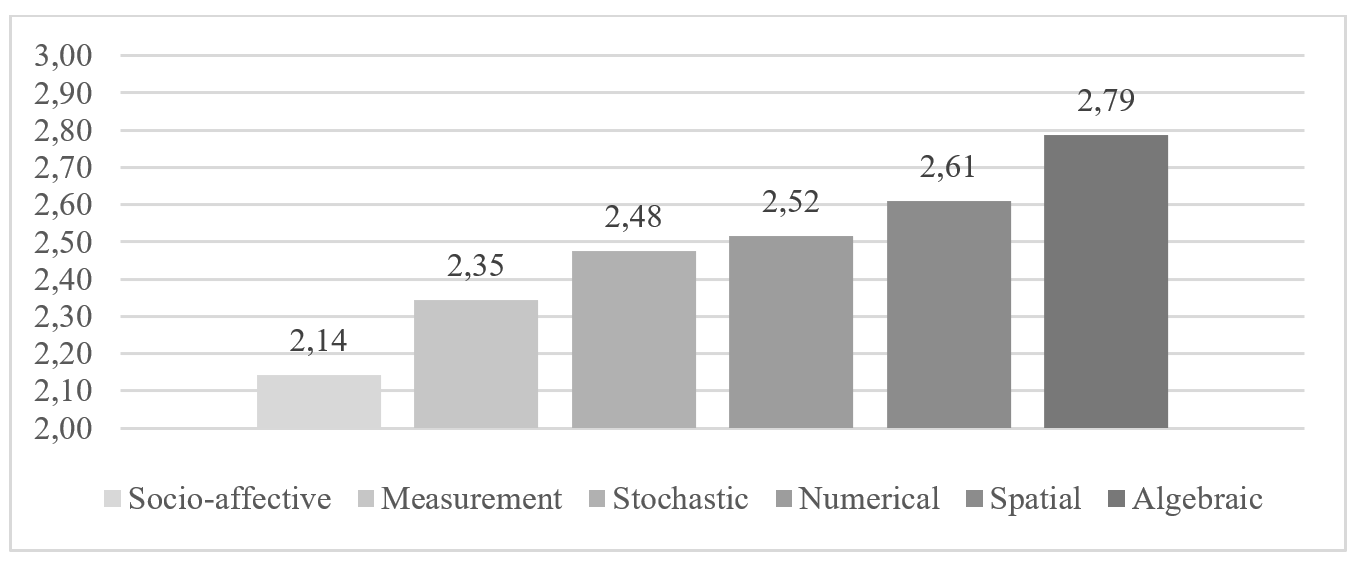
Source: Compiled by the authors
All score values fall within the range of 2.14 to 2.79, with the mean
being exceeded in the numerical, spatial, and algebraic domains. The
Kruskal-Wallis
In summary, the obtained results are shown in Table X, which presents the highest and lowest frequencies of RBT and PASS processes, as well as cognitive demand across mathematical domains and academic levels.
TABLE X. Frequencies and cognitive demand of RBT and PASS processes
| Processes | RBT | PASS | |
|---|---|---|---|
| Frequency | Highest/Lowest | Applying/Understanding | Simultaneous processing/ Successive processing |
| Proportions by domains | Different | Equal | |
| Proportions by academic years | Equal | Equal | |
| Cognitive demand | Mean (0-to-10 scale) | 5.246 | 5.033 |
| By domains | Same | Same | |
| Domain with highest cognitive demand | Measurement | Algebraic | |
| By academic years | Different | Same |
Source: Compiled by the authors
Discussion and Conclusions
The aim of this study has been to analyze the distribution of the RBT and PASS processes associated with the assessment criteria in Mathematics for Compulsory Secondary Education, as well as to quantify and assess their cognitive demand considering different mathematical domains and academic years. This assessment has been possible through the introduction of a uniform gradation for each cognitive model.
Regarding distribution, the fact that, within the assessment
criteria,
This distribution is also consistent across the different
mathematical domains, where
Considering the different academic years in ESO, by the fourth
academic year, while
Undoubtedly, a higher-order process may require less effort than a lower-order one; for instance, finding an immediate example is easier than recalling a long definition. Therefore, if this category were assessed numerically, an additional numerical value could be incorporated to the uniform gradations, establishing new and more comprehensive hierarchical cognitive scales. This aligns with the modification made by Benedicto et al. (2015) to the Smith and Stein (1998) model by introducing a category they call “required effort”.
On the other hand, given that
The cognitive demands of RBT and PASS, as explicitly stated in the assessment criteria, can be considered to meet a “cognitive passing grade”. These demands are balanced across mathematical domains. However, a higher RBT demand, but not PASS, is observed in the two Mathematics subjects of the 4th year of ESO compared to those of the first three academic years. This “cognitive leap” could be mitigated by increasing the level of rigor at the end of the 3rd year. Therefore, the role of the teacher is crucial, as they are responsible for the implementation of the curriculum in the classroom. As Ramos and Casas (2018) state, “if a true alignment between educational standards, textbooks, and assessments is ensured, it helps improve curriculum implementation processes, better evaluate assessment results, and engage teachers in improvement processes” (p. 1134).
Although mathematics teachers, according to Parrish and Byrd (2022), strive to maintain the cognitive demand of the tasks implemented, this does not necessarily contribute to increasing mathematical competence. Having a quantification of curricular demand now makes it possible to establish a threshold that the level of rigor should not exceed, if the goal is to increase the complexity of classroom tasks, as suggested by these authors. In the case of pre-service teachers, Pincheira and Alsina (2021) confirm a trend of this group (81.8%) to design low-level tasks for their students. If the cognitive demand levels of the RBT and PASS processes in the examined assessment criteria are considered separately, the resulting distributions are 51.3% and 47.8%, respectively. This suggests that future teachers set the “cognitive bar” relatively low compared to students´ theoretical capabilities and contrary to the expectations set by the assessment criteria.
Ramos and Casas (2018) argue that if the proportional distribution of Smith and Stein’s (1998) levels is similar across educational standards, textbooks, and assessments, then curriculum implementation improves, assessment results gain more significance, and teachers become more involved. Nevertheless, these authors do not provide a numerical representation of cognitive demand. The fact that this study does so, in a broader context than learning standards, enables comparisons between different demands, independent of how cognitive processes are distributed.
The results obtained have implications for teaching practice, as this study can serve as a reference for teachers when selecting tasks that align with assessment criteria, based on their respective mathematical domains and the academic year of ESO in which they are implemented. This selection should consider students’ specific characteristics, prior classroom activities, and the reinforcement or attenuation of particular content, among other factors. Teachers can periodically adjust the cognitive demand of activities to ensure that their complexity and the distribution of cognitive processes remain aligned with curricular requirements. Additionally, classroom diversity can be addressed by balancing the cognitive load of tasks with students’ abilities, especially in lower ESO levels. Furthermore, understanding the distribution of cognitive processes by mathematical domains and their associated cognitive demands may be valuable when designing didactic scenarios that integrate multiple mathematical domains, if the aim is for such interactions between mathematics and real-world contexts to align with what the curriculum establishes.
Limitations
A key limitation of this study lies in the inherent subjectivity involved in determining the cognitive processes associated with certain assessment criteria, whose wording is overly generic. To mitigate this issue, a dual coding process has been implemented in such cases.
Another difficulty has been the inability to compare the values obtained in this research with “individualized” cognitive demands, those that result from the specific way each teacher designs certain tasks to practically develop the assessment criteria.
Prospective
One of the advantages of this analysis is that it provides an instrument and procedure that can be extrapolated to Mathematics curricula at other educational stages or even to different subjects, enabling appropriate comparisons by academic years or mathematical domains within the framework established by Decree 156/2022. Furthermore, cognitive demand levels could be assessed in Secondary Education Mathematics curricula from other autonomous communities, allowing for corresponding analogies or differences to be established.
Referencias bibliográficas
Anderson, L. W., & Krathwohl, D. R. (2001).
Benedicto, C. (2018).
Benedicto, C., Jaime, A., & Gutiérrez, A. (2015). Análisis de la
demanda cognitiva de problemas de patrones geométricos. En C. Fernández,
M. Molina, & N. Planas (Eds.),
Colás, P., & De Pablos, J. (2012). Aplicaciones de las
tecnologías de la información y la comunicación en la investigación
cualitativa.
Comité Español de Matemáticas. (2021).
Das, J. P., Naglieri, J. A., & Kirby, J. R. (1994).
Deaño, M., Alfonso, S., Diniz, A. M., Iglesias-Sarmiento, V., &
Das, J. P. (2023). Math modules training improves math achievement &
associated cognitive processing.
Deaño, M., Alfonso, S., & Fernández, M. J. (2006). El D.N: CAS
como sistema de evaluación cognitiva para el aprendizaje. En
Decreto 156/2022, de 15 de septiembre, por el que se establecen la
ordenación y el currículo de la Educación Secundaria Obligatoria en la
Comunidad Autónoma de Galicia.
Ergin, Ü. T. (2021). Testing the effectiveness of PASS theory-based
cognitive games on students’ cognitive processing areas and academic
performance.
Hernández-Sampieri, R. (2006). Definición del alcance de la
investigación a realizar: exploratoria, descriptiva, correlacional o
explicativa. En
Iglesias-Sarmiento, V., Alfonso, S., Conde, A., & Deaño, M.
(2014). Predictores del rendimiento aritmético en 4º de Educación
Primaria.
Iglesias-Sarmiento, V., Deaño, M., Conde, A., Alfonso, S., Limia, S.,
& Tellado, F. (2017). Resolución de problemas aritméticos en alumnos
con dificultades de aprendizaje y TDAH.
Kirby, J. R., & Williams, N. (1991).
Ley Orgánica 3/2020, de 29 de diciembre, por la que se modifica la
Ley Orgánica 2/2006, de 3 de mayo, de Educación. BOE núm. 340, de 30 de
diciembre de 2020.
López, F. (2022). El enfoque del currículo por competencias: un
análisis de la LOMLOE.
National Council of Teachers of Mathematics. (2014).
Olivares, D., Lupiáñez, J. L., & Segovia, I. (2020). Roles and
characteristics of problems solving in the mathematics curriculum: A
review.
Parrish, C. W., & Bryd, K. O. (2022). Cognitively demanding
tasks: Supporting students and teachers during engagement and
implementation.
Pérez-Álvarez, F., & Timoneda-Gallart, C. (2000). La dislexia
como disfunción del procesamiento secuencial.
Pincheira, N., & Alsina, Á. (2021). Explorando la demanda
cognitiva de tareas matemáticas de búsqueda de patrones diseñadas por
futuros profesores de Educación Primaria. En P. D. Diago, D. F. Yáñez,
M. T. González-Astudillo, & D. Carrillo (Eds.),
Radmehr, F., & Drake, M. (2018). Revised Bloom’s taxonomy and
major theories and frameworks that influence the teaching, learning, and
assessment of mathematics: A comparison.
Ramos, L. A., & Casas, L. M. (2018). Demanda cognitiva de
estándares educativos y libros de texto para la enseñanza del álgebra en
Honduras.
Real Decreto 217/2022, de 29 de marzo, por el que se establece la
ordenación de las enseñanzas mínimas de la Educación Secundaria
Obligatoria.
Ruiz-Hidalgo, J. F., Flores, P., Ramírez-Uclés, R., &
Fernández-Plaza, J. A. (2019). Tareas que desarrollan el sentido
matemático en la formación inicial de profesores.
Sarmiento, J. A., & Sarmiento, E. (2023). El currículo de
primaria desde la LOMLOE: análisis de las relaciones entre sus
elementos.
Smith, M. S., & Stein, M. K. (1998). Selecting and creating
mathematical tasks: From research to practice.
Suárez, A. (2016).
Tellado, F. (2001).
Turégano, I. (2019).
Webb, N. L. (1997).
Información de contacto / Contact info: Laia Francina Tugores Blanco. Universidade de Vigo, Facultad de Educación y Trabajo Social, Departamento de Matemáticas. E-mail: laia.francina.tugores@uvigo.gal